Fullerton Securities' Weekly Report : 16th October
•
0 likes•121 views

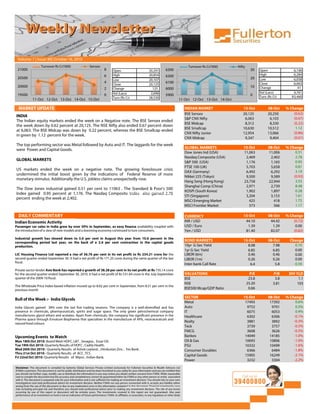
The Indian equity markets ended the week on a negative note, with the BSE Sensex down 0.62% and Nifty down 0.67%. Metal and auto sectors performed well, gaining around 0.5-0.6%, while power and capital goods lost around 2%. Globally, US markets were mixed with Dow and S&P 500 gaining around 1% while Nasdaq gained 2.78%. Gold gained 2.1% while crude oil lost 1.6% for the week.

Recommended
Recommended
More Related Content
What's hot
What's hot (19)
Viewers also liked
Viewers also liked (10)
Similar to Fullerton Securities' Weekly Report : 16th October
Similar to Fullerton Securities' Weekly Report : 16th October (20)
More from Fullerton Securities
More from Fullerton Securities (20)
Recently uploaded
Recently uploaded (20)
Fullerton Securities' Weekly Report : 16th October
- 1. Volume: 1 | Issue: 80| October 16, 2010 Turnover Rs Cr('000) Sensex Turnover Rs Cr('000) Nifty 21000 8 Open 20,291 6300 30 Open 6,106 6 High 20,854 6200 High 6,284 20500 Low 20,107 20 Low 6,058 4 6100 Close 6,063 Close 20,125 20000 10 Change 41 2 Change 125 6000 Vol (Lacs) 2,696 Vol (Lacs) 4,761 19500 0 5900 0 Turn (Rs Cr) 83,460 11-Oct 12-Oct 13-Oct 14-Oct 15-Oct Turn (Rs Cr) 28,530 11-Oct 12-Oct 13-Oct 14-Oct MARKET UPDATE INDIAN MARKET 15-Oct 08-Oct % Change BSE Sensex 20,125 20,250 (0.62) INDIA S&P CNX Nifty 6,063 6,103 (0.67) The Indian equity markets ended the week on a Negative note. The BSE Sensex ended BSE Midcap 8,312 8,330 (0.22) the week down by 0.62 percent at 20,125. The NSE Nifty also ended 0.67 percent down BSE Smallcap 10,630 10,512 1.12 at 6,063. The BSE Midcap was down by 0.22 percent, whereas the BSE Smallcap ended CNX Nifty Junior 12,954 13,066 (0.86) in green by 1.12 percent for the week. CNX Midcap 9,347 9,404 (0.61) The top performing sector was Metal followed by Auto and IT. The laggards for the week GLOBAL MARKETS 15-Oct 08-Oct % Change were Power and Capital Goods. Dow Jones Ind (USA) 11,063 11,006 0.51 Nasdaq Composite (USA) 2,469 2,402 2.78 GLOBAL MARKETS S&P 500 (USA) 1,176 1,165 0.95 FTSE 100 (UK) 5,703 5,658 0.81 US markets ended the week on a negative note. The growing foreclosure crisis DAX (Germany) 6,492 6,292 3.19 undermined the initial boost given by the indications of Federal Reserve of more (0.93) Nikkei 225 (Tokyo) 9,500 9,589 monetary stimulus. Additionally the U.S. jobless claims unexpectedly rose. Hang Seng (Hong Kong) 23,758 22,944 3.55 Shanghai Comp (China) 2,971 2,739 8.48 The Dow Jones industrial gained 0.51 per cent to 11063 . The Standard & Poor's 500 KOSPI (South Korea) 1,902 1,897 0.28 Index gained 0.95 percent at 1,176. The Nasdaq Composite Index also gained 2.78 STI (Singapore) 3,204 3,153 1.61 percent ending the week at 2,402. MSCI Emerging Market 425 418 1.75 MSCI Frontier Market 573 566 1.17 DAILY COMMENTARY CURRENCY 15-Oct 08-Oct % Change Indian Economic Activity INR / USD 44.10 44.42 (0.72) Passenger car sales in India grew by over 30% in September, as easy finance availability coupled with USD / Euro 1.39 1.39 0.00 the introduction of a slew of new models and a booming economy continued to lure consumers. Yen / USD 81.40 82.07 (0.82) Industrial growth has slowed down to 5.6 per cent in August this year from 10.6 percent in the corresponding period last year, on the back of a 2.6 per cent contraction in the capital goods BOND MARKETS 15-Oct 08-Oct Change production. 10yr G-Sec Yield 8.08 7.98 0.10 1yr G-Sec Yield 6.85 6.85 0.00 LIC Housing Finance Ltd reported a rise of 36.76 per cent in its net profit to Rs 234.21 crore for the LIBOR (6m) 0.46 0.46 0.00 second quarter ended September 30. It had a net profit of Rs 171.25 crore during the same quarter of the last LIBOR (1m) 0.26 0.26 0.00 fiscal. Inter-bank Call Rate 6.4 5.8 0.59 Private sector lender Axis Bank has reported a growth of 38.28 per cent in its net profit at Rs 735.14 crore for the second quarter ended September 30, 2010. It had a net profit of Rs 531.64 crore in the July-September VALUATIONS P/E P/B DIV YLD quarter of the 2009-10 fiscal. BSE 23.8 3.8 1.1 NSE 25.20 3.81 103 The Wholesale Price Index-based inflation moved up to 8.62 per cent in September, from 8.51 per cent in the previous month BSE500 Mcap/GDP Ratio 0.66 SECTOR 15-Oct 08-Oct % Change Bull of the Week :- India Glycols Metal 17493 17392 0.6% India Glycols gained 38% over the last five trading sessions. The company is a well-diversified and has Auto 9752 9701 0.5% presence in chemicals, pharmaceuticals, spirits and sugar space. The only green petrochemical company IT 6075 6053 0.4% manufactures glycol ethers and acetates. Apart from chemicals, the company has significant presence in the Healthcare 6302 6306 -0.1% Pharma space through Ennature Biopharma that specialises in the manufacture of APIs, neutraceuticals and Realty 3881 3892 -0.3% natural food colours. Teck 3739 3757 -0.5% FMCG 3608 3626 -0.5% Upcoming Events to Watch Bankex 14049 14185 -1.0% Mon 18th Oct 2010:-Board Meet HDFC, L&T , Sesagoa , Essar Oil. Oil & Gas 10693 10806 -1.0% Tue 19th Oct 2010:-Quarterly Results of HDFC , Cadila Health. PSU 10332 10499 -1.6% Wed 20th Oct 2010:- Quarterly Results of Ashok Leyland , ,Hindustan Zinc , Yes Bank . Consumer Durables 6366 6484 -1.8% Thru 21st Oct 2010:- Quarterly Results of ACC ,TCS . Capital Goods 15905 16249 -2.1% Fri 22nd Oct 2010:-Quarterly Results of Wipro , Indian Bank. Power 3232 3304 -2.2% Disclaimer: This document is compiled by Epitome Global Services Private Limited exclusively for Fullerton Securities & Wealth Advisors Ltd (FSWA) customers. This document is not for public distribution and has been furnished to you solely for your information and you are notified that you should not further copy, modify, use or distribute the information in any way unless you obtain written consent from FSWA. While reasonable care to compile the document but the accuracy and completeness cannot be guaranteed either by FSWA or any other person or entity associated with it. The document is prepared only for your information and is not sufficient for making an investment decision. You should rely on your own investigations and seek professional advice for investment decision. Neither FSWA nor any person connected with it, accepts any liability either arising from the use of this document or due to any inadvertent error in the information contained in this document. Financial investments carry risks including principal risk and therefore you should seek professional advice prior to making any investment decision. The risk of any losses occurring by use of this report or document will be entirely yours. The investments covered in this report are not guaranteed. Also past performance of an investment or fund is not an indication of future performance. FSWA, its affiliates, or associates, or any regulatory or other body
- 2. Volume: 1 | Issue: 80| October 16, 2010 COMMODITY 08-Oct 08-Oct Change % Change Light Sweet Crude Oil lost 1.6 percent this week closing at $81.5 from $82.8 per barrel Crude Oil (USD/bbl) 81.5 82.8 (1) (1.6) last week. Gold gained 2.1 percent closed at Rs 19,859 while Silver closed 6.1 percent Gold (Rs/10 gm) 19,859.0 19,451.0 408 2.1 higher at Rs 36,231 in the Indian market respectively. Silver (Rs/kg) 36,231.0 34,150.0 2081 6.1 SECTORAL ANALYSIS TOP PERFORMING SECTORS Sectoral Performance Analysis BSE Metal Price % Average Gainers This Wk Prev. Wk Return Volume BSE Metal Sesa Goa 373 356 4.6 242,908 The BSE Metal index gained 0.6 percent for the week. The top gainer for the week was Hind.Zinc 1214 1200 1.1 18,662 Sesagoa gaining 4.6 percent followed by Hindustan Zinc .The losers in this sector were Sterlite Inds. 179 179 (0.4) 542,250 Sterlite Industries, Tata Steel and NMDC loosing in the range of 0.4-0.9 percent . Tata Steel 636 640 (0.6) 417,118 NMDC 286 289 (0.9) 166,833 BSE Auto BSE Auto Price % Average The BSE Auto Index gained 0.5 percent this week. The top gainers were MRF gaining Gainers This Wk Prev. Wk Return Volume 6.9 percent followed by Amtek Auto gaining 3.5 percent. Tata Motors gained 0.6 MRF 9283 8759 6.0 1,066 percent, M&M gained 0.6 percent and Apollo Tyres gained 0.2 percent. Amtek Auto 163 158 3.5 206,322 Tata Motors 1157 1150 0.6 124,780 M&M 711 707 0.6 71,807 Apollo Tyres 82 81 0.2 214,228 BSE IT BSE IT Price % Average The BSE IT Index gained 0.4 percent this week . The top gainer in this index was Patni Gainers This Wk Prev. Wk Return Volume Computers gaining 3.7 percent followed by Wipro gaining 2.3 percent. Oracle Patni Computer 463 447 3.7 24,136 Financial Services gained 2.2 percent and TCS gained 1.1 percent .The other gainers Wipro 474 463 2.3 46,356 in this sector were Infosys and HCL Tech gaining 0.2 and 0.1 percent respectively. Oracle Fin.Serv. 2358 2308 2.2 3,660 TCS 951 941 1.1 43,363 Infosys Tech. 3076 3071 0.2 15,987 HCL Technologies 431 431 0.1 25,684 BSE Healthcare BSE Healthcare Price % Average The BSE Healthcare Index lost 0.1 percent this week. The Top gainer in this index was Orchid Chemicals gaining 9.0 percent followed by Apollo Hospitals gaining 4.7 Gainers This Wk Prev. Wk Return Volume percent. Other gainers were Lupin which gained 3.0 percent, Opto Circuits which Orchid Chemicals 309 284 9.0 557,484 gained 1.4 percent and Glaxosmith Pharma which gained 1.0 percent. Apollo Hospitals 534 511 4.7 17,642 Lupin 426 413 3.0 68,523 Opto Circuits 314 310 1.4 40,168 Glaxosmit Pharma 2301 2278 1.0 4,494 BSE Realty BSE Realty Price % Average The BSE Realty Index lost 0.3 percent this week . Top gainer in this index was India Gainers This Wk Prev. Wk Return Volume Bulls Real Estate gaining 4.0 percent followed by DB Realty gaining 1.2 percent. Orbit Indbull.RealEst. 196 188 4.0 261,911 Corp gained 0.2 percent. The laggards in this sector were Sobha Developers D B Realty 437 431 1.2 372,075 , Parsvanath and HDIL loosing in the range of 0.1-0.4 percent. Orbit Corpn. 129 129 0.2 120,950 Sobha Developer. 372 372 (0.1) 114,117 Parsvnath Devl. 141 141 (0.3) 195,525 HDIL 271 272 (0.4) 273,345 This document is compiled by Epitome Global Services Private Limited exclusively for Fullerton Securities & Wealth Advisors Ltd (FSWA) customers. This document is not for public distribution and has been furnished to you solely for your information and you are notified that you should not further copy, modify, use or distribute the information in any way unless you obtain written consent from FSWA. While reasonable care to compile the document but the accuracy and completeness cannot be guaranteed either by FSWA or any other person or entity associated with it. The document is prepared only for your information and is not sufficient for making an investment decision. You should rely on your own investigations and seek professional advice for investment decision. Neither FSWA nor any person connected with it, accepts any liability either arising from the use of this document or due to any inadvertent error in the information contained in this document. Financial investments carry risks including principal risk and therefore you should seek professional advice prior to making any investment decision. The risk of any losses occurring by use of this report or document will be entirely yours. The investments covered in this report are not guaranteed. Also past performance of an investment or fund is not an indication of future performance. FSWA, its affiliates, or associates, or any regulatory or other body or entity assumes no liability or responsibility for investment results or losses arising out of investment decisions made by you. This document is not to be considered as an offer to sell or a solicitation to buy any security or financial product. FSWA reserves the right to modify or alter the terms and conditions of the use of this service or discontinue, temporarily or permanently, the information and services provided (or any part thereof) at any time, with or without prior notice and FSWA shall not be liable to you for any suspension, modification, or termination of the information and services provided herein.
- 3. Volume: 1 || Issue: 80| |April 8, 2009 2010 Volume: 1 Issue: 3 October 16, FII / MF ACTIVITY (Rs. Cr) 8-Oct 11-Oct 12-Oct 13-Oct 14-Oct FII Cash Net 807.5 1111.2 700.1 3100.4 - MF FII Sensex FII Index Futures -321 212 -351 -203 -65.21 FII Index Options 409 -596 715.19 -79 1037 2000 20800 FII Stock Futures -1036 -597 -897 -1004 -606 FII Stock Options 188 -69.3 -67.7 -31 39.0 20700 FII Net 47 61 100 1783 404 1500 20600 Open Interest 163797 166413 167939 175152 175909 Mutual Fund -542.8 -260.1 -336.8 -352.1 - 1000 20500 20400 TURNOVER (Rs. Cr) 500 BSE NSE CASH NSE F&O 20300 60000 0 20200 40000 8-Oct 11-Oct 12-Oct 13-Oct 14-Oct 139282 137903 20100 14496 74818 14892 99498 19538 18533 16029 4786 5329 6586 6746 5292 -500 20000 20000 0 -1000 19900 11-Oct 12-Oct 13-Oct 14-Oct 15-Oct MOVERS & SHAKERS TOP 5 FRONTLINE GAINERS TOP 5 MIDCAP GAINERS TOP 5 SMALLCAP GAINERS Name Rs % Name Rs % Name Rs % Wipro 473.5 2.3% RCF 110.55 18.7% Karuturi Global 35.4 30.6% Hind. Unilever 298.1 1.2% Chambal Fert. 92.95 13.8% Binani Inds 235.85 27.4% TCS 951.0 1.1% Vijaya Bank 106 11.8% India Glycols 180.8 26.4% HDFC 726.9 0.9% Money Mat.Fin. 699.1 11.2% Spanco Ltd 161.4 25.5% Tata Motors 1156.6 0.6% Lak. Mach. Works 2804.3 9.0% Gulf Oil Corpn. 131.2 23.5% TOP 5 FRONTLINE LOSERS TOP 5 MIDCAP LOSERS TOP 5 SMALLCAP LOSERS Name Rs % Name Rs % Name Rs % Rel. Comm. 175.7 -4.6% CMC 1973.3 -16.9% Subhkam Capital 570.25 -18.5% NTPC 203.5 -4.5% Info Edg.(India) 661.35 -10.2% Oscar Investment 462.75 -11.4% Hero Honda Motor 1802.4 -3.7% Pipavav Shipyard 76.7 -8.3% LGS Global 66.35 -10.7% St Bk of India 3164.7 -2.9% Jain Irrigation 1079.05 -7.9% Ramsarup Inds. 44.75 -9.9% Reliance Infra. 1065.6 -2.8% Hathway Cable 185.8 -7.1% Tata Metaliks 142.3 -9.7% INSIDER UPDATES No. of Shares Transacted Holding after Company Name Acquirer Designation Transaction Date BUY/SELL Quantity Transaction % Ambuja Cements J C Toshniwal Company Official 09/09/2010 SELL 10000 0 Ambuja Cements Rameshchandra Darak Company Official 13/09/2010 SELL 8000 0.01 Asian Hotels (West) Sushil Gupta CMD 13/09/2010 SELL 86100 5.82 Chambal Fertilisers H S Bawa MD 13/09/2010 BUY 15490 0.04 Compucom Software Sambhav Infotech Pvt Ltd Strategic Investor 15/09/2010 SELL 100000 26.1 HDFC Bank Arup Kumar Rakshit Strategic Investor 14/09/2010 SELL 500 0.00 Hindustan Media Reliance Dual Advantage Fund Strategic Investor 13/09/2010 BUY 9000 5.00 India Steel Works Sandeep Mulik Strategic Investor 14/09/2010 BUY 3000 0.02 ITC Ltd K N Grant Chairman 13/09/2010 SELL 40000 0.00 Jindal Steel & Power Rakesh Jindal Vice President 13/09/2010 SELL 1100 - Jubilant Organosys Dr. Naresh Trehan Director 15/09/2010 BUY 25000 0.02 M & M Financial Services Standard Chartered Pvt Equity Strategic Investor 14/09/2010 SELL 2358831 7.37 Navneet Publications Mohinder Pal Bansal Director 13/09/2010 BUY 4000 - OnMobile Global Kiran M A Strategic Investor 09/09/2010 SELL 22200 - Oracle Financial Services Vijay Sharma Vice President 14/09/2010 SELL 500 - Page Industries Nari Genomal Promoter Group 13/09/2010 SELL 7639 20.50 Sanguine Media Ramesh Genomal Strategic Investor 13/09/2010 SELL 6900 20.51 Smartlink Network Systems Sunder Genomal Strategic Investor 13/09/2010 SELL 6949 20.50 Transformers and Rectifiers C V Ravi Promoter Group 13/09/2010 SELL 200000 13.48 Smartlink Network K R Naik Promoter Group 16/09/2010 BUY 15916 48.18 Disclaimer: This document is compiled by Epitome Global Services Private Limited exclusively for Fullerton Securities & Wealth Advisors Ltd (FSWA) customers. This document is not for public distribution and has been furnished to you solely for your information and you are notified that you should not further copy, modify, use or distribute the information in any way unless you obtain written consent from FSWA. While reasonable care to compile the document but the accuracy and completeness cannot be guaranteed either by FSWA or any other person or entity associated with it. The document is prepared only for your information and is not sufficient for making an investment decision. You should rely on your own investigations and seek professional advice for investment decision. Neither FSWA nor any person connected with it, accepts any liability either arising from the use of this document or due to any inadvertent error in the information contained in this document. Financial investments carry risks including principal risk and therefore you should seek professional advice prior to making any investment decision. The risk of any losses occurring by use of this report or document will be entirely yours. The investments covered in this report are not guaranteed. Also past performance of an investment or fund is not an indication of future performance. FSWA, its affiliates, or associates, or any regulatory or other body or entity assumes no liability or responsibility for investment results or losses arising out of investment decisions made by you. This document is not to be considered as an offer to sell or a solicitation to buy any security or financial product. FSWA reserves the right to modify or alter the terms and conditions of the use of this service or discontinue, temporarily or permanently, the information and services provided (or any part thereof) at any time, with or without prior notice and FSWA shall not be liable to you for any suspension, modification, or termination of the information and services provided herein.