Fullerton Securities' weekly newsletter - 18th September 2010
1. Volume: 1 | Issue: 76 | September 18, 2010
Turnover Rs Cr('000) Sensex Turnover Rs Cr('000) Nifty
19800 5.5 O pen 18,669 5900 18 Open 5,639
High 19,635 High 5,902
19600 5850
Low 18,669 17 Low 5,639
19400 5.0 5800
C lose 19,595 Close 5,885
C hange 795 5750 16
19200 Change 245
V ol (Lacs) 24,555 5700
19000 4.5 Vol (Lacs) 41,547
T urn (R s C r) 29,840 5650 15 Turn (Rs Cr) 83,460
13-Sep 14-Sep 15-Sep 16-Sep 17-Sep
13-Sep 14-Sep 15-Sep 16-Sep 17-Sep
MARKET UPDATE INDIAN MARKET 17-Sep 9-Sep % Change
BSE Sensex 19,595 18,800 4.23
INDIA
S&P CNX Nifty 5,885 5,640 4.34
BSE Midcap 8,104 8,051 0.66
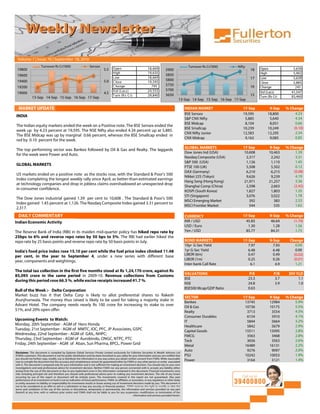
The Indian equity markets ended the week on a Positive note. The BSE Sensex ended the
BSE Smallcap 10,239 10,249 (0.10)
week up by 4.23 percent at 19,595. The NSE Nifty also ended 4.34 percent up at 5,885.
CNX Nifty Junior 12,583 12,295 2.34
The BSE Midcap was up by marginal 0.66 percent, whereas the BSE Smallcap ended in
CNX Midcap 9,162 9,085 0.85
red by 0.10 percent for the week.
GLOBAL MARKETS 17-Sep 9-Sep % Change
The top performing sector was Bankex followed by Oil & Gas and Realty. The laggards
Dow Jones Ind (USA) 10,608 10,463 1.39
for the week were Power and Auto.
Nasdaq Composite (USA) 2,317 2,242 3.31
S&P 500 (USA) 1,126 1,110 1.45
GLOBAL MARKETS 0.12
FTSE 100 (UK) 5,508 5,502
DAX (Germany) 6,210 6,215 (0.08)
US markets ended on a positive note as the stocks rose, with the Standard & Poor’s 500 4.19
Nikkei 225 (Tokyo) 9,626 9,239
Index completing the longest weekly rally since April, as better-than-estimated earnings
Hang Seng (Hong Kong) 21,971 21,257 3.36
at technology companies and drop in jobless claims overshadowed an unexpected drop
Shanghai Comp (China) 2,598 2,663 (2.45)
in consumer confidence.
KOSPI (South Korea) 1,827 1,803 1.35
STI (Singapore) 3,076 3,022 1.78
The Dow Jones industrial gained 1.39 per cent to 10,608 . The Standard & Poor's 500
MSCI Emerging Market 392 383 2.33
Index gained 1.45 percent at 1,126. The Nasdaq Composite Index gained 3.31 percent to
MSCI Frontier Market 544 535 1.62
2,317.
DAILY COMMENTARY CURRENCY 17-Sep 9-Sep % Change
Indian Economic Activity INR / USD 45.83 46.64 (1.74)
USD / Euro 1.30 1.28 1.56
The Reserve Bank of India (RBI) in its maiden mid-quarter policy has hiked repo rate by Yen / USD 85.77 84.31 1.73
25bps to 6% and reverse repo rates by 50 bps to 5%. The RBI had earlier hiked the
repo rate by 25 basis points and reverse repo rate by 50 basis points in July. BOND MARKETS 17-Sep 9-Sep Change
10yr G-Sec Yield 7.97 7.93 0.04
India's food price index rose 15.10 per cent while the fuel price index climbed 11.48 1yr G-Sec Yield 6.48 6.48 0.00
LIBOR (6m) 0.47 0.49 (0.02)
per cent, in the year to September 4, under a new series with different base
LIBOR (1m) 0.25 0.26 (0.01)
year, components and weightings.
Inter-bank Call Rate 6.1 4.9 1.21
The total tax collection in the first five months stood at Rs 1,24,170 crore, against Rs
VALUATIONS P/E P/B DIV YLD
85,095 crore in the same period in 2009-10. Revenue collections from Customs
BSE 23.3 3.7 1.1
during this period rose 66.5 %, while excise receipts increased 41.7 %.
NSE 24.8 3.9 1.0
BSE500 Mcap/GDP Ratio 0.63
Bull of the Week :- Delta Corporation
Market buzz has it that Delta Corp is likely to allot preferential shares to Rakesh SECTOR 17-Sep 9-Sep % Change
Jhunjhunwala. The money thus raised is likely to be used for taking a majority stake in Bankex 13745 12984 5.9%
Advani Hotel. The company needs nearly Rs 100 crore for increasing its stake to over Oil & Gas 10736 10175 5.5%
51%, and 20% open offer. Realty 3713 3554 4.5%
Consumer Durables 6154 5910 4.1%
Upcoming Events to Watch: IT 5844 5664 3.2%
Monday, 20th September - AGM of Hero Honda Healthcare 5842 5679 2.9%
Tuesday, 21st September - AGM of MMTC, IOC, PFC, JP Associates, GSPC Capital Goods 15511 15095 2.8%
Wednesday, 22nd September - AGM of GAIL, NHPC; FMCG 3563 3468 2.8%
Thursday, 23rd September - AGM of Aurobindo, ONGC, NTPC, PTC Teck 3656 3563 2.6%
Friday, 24th September - AGM of Aban, Sun Pharma, BPCL, Power Grid Metal 16489 16131 2.2%
Auto 9276 9097 2.0%
Disclaimer: This document is compiled by Epitome Global Services Private Limited exclusively for Fullerton Securities & Wealth Advisors Ltd
(FSWA) customers. This document is not for public distribution and has been furnished to you solely for your information and you are notified that PSU 10242 10053 1.9%
you should not further copy, modify, use or distribute the information in any way unless you obtain written consent from FSWA. While reasonable
care to compile the document but the accuracy and completeness cannot be guaranteed either by FSWA or any other person or entity associated
Power 3164 3121 1.4%
with it. The document is prepared only for your information and is not sufficient for making an investment decision. You should rely on your own
investigations and seek professional advice for investment decision. Neither FSWA nor any person connected with it, accepts any liability either
arising from the use of this document or due to any inadvertent error in the information contained in this document. Financial investments carry
risks including principal risk and therefore you should seek professional advice prior to making any investment decision. The risk of any losses
occurring by use of this report or document will be entirely yours. The investments covered in this report are not guaranteed. Also past
performance of an investment or fund is not an indication of future performance. FSWA, its affiliates, or associates, or any regulatory or other body
or entity assumes no liability or responsibility for investment results or losses arising out of investment decisions made by you. This document is
not to be considered as an offer to sell or a solicitation to buy any security or financial product. FSWA reserves the right to modify or alter the
terms and conditions of the use of this service or discontinue, temporarily or permanently, the information and services provided (or any part
thereof) at any time, with or without prior notice and FSWA shall not be liable to you for any suspension, modification, or termination of the
information and services provided herein.
2. Volume: 1 | Issue: 76| September 18, 2010
COMMODITY 17-Sep 9-Sep Change % Change
Light Sweet Crude Oil lost 3.7 percent this week closing at $73.5 from $76.4 per barrel
Crude Oil (USD/bbl) 73.5 76.4 (3) (3.7)
last week. Gold gained 1.6 percent closed at Rs 19,151 while Silver closed 3.4 percent
Gold (Rs/10 gm) 19,151.0 18,850.0 301 1.6
higher at Rs 32,281 in the Indian market respectively.
Silver (Rs/kg) 32,281.0 31,225.0 1056 3.4
SECTORAL ANALYSIS TOP PERFORMING SECTORS
Sectoral Performance Analysis BSE Bankex Price % Average
Gainers This Wk Prev. Wk Return Volume
IndusInd Bank 263 236 11.5 490,877
Axis Bank 1506 1425 5.7 117,452
BSE Bankex HDFC Bank 2400 2282 5.1 59,572
Kotak Mah. Bank 474 455 4.1 85,447
The BSE Bankex index gained 5.9 percent for the week. The top gainer for the week Punjab National Bank 1286 1248 3.1 39,651
was IndusInd Bank gaining 11.5 percent followed by Axis Bank and H D F C Bank
gaining 5.7 percent and 5.1 percent respectively. Kotak Mahindra Bank and Punjab
National Bank gained 4.1 percent and 3.1 percent respectively.
BSE Oil & Gas Price % Average
Gainers This Wk Prev. Wk Return Volume
Cairn India 342 327 4.5 295,424
Reliance Industries 1027 992 3.5 890,922
BSE Oil & Gas
Essar Oil 132 129 2.4 306,210
IOCL 428 418 2.2 199,324
The BSE Oil & Gas Index gained 5.5 percent this week. The top gainers were Cairn India
gaining 4.5 percent followed by Reliance Industries gaining 3.5 percent. Essar Oil GAIL (India) 481 471 2.2 105,191
gained 2.4 percent, IOC gained 2.2 percent and Gail India gained 2.2 percent.
BSE Realty Price % Average
BSE Realty Gainers This Wk Prev. Wk Return Volume
DLF 352 333 5.8 615,659
The BSE Realty Index gained 4.5 percent this week . The top gainer in this index was Unitech 88 85 3.5 2,212,028
DLF gaining 5.8 percent followed by Unitech gaining 3.5 percent. Suntech Realty Sunteck Realty 635 621 2.3 38,827
gained 2.3 percent . Other gainers were D B Realty which gained 2.1 percent while D B Realty 452 443 2.1 68,224
Peninsula Land & Sobha Developer gained 0.5 percent and 0.3 percent respectively. Peninsula Land 65 65 0.5 98,227
Sobha Developer. 378 377 0.3 39,912
BSE Consumer Durables BSE Consumer Durables Price % Average
Gainers This Wk Prev. Wk Return Volume
The BSE Consumer Durables Index gained 4.1 percent this week. The Top gainer in this Titan Inds. 3199 2977 7.5 21,542
index was Titan Industries gaining 7.5 percent followed by Rajesh Exports gaining 7.3 Rajesh Exports 104 97 7.3 245,667
percent. Other gainers were Gitanjali Gems which gained 3.4 percent, Blue Star which Gitanjali Gems 220 212 3.4 481,314
gained 0.9 percent and V I P Industries which gained 0.1 percent. Blue Star 465 460 0.9 16,709
V I P Industries 534 533 0.1 339,379
BSE IT BSE IT Price % Average
Gainers This Wk Prev. Wk Return Volume
The BSE IT Index gained 3.2 percent this week . Top gainer in this index was Oracle Oracle Fin.Services 2229 2118 5.2 9,826
Wipro 420 403 4.4 145,204
Fin.Serv. gaining 5.2 percent followed by Wipro gaining 4.4 percent. Financial
Financial Technology 1421 1370 3.7 41,302
Technologies gained 3.7 percent, TCS gained 3.7 percent while other gainers were HCL
TCS 912 880 3.7 258,808
Technologies gaining 2.2 percent and Infosys which gained 1.3 percent.
HCL Technologies 419 410 2.2 88,310
Infosys 2974 2936 1.3 79,589
This document is compiled by Epitome Global Services Private Limited exclusively for Fullerton Securities & Wealth Advisors Ltd (FSWA) customers. This document is not for public distribution and has been
furnished to you solely for your information and you are notified that you should not further copy, modify, use or distribute the information in any way unless you obtain written consent from FSWA. While
reasonable care to compile the document but the accuracy and completeness cannot be guaranteed either by FSWA or any other person or entity associated with it. The document is prepared only for your
information and is not sufficient for making an investment decision. You should rely on your own investigations and seek professional advice for investment decision. Neither FSWA nor any person connected with
it, accepts any liability either arising from the use of this document or due to any inadvertent error in the information contained in this document. Financial investments carry risks including principal risk and
therefore you should seek professional advice prior to making any investment decision. The risk of any losses occurring by use of this report or document will be entirely yours. The investments covered in this
report are not guaranteed. Also past performance of an investment or fund is not an indication of future performance. FSWA, its affiliates, or associates, or any regulatory or other body or entity assumes no liability
or responsibility for investment results or losses arising out of investment decisions made by you. This document is not to be considered as an offer to sell or a solicitation to buy any security or financial product.
FSWA reserves the right to modify or alter the terms and conditions of the use of this service or discontinue, temporarily or permanently, the information and services provided (or any part thereof) at any
time, with or without prior notice and FSWA shall not be liable to you for any suspension, modification, or termination of the information and services provided herein.
3. Volume: 1 || Issue: 76| |April 8, 2009 18, 2010
Volume: 1 Issue: 3 September
FII / MF ACTIVITY (Rs. Cr) 9-Sep 13-Sep 14-Sep 15-Sep 16-Sep
FII Cash Net 1177 2636 1723.3 2630.1 1143.6
MF FII Sensex FII Index Futures 212 26 1625 63 -647
FII Index Options 1368 823 -3351 -1627 -1034
5000 19700 FII Stock Futures 472 595 -673 -160 -853
FII Stock Options -15 -17.0 7.6 -49 -29.5
4000 19600 FII Net 3214 4063 -668 857 -1420
Open Interest 190183 197513 197261 203458 204770
3000 19500 Mutual Fund -286 -435 -663 -487 -
2000 19400 TURNOVER (Rs. Cr)
BSE NSE CASH NSE F&O
1000 19300 60000
0 19200 40000
149475
156375
147775
149987
15782
17129
17225
16362
16982
9-Sep 13-Sep 14-Sep 15-Sep 16-Sep
4974
5453
5290
5264
4988
20000
-1000 19100
0
-2000 19000
13-Sep 14-Sep 15-Sep 16-Sep 17-Sep
MOVERS & SHAKERS
TOP 5 FRONTLINE GAINERS TOP 5 MIDCAP GAINERS TOP 5 SMALLCAP GAINERS
Name Rs % Name Rs % Name Rs %
DLF 352.2 5.8% Geekay Finance 13.80 22.1% Delta Corp 69.7 30.0%
HDFC Bank 2399.6 5.1% Berger Paints 114.35 14.9% Shristi Infra 586.2 28.2%
Maruti Suzuki 1387.1 4.6% IndusInd Bank 262.60 11.5% Polyplex Corpn 739.9 21.5%
Wipro 420.3 4.4% Bhushan Steel 2114.80 11.4% Atlanta 435.8 19.3%
Sterlite Inds. 173.3 4.1% Edelweiss Cap. 57.95 11.0% Ajmera Realty 263.0 19.3%
TOP 5 FRONTLINE LOSERS TOP 5 MIDCAP LOSERS TOP 5 SMALLCAP LOSERS
Name Rs % Name Rs % Name Rs %
BHEL 2491.9 -1.9% MVL 79.85 -9.0% EIH Assoc.Hotels 191.3 -11.7%
St Bk of India 3147.3 -1.7% H T Media 152.40 -8.8% T.V. Today Netw. 79.3 -9.4%
Jindal Steel 716.5 -1.1% Britannia Inds. 429.45 -8.5% P I Industries 484.0 -9.1%
Tata Power Co. 1274.9 -0.8% State Bk of Mysore 956.00 -8.0% Zenotech Lab. 77.7 -9.0%
Hindalco Industries 190.3 -0.7% EID Parry 420.75 -7.4% Nahar Indl. Ent. 81.9 -8.5%
INSIDER UPDATES
No. of Shares Transacted Holding after
Company Name Acquirer Designation Transaction Date BUY/SELL
Quantity Transaction %
Core Projects & Technologies S S Dua Director 06/08/2010 SELL 1800 0
Ambika Cotton Mills Ascent India Fund Strategic Investor 05/08/2010 SELL 572873 1.63
Envair Electrodyne Shripad Mirashi CMD 06/05/2010 BUY 699 52.76
Garware Marine Industries Ashok B Garware Chairman 06/08/2010 BUY 25172 12.3
Gravity India Dakshaben R Thakkar Director 06/08/2010 BUY 3000 2.27
Steel Strips Wheels Dheeraj Garg Promoter 13/08/2010 BUY 4547 32.19
Visesh Infotecnics Peeyush Aggarwal Director 06/08/2010 SELL 600000 25.38
Shree Ashtavinayak Cine Vision Dahlia Traders Pvt Ltd Promoter 04/08/2010 BUY 1500530 19.98
Sonata Software Bhupati Investments & Finance Promoter 04/08/2010 SELL 88635 20.90
Hathway Bhawani Cabletel Kuldeep Puri MD 11/08/2010 BUY 53498 3.89
Panacea Biotec Poonawalla Shares & Securities Strategic Investor 13/07/2010 BUY 312476 0.49
Kotak Mahindra Bank Jaimin Mukund Bhatt CFO 09/08/2010 SELL 2500 0.07
Setco Automotive Harish Sheth CMD 03/08/2010 SELL 130000 4.49
Jaiprakash Associates Vijay Mitra Sr. VP - Finance 11/08/2010 BUY 6275 0.00
PEARL Polymers Rupali Seth Promoter 10/08/2010 BUY 100 0.00
Rubfila International Minal B Patel Promoter 10/08/2010 BUY 210000 1.02
Sahyadri Industries V L Patel MD 10/08/2010 SELL 80000 5.73
Sanghi Industries Spinnaker GEM Fund Strategic Investor 10/08/2010 SELL 2128252 0.82
Rubfila International Minal B Patel Promoter 10/08/2010 BUY 210000 1.02
PEARL Polymers Rupali Seth Promoter 10/08/2010 BUY 100 0.00
Disclaimer: This document is compiled by Epitome Global Services Private Limited exclusively for Fullerton Securities & Wealth Advisors Ltd (FSWA) customers. This document is not for public distribution and has been
furnished to you solely for your information and you are notified that you should not further copy, modify, use or distribute the information in any way unless you obtain written consent from FSWA. While reasonable care to
compile the document but the accuracy and completeness cannot be guaranteed either by FSWA or any other person or entity associated with it. The document is prepared only for your information and is not sufficient for
making an investment decision. You should rely on your own investigations and seek professional advice for investment decision. Neither FSWA nor any person connected with it, accepts any liability either arising from the
use of this document or due to any inadvertent error in the information contained in this document. Financial investments carry risks including principal risk and therefore you should seek professional advice prior to making
any investment decision. The risk of any losses occurring by use of this report or document will be entirely yours. The investments covered in this report are not guaranteed. Also past performance of an investment or fund is
not an indication of future performance. FSWA, its affiliates, or associates, or any regulatory or other body or entity assumes no liability or responsibility for investment results or losses arising out of investment decisions
made by you. This document is not to be considered as an offer to sell or a solicitation to buy any security or financial product. FSWA reserves the right to modify or alter the terms and conditions of the use of this service or
discontinue, temporarily or permanently, the information and services provided (or any part thereof) at any time, with or without prior notice and FSWA shall not be liable to you for any suspension, modification, or
termination of the information and services provided herein.