Principles of DataAnalysis
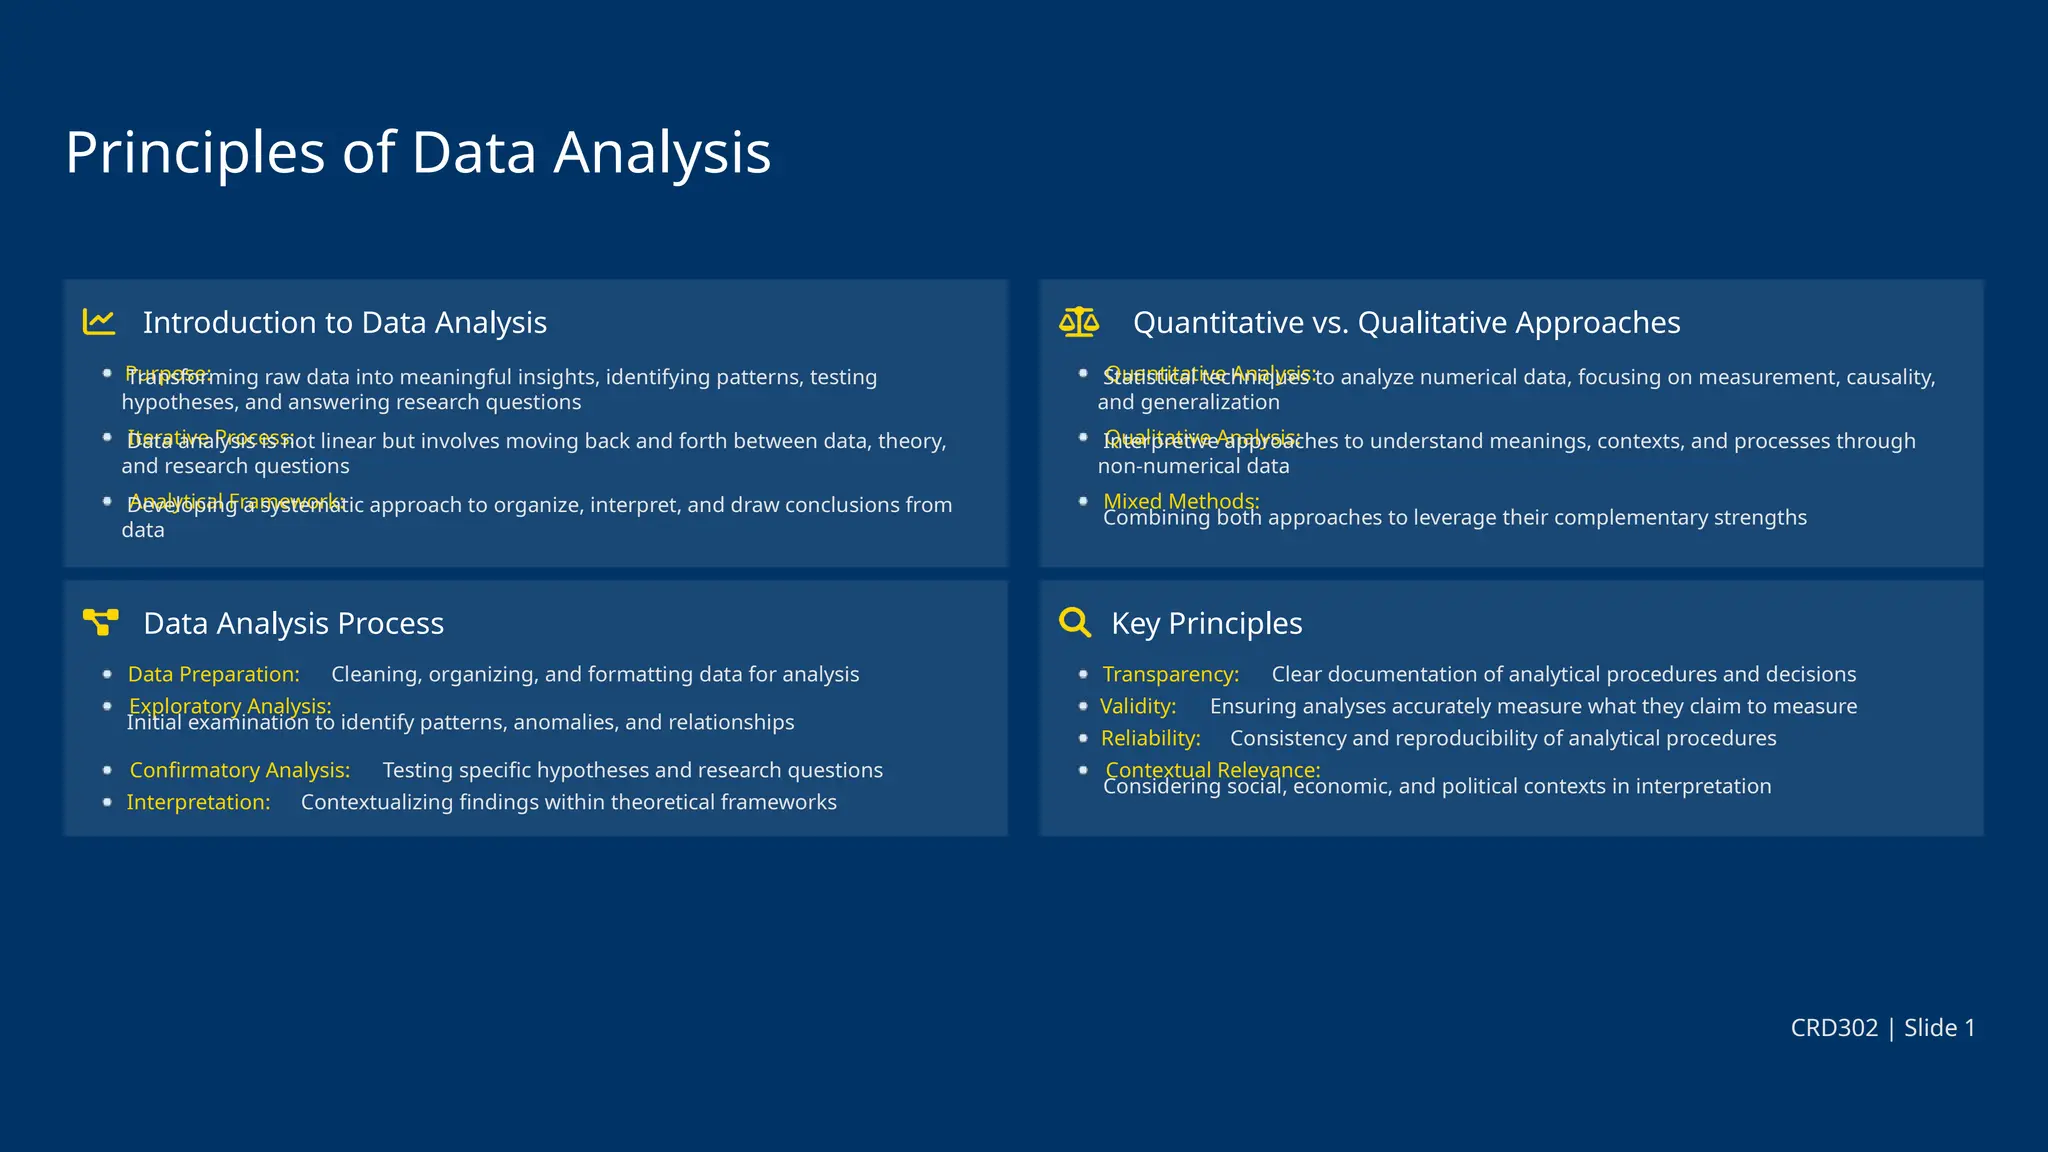
Introduction to Data Analysis
Purpose:
Transforming raw data into meaningful insights, identifying patterns, testing
hypotheses, and answering research questions
Iterative Process:
Data analysis is not linear but involves moving back and forth between data, theory,
and research questions
Analytical Framework:
Developing a systematic approach to organize, interpret, and draw conclusions from
data
Data Analysis Process
Data Preparation: Cleaning, organizing, and formatting data for analysis
Exploratory Analysis:
Initial examination to identify patterns, anomalies, and relationships
Confirmatory Analysis: Testing specific hypotheses and research questions
Interpretation: Contextualizing findings within theoretical frameworks
Quantitative vs. Qualitative Approaches
Quantitative Analysis:
Statistical techniques to analyze numerical data, focusing on measurement, causality,
and generalization
Qualitative Analysis:
Interpretive approaches to understand meanings, contexts, and processes through
non-numerical data
Mixed Methods:
Combining both approaches to leverage their complementary strengths
Key Principles
Transparency: Clear documentation of analytical procedures and decisions
Validity: Ensuring analyses accurately measure what they claim to measure
Reliability: Consistency and reproducibility of analytical procedures
Contextual Relevance:
Considering social, economic, and political contexts in interpretation
CRD302 | Slide 1
2.
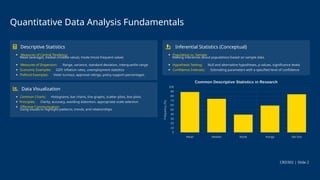
Quantitative Data AnalysisFundamentals
Descriptive Statistics
Measures of Central Tendency:
Mean (average), median (middle value), mode (most frequent value)
Measures of Dispersion: Range, variance, standard deviation, interquartile range
Economic Examples: GDP, inflation rates, unemployment statistics
Political Examples: Voter turnout, approval ratings, policy support percentages
Data Visualization
Common Charts: Histograms, bar charts, line graphs, scatter plots, box plots
Principles: Clarity, accuracy, avoiding distortion, appropriate scale selection
Effective Communication:
Using visuals to highlight patterns, trends, and relationships
Inferential Statistics (Conceptual)
Population vs. Sample:
Making inferences about populations based on sample data
Hypothesis Testing: Null and alternative hypotheses, p-values, significance levels
Confidence Intervals: Estimating parameters with a specified level of confidence
CRD302 | Slide 2
3.
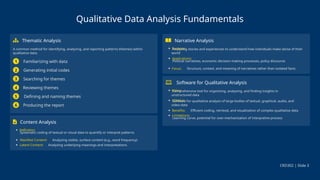
Qualitative Data AnalysisFundamentals
Thematic Analysis
A common method for identifying, analyzing, and reporting patterns (themes) within
qualitative data:
1 Familiarizing with data
2 Generating initial codes
3 Searching for themes
4 Reviewing themes
5 Defining and naming themes
6 Producing the report
Content Analysis
Definition:
Systematic coding of textual or visual data to quantify or interpret patterns
Manifest Content: Analyzing visible, surface content (e.g., word frequency)
Latent Content: Analyzing underlying meanings and interpretations
Narrative Analysis
Purpose:
Analyzing stories and experiences to understand how individuals make sense of their
world
Applications:
Political narratives, economic decision-making processes, policy discourse
Focus: Structure, context, and meaning of narratives rather than isolated facts
Software for Qualitative Analysis
NVivo:
Comprehensive tool for organizing, analyzing, and finding insights in
unstructured data
ATLAS.ti:
Software for qualitative analysis of large bodies of textual, graphical, audio, and
video data
Benefits: Efficient coding, retrieval, and visualization of complex qualitative data
Limitations:
Learning curve, potential for over-mechanization of interpretive process
CRD302 | Slide 3
4.
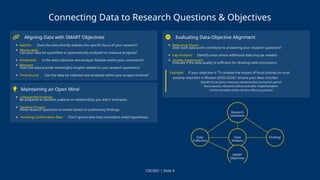
Connecting Data toResearch Questions & Objectives
Aligning Data with SMART Objectives
Specific: Does the data directly address the specific focus of your research?
Measurable:
Can your data be quantified or systematically analyzed to measure progress?
Achievable: Is the data collection and analysis feasible within your constraints?
Relevant:
Does the data provide meaningful insights related to your research questions?
Time-bound: Can the data be collected and analyzed within your project timeline?
Maintaining an Open Mind
Unexpected Findings:
Be prepared to discover patterns or relationships you didn't anticipate
Iterative Process:
Allow research questions to evolve based on preliminary findings
Avoiding Confirmation Bias: Don't ignore data that contradicts initial hypotheses
Evaluating Data-Objective Alignment
Relevance Check:
Does each data point contribute to answering your research questions?
Gap Analysis: Identify areas where additional data may be needed
Quality Assessment:
Evaluate if the data quality is sufficient for drawing valid conclusions
Example: If your objective is "To analyze the impact of fiscal policies on rural
poverty reduction in Bhutan (2020-2024)," ensure your data includes:
Specific fiscal policy measures implemented during this period
Rural poverty indicators before and after implementation
Control variables (other factors affecting poverty)
CRD302 | Slide 4
5.
Mid-term Progress ReviewPreparation
Assessment Criteria Review
8 marks: Explanation of data collection and preliminary findings
6 marks: Discussion of challenges and solutions
6 marks: Project progress assessment and revised project plan
Structuring the Presentation
Introduction: Brief recap of project objectives and methodology
Progress Report: What has been achieved since proposal submission
Data Collection: Methods used, challenges faced, adjustments made
Preliminary Findings: Initial insights and patterns observed
Revised Timeline: Adjustments to original plan and next steps
Visual Aids
Charts & Graphs: Visual representation of preliminary data
Tables: Organized presentation of key findings or comparisons
Bullet Points: Clear, concise summaries of main points
Design Principles: Consistency, readability, appropriate color use
Practice and Feedback
Rehearsal: Practice presentation multiple times to ensure smooth delivery
Time Management: Aim for 15-20 minutes total presentation time
Peer Review: Exchange feedback with other groups on content and delivery
Q&A Preparation: Anticipate potential questions and prepare responses
Remember: The mid-term presentation is not just an assessment but an
opportunity to receive valuable feedback that can improve your final project.
CRD302 | Slide 5
6.
Required Readings &Activities (Week 4)
Required Readings
Bryman, A. (2021). Social Research Methods. Oxford.
Chapters on quantitative and qualitative data analysis
Wooldridge, J. M. (2019). Introductory Econometrics: A Modern
Approach. Cengage Learning.
Selected introductory chapters on data and descriptive statistics
Additional resources on data visualization and introductory
statistics
Assessment Focus
Preparation for Mid-term Progress Review (20%) in Week 5
Activities
Lectures on descriptive statistics and thematic analysis
Hands-on exercises with small datasets (provided by instructor or
from students' own preliminary collection) to practice basic analysis
Group work on preparing for the Mid-term Progress Review
presentation
References:
Braun, V., & Clarke, V. (2006). Using thematic analysis in psychology.
Qualitative Research in Psychology
, 3(2), 77-101.
CRD302 | Slide 6