Week 5
•
0 likes•696 views

The document describes the process of fault modeling in Petrel, including: 1. Defining a new model to contain the geological faults 2. Creating faults from fault polygon lines by generating key pillars along the polygons 3. Editing the automatically generated key pillars by moving points and pillars to better fit the input fault data 4. Connecting faults where they intersect horizontally by defining common key pillars between the faults.

More Related Content
What's hot
What's hot (12)
Viewers also liked
Viewers also liked (8)
Similar to Week 5
Similar to Week 5 (20)
Week 5
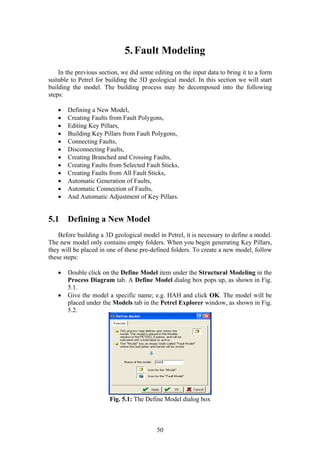
- 1. 5. Fault Modeling In the previous section, we did some editing on the input data to bring it to a form suitable to Petrel for building the 3D geological model. In this section we will start building the model. The building process may be decomposed into the following steps: • Defining a New Model, • Creating Faults from Fault Polygons, • Editing Key Pillars, • Building Key Pillars from Fault Polygons, • Connecting Faults, • Disconnecting Faults, • Creating Branched and Crossing Faults, • Creating Faults from Selected Fault Sticks, • Creating Faults from All Fault Sticks, • Automatic Generation of Faults, • Automatic Connection of Faults, • And Automatic Adjustment of Key Pillars. 5.1 Defining a New Model Before building a 3D geological model in Petrel, it is necessary to define a model. The new model only contains empty folders. When you begin generating Key Pillars, they will be placed in one of these pre-defined folders. To create a new model, follow these steps: • Double click on the Define Model item under the Structural Modeling in the Process Diagram tab. A Define Model dialog box pops up, as shown in Fig. 5.1. • Give the model a specific name; e.g. HAH and click OK. The model will be placed under the Models tab in the Petrel Explorer window, as shown in Fig. 5.2. Fig. 5.1: The Define Model dialog box 50
- 2. Fig. 5.2: The HAH new model 5.2 Creating Faults from Fault Polygons Fault polygons are line data representing the hanging-wall and footwall for each horizon. The polygons could be separated into lines for each fault or lines for each horizon. In the latter case, the lines should be separated with flags to make sure that the same line dose not defines two faults. If there are no flags between the line data, you should do some editing in the Make/Edit Polygons process in order to split the lines. To create faults from fault polygons, follow the steps: • Go to Structural Modeling item in the Process Diagram tab, • Activate the Fault Modeling process in the Process Diagram by clicking on it once and making it bold as shown by Fig. 5.3. Fig. 5.3: The Fault Modeling process • Display the fault polygon files in the Fault Polygons folder in a 3D window, as shown in Fig. 5.4. • Select the desired fault geometry from the Fault Model Option Tools toolbar. In this case, a linear geometry is suitable, as shown in Fig. 5.4. 51
- 3. Fig. 5.4: Fault Polygons displayed in a 3D window while the Fault Model Options and Fault Model Tools are displayed • In the Function bar, click on the Set Select/Pick Mode icon as shown below, • Open the setting for the fault model process by double clicking on the process in the Process Diagram. Use the default settings as shown in Fig. 5.5. However, the fault model should represent the input data properly. Note the option to extend the Key Pillars above the given min point and below the given max point of the input data. You can control how far Pillars are extended. 52
- 4. Fig. 5.5: Fault Modeling with HAH/Fault model Settings dialog box • Back to Fault Modeling icon, a Fault Modeling with 'HAH/Fault Model' dialog box will appear again, choose Settings, as shown in Fig. 5.6. Use the default settings. Fig. 5.6: Fault Modeling with 'HAH/Fault Model' dialog box 53
- 5. • In the 3D window, select all fault polygons that describe one fault by clicking on the fault polygons, • Click on the Create Faults from Fault Polygons icon in the Function bar to generate Key Pillars along the selected polygons, as shown in Figs. 5.7, 5.8. • The new fault has been added under the Fault folder in the Models tab of Petrel Explorer and is called “Fault 1”. You can change the name to a more appropriate name by clicking twice on the “Fault 1” and changing the name under the info tab of the Settings window that pops up. Fig 5.7: Fault Polygons displayed in a 3D window while Fault Model Action (Pillars) Tools toolbar are displayed 54
- 6. Fig. 5.8: Fault Polygons displayed in a 3D window after create faults from polygon Fig. 5.9: Fault Polygons displayed in a 3D window along with their surfaces 55
- 7. 5.3 Editing Key Pillars After you have created a fault you may want to do some fine-tuning on a specific Key Pillar or on the whole fault. Petrel has the option to edit single Shape Points or pillars as well as a selection of Shape Points or pillars. To select more than one, press the Shift key as you make your selection. The Fault Modeling and hence editing of Key Pillars is a very important step in making an accurate and reliable Petrel model. The Key Pillars should describe the fault planes as defined by the input data. It is possible to edit on a complete fault, a single Key Pillar or a shape point X, Y and Z directions, which makes the editing on faults very flexible. Automatically constructed Key Pillars are often malformed and often it is necessary to add new Pillars between key pillars and to the end of a fault then modify their shape. You have to insert Key Pillars between existing pillars when a fault’s shape contains more detail than the existing Pillar spacing can represent. Use the tool for add Pillars to end of fault and add pillar between. Editing of shape points and/or entire Key Pillars will be required to more closely fit the input data. This editing may require adding more shape points to the pillar to achieve the desired form. All Key Pillars in a fault don’t necessarily need the same number of shape points. See Fig. 5.10. To edit key pillars, follow the steps: • Open a new 3D Window, • Display a few of the faults (Key Pillars) to be edited, • Toggle on the checkbox next to all of the faults in the Fault Model folder, • Display available input data to use as a guide and be sure that the fault polygons or other data used to create the Pillars are visible in the 3D window, • Click on the Toggle fill icon to make it easier when editing the plane between Key Pillars is filled with color, as shown in Fig. 5.11, Fig. 5.10: Illustrative drawing to show horizons, fault planes, and key pillars 56
- 8. Fig. 5.11: Fault Polygons displayed in a 3D window while Fault Model Action (Pillars) Tools toolbar is displayed • the tools used for moving points and lines in Petrel is the widget, • Knowing that select a Key Pillar by clicking on one of the shape points, the widget will appear. It consists of a plane and a cylinder, • Click on the plane to turn it yellow and edit in a plane normal to the cylinder, • Click on the cylinder (so it turns yellow) to edit along the tangent of the cylinder. Be sure that you are in the Set Select/Pick Mode [P] as shown below, • Press the left mouse button on the widget and move the Key Pillar or the shape point, • Make sure the Move Along Line Tangent Only tool is active. This tool limits the movement to the tangent of the Key Pillar and it is a very intuitive way of editing the Key Pillars, as shown below • See Fig. 5.12 57
- 9. • To select only one shape point, make sure the Select Shape Points icon is active, as shown below, • To select an entire Key Pillar make the Select Pillars icon active as shown below. If you click on the line between Key Pillars, all shape points at that level will be selected, as shown below • If you click on the line between Key Pillars while having the “Select Pillars” icon active, all Key Pillars will be selected. To select only a few Key Pillars/shape points, click on those that you want to select while pressing the shift key, • Check that the fault model has the correct orientation by displaying the top and base horizons. If not, edit them as described above. Comment When finished editing, the Key Pillars should have a smooth transition in Z from Key Pillar to Key Pillar in a fault. The Key Pillars in the faults should extend above the top of the top surface and below the base of the lowest surface. 58
- 10. Fig. 5.12: Editing Key Pillars 59
- 11. 5.4 Building Key Pillars from Fault Polygons The same steps of "Editing Key Pillars" are applied in this section. Anyhow do not forget to de-select the active fault when creating a new one. Otherwise, the new fault will be attached to the previous active one, see Fig. 5.12 5.5 Connecting Faults If a fault is truncated by another fault in the horizontal direction, it must be connected to that other fault. This means that a common Key Pillar between the two faults must be defined. You can either use a Key Pillar that already exists and edit it into a position so that it fits both fault planes, or you can add a new Key Pillar between two existing Pillars and use that as the common/connected Key Pillar. All faults intersecting each other in Petrel model must be properly connected! This is important because the gridding process in Petrel will use the faults for guiding the gridding lines. The faults which are unconnected are treated differently from the faults which are connected. Furthermore, faults which are close together but unconnected are likely to lead to problems in Pillar Gridding and Make Horizons. Petrel has an automatic fault connection option which will connect all the simple branching and crossing faults in a single operation. Use this option carefully and always QC the grid afterwards. As connecting faults require some editing of the fault position, you will normally have to edit the connection manually afterwards. Truncated faults will not be handled by automatic connection. To connect two faults, follow the steps: • Choose the two faults to be connected, • Zoom in on the area where the two faults are to be connected, • Select the two Key Pillars you want to connect using the Select/pick Mode icon and the shift Key, as shown in Fig. 5.13, 60
- 12. Fig. 5.13: Two faults before connection • Click on the Connect Two Faults icon as shown below, • Define how you want to connect them when the Connect pillars dialog box pops up as shown in Figs. 5.14 to 5.17. Fig. 5.14: The Connect pillars dialog box 61
- 13. Fig. 5.15: Two faults connected to each other Fig. 5.16: Another two faults before connection 62
- 14. Fig. 5.17: The two faults of Fig. 5.16 after connection 5.6 Disconnecting Faults The undo button does not work for connected Key Pillars. You will have to disconnect them instead. To disconnect faults, follow the steps: • Select the two Key Pillars that should be disconnected. See Fig. 5.18 • Click on the Disconnect Fault icon. See Fig. 5.19 63
- 15. Fig. 5.18: Two faults before disconnection Fig. 5.19: Two faults after disconnection 64
- 16. 5.7 Creating Branched and Crossing Faults To create branched and crossing faults, follow the steps: • Select the Key Pillar where you want the crossing or branching fault to be initiated from, as shown in Fig. 5.20 • Click on either the New Branched Fault icon or the New Crossing Fault icon to generate a new fault, as shown in Figs. 5.21, 5.22 Fig. 5.20: A fault displayed in a 3D window before creating Branched or Crossing faults 65
- 17. Fig. 5.21: A fault displayed in a 3D window after creating Branched fault Fig. 5.22: A fault displayed in a 3D window after creating Crossing fault 66
- 18. 5.8 Creating Faults from Selected Fault Sticks Fault sticks can be used like fault polygons to create Key Pillars. Fault sticks are sets of line data that represent the fault plane. The file with fault sticks can represent one fault are a set of faults and are generated in Petrel or another work station. These sticks represent the fault surface and are converted to Key Pillars. This method is preferable if you have fault interpretations that may contain a bit of noise and you would like to have the option to disregard some of it. To create faults from selected fault sticks, follow the steps: • Turn off all of the faults, fault polygons and any other data you may have displayed in your 3D window. • From the Input Tab display the fault sticks in the “For Create from selected FS” folder. See Fig. 5.23. Fig. 5.23: Fault Sticks displayed in a 3D window 67
- 19. • Select Vertical, Linear, Listric or Curved Pillars depending on the type of fault you are modeling. Either linear or listric fault geometries will be fine but examine the fault sticks before you choose. See Fig. 5.24 Fig. 5.24: Linear fault sticks displayed in a 3D window while the Fault Model Options Tools are shown • Click on the Set Select/Pick Mode [P] icon in the Function bar. See Fig. 5.25 Fig. 5.25: Linear fault sticks displayed in a 3D window while the Fault Model Tools are shown 68
- 20. • Select some of the fault sticks on a fault by clicking on the fault stick and holding the Shift Key. See Fig. 5.26 Fig. 5.26: Selecting fault sticks • Click on the Add to or Create Fault from Selected Fault Sticks icon in the Function bar to generate Key Pillars along the selected fault sticks. See Fig. 5.27. Notice that by choosing this method, a fault will only be generated that connects the sticks that you selected. This could cause you to potentially lose some important detail. 69
- 21. Fig. 5.27: The Key Pillars for fault sticks created as a model • Once you have created the Key Pillars for a new fault, do the necessary editing and follow the procedure as described in the exercises above. • Connect the faults where necessary. See Figs. 5.28 to 5.30. • Continue modeling all the faults in the folder. See Fig. 5.31. 70
- 22. Fig. 5.28: The two faults before connection Fig. 5.29: Connect pillars dialog box 71
- 23. Fig. 5.30: The two faults after connection Fig. 5.31: All faults created as a model 72
- 24. 5.9 Creating Faults from All Fault Sticks It possible to select the entire set of fault sticks representing one fault and make Petrel use every nth fault stick as input. This is a fast approach but it requires that the fault stick are representative of the fault, i.e. do not contain lots of “noise”. To create faults from all fault sticks, follow the steps: • From the Input Tab display the fault sticks in the “For Create from selected FS” folder. See Fig. 5.23. • Select Vertical, Linear, Listric or Curved Pillars depending on the type of fault you are modeling. Either linear or listric fault geometries will be fine but examine the fault sticks before you choose. See Fig. 5.24. • Click on the Set Select/Pick Mode [P] icon in the Function bar. See Fig. 5.25. • Select all of the fault sticks on a fault by clicking on the fault stick and holding the Shift Key. See Fig. 5.26. • Click on the Create Fault from Fault Sticks, Surface or Interpretation icon in the Function bar to generate Key Pillars along the selected fault. See Fig. 5.32. • Repeat the same process to the other faults. See Fig. 5.33 • Once you have created the Key Pillars for a new fault, do the necessary editing by following the steps as described in the exercises above. • Connect the faults where necessary and continue modeling the faults in the folder. 73
- 25. Fig. 5.32: Fault sticks displayed in a 3D window while the Fault Model Action (Pillars) toolbar is displayed Fig. 5.33: The Key Pillars for fault sticks created 74
- 26. 5.10 Automatic Generation of Faults So far the faults have been generated one by one. In this exercise you will learn how to automatically create Key Pillars from sets of fault sticks in a folder in the Petrel Explorer Input tab. To create automatic generation of faults, follow the steps: • Active the Fault Modeling from Process Diagram • Convert one set of fault sticks to Key Pillars: a. In Petrel Explorer find the fault sticks folder. Open the folder and right click on one of the fault sticks. Select Convert to Faults in Fault Model… from the pull-down menu. See Fig. 5.34. Fig. 5.34: The fault sticks before the conversion process displayed in a 3D window 75
- 27. b. A dialog box will be pops up as shown in Fig. 5.35. Fig. 5.35: Convert to Fault in the active Fault Modeling dialog box c. Note the new fault in the 3D window and under the Fault Model folder in the model (in the Models tab). See Fig. 5.36 Fig. 5.36: A new fault under the Fault Model folder after the conversion process displayed in a 3D window 76
- 28. • This operation can be performed for all fault sticks in a folder: a. To avoid double sets of faults, delete the fault created above by selecting the whole fault in the 3D window or selecting it (making it bold) in the models tab of Petrel Explorer and then pressing delete. b. Right click on the folder called “Fault Sticks”. Select Convert to Faults in Fault Model… from the appearing pull-down menu. See Fig. 5.37. Fig. 5.37: All faults sticks before conversion displayed in a 3D window 77
- 29. c. All new faults will be added under the Fault Model folder in the model (in the Models tab). See Fig. 5.38. • Continue doing the necessary editing of Key Pillars as described above. • Connect faults where necessary. Fig. 5.38: All faults sticks after conversion displayed in a 3D window 78
- 30. 5.11 Automatic Connection of Faults It is possible to connect the faults automatically in Petrel. To create automatic connection of faults, fallow the steps: • Display all the faults you have created in a 3D window. See Fig. 5.38 • Click on the Fault Modeling in the Process Diagram. • Go to the Operations tab. See Fig 5.39. • Click on the Auto connect button and use an Extent distance of 250m and do the automatic fault connection only for the visible faults. See Fig. 5.40. • Check the connections and do manual editing if necessary. Fig. 5.39: Two fault sticks displayed before auto connection while the Fault Modeling dialog box is displayed 79
- 31. Fig. 5.40: Two fault sticks displayed after auto connection while the Fault Modeling dialog box is displayed 80
- 32. 5.12 Automatic Adjustment of Key Pillars It is possible to adjust all the Key Pillars automatically by cuffing them or extending them relative to a surface or a constant value. Since it is possible to edit all the Key Pillars manually, and since manual editing will always be necessary, the automatic “trimming” of Key Pillars functionality has been included as an optional exercise only. If the Key Pillars are trimmed by a surface then this surface should be smooth. In the case of the HAH project, the Base Cretaceous surface is a good candidate to be used for trimming since this is a non-faulted surface. In the exercise below only the top Shape Points will be trimmed. If the base Shape Points should be trimmed as well, then a copy could be made of Top Etive surface, then this copied surface could be smoothed to remove most of the structure (but keep the general dip) and shifted downwards so that it is deeper than the entire Top Etive surface. To create automatic adjustment of key pillars, follow the steps: • Display all the generated Key Pillars together with the Base Cretaceous surface. • Double click on the Fault Modeling process (in the Process diagram). • Go to the Operations tab from the dialog box that pops up. See Fig. 5.41. • Select the Base Cretaceous surface in the Petrel Explorer Input tab (click on the name to make it bold), toggle on the checkbox next to Top limit in the Operations tab under Cut/Extend pillars and click on the blue arrow. Fill in the other options as the figure shows. • Click on the Cut/Extend button. See Fig. 5.42. • Observe that all the Key Pillars will be cut by or extended to the Base Cretaceous level, generating smooth transitions between Key Pillars. See Fig. 5.43. Fig. 5.41: Fault Modeling dialog box 81
- 33. Fig. 5.42: The Base Cretaceous and Fault Model displayed in a 3D window before Key Pillar Operations Fig 5.43: The Base Cretaceous and Fault Model displayed in a 3D window after Key Pillar Operations 82