· WEEK 1: Databases and SecurityLesson
· Databases and Security
Databases are in just about everything we use today. When you are performing any task, think to yourself, Does this involve a database in some way?
As a daily process, communication occurs between people by many mediums, but there is no other medium more utilized than the large internetwork of computer systems we know as the Internet. When we look at some of the transactions that are performed on a daily basis, it is highly likely that there is a database involved. For example, if you open a web page to www.google.com and type a keyword in the textbox to search for, this process starts a series of searches through multiple databases. Another example is when searching for a book in the APUS library, this search is conducted using a database of books known as a catalog. so databases play an integral part in our daily lives; they store millions of pieces of data and more is collected each day (Basta, 2012).
In recent years, we find that technology has expanded to the reaches of utilities and production environments. Many of the utilities we come to rely on so heavily, such as gas, oil and electric, have been tied into the networks we use today. This interconnection allows for many new innovations in keeping everything in working order, but at the same time it also presents some very real threats to security. In reality, an intruder could take down an entire electrical grid which would remove power to millions of customers. An article in CIO Insight gives a great perspective on this and other issues in security where databases play such an important role (CIOInsight, 2011).
With the importance of securing the database infrastructure, we need to look at a multilayered approach to security. As can be seen in many security programs, multiple layers allow for strong security because it adds another roadblock that an intruder has to bypass to get to these systems. This same approach leads us to begin with the foundation of security; the CIA Triad. It all begins with the most basic approach, computer security and moves forward from that point on. Below is a detailed description of the components of the CIA Triad from (Basta, 2012):
· Confidentiality: For a system to provide confidentiality, it needs to do two things: ensure that information maintains its privacy by limiting authorized access to resources; block unauthorized access to resources.
· Integrity: This refers to the efforts taken through policy, procedure, and design in order to create and maintain reliable, consistent, and complete information and systems.
· Availability: This refers to the efforts taken through policy, procedures, and design to maintain the accessibility of resources on a network or within a database. These resources include, but are not limited to, data, applications, other databases, computers, servers, applications, files, drives, shares, and network access.
Database Structure, Models and Management
A databa.
· WEEK 1 Databases and SecurityLesson· Databases and Security.docx
1. · WEEK 1: Databases and SecurityLesson
· Databases and Security
Databases are in just about everything we use today. When you
are performing any task, think to yourself, Does this involve a
database in some way?
As a daily process, communication occurs between people by
many mediums, but there is no other medium more utilized than
the large internetwork of computer systems we know as the
Internet. When we look at some of the transactions that are
performed on a daily basis, it is highly likely that there is a
database involved. For example, if you open a web page to
www.google.com and type a keyword in the textbox to search
for, this process starts a series of searches through multiple
databases. Another example is when searching for a book in the
APUS library, this search is conducted using a database of
books known as a catalog. so databases play an integral part in
our daily lives; they store millions of pieces of data and more is
collected each day (Basta, 2012).
In recent years, we find that technology has expanded to the
reaches of utilities and production environments. Many of the
utilities we come to rely on so heavily, such as gas, oil and
electric, have been tied into the networks we use today. This
interconnection allows for many new innovations in keeping
everything in working order, but at the same time it also
presents some very real threats to security. In reality, an
intruder could take down an entire electrical grid which would
remove power to millions of customers. An article in CIO
Insight gives a great perspective on this and other issues in
security where databases play such an important role
(CIOInsight, 2011).
With the importance of securing the database infrastructure, we
need to look at a multilayered approach to security. As can be
seen in many security programs, multiple layers allow for
strong security because it adds another roadblock that an
2. intruder has to bypass to get to these systems. This same
approach leads us to begin with the foundation of security; the
CIA Triad. It all begins with the most basic approach, computer
security and moves forward from that point on. Below is a
detailed description of the components of the CIA Triad from
(Basta, 2012):
· Confidentiality: For a system to provide confidentiality, it
needs to do two things: ensure that information maintains its
privacy by limiting authorized access to resources; block
unauthorized access to resources.
· Integrity: This refers to the efforts taken through policy,
procedure, and design in order to create and maintain reliable,
consistent, and complete information and systems.
· Availability: This refers to the efforts taken through policy,
procedures, and design to maintain the accessibility of resources
on a network or within a database. These resources include, but
are not limited to, data, applications, other databases,
computers, servers, applications, files, drives, shares, and
network access.
Database Structure, Models and Management
A database alone is just a single collection of data that has some
organization based on the various groupings necessary for that
data. In most cases, the database follows some model of
organization, but by itself it is merely just a file filled with
information. So what is needed is a way to bring all of these
together, which allows us to introduce the database management
system (DBMS). Quite simply, a DBMS is an application that
is used to combine databases and allow the addition and
modification of data held within a database. A DBMS also
allows for added functionality to manipulate data in many ways.
For example, going back to the Google search example, we can
search for specific criteria, which then creates a search of
databases within that criteria; this is also known as a query.
A database is made up of several components that aid in the
organization of data. The highest level is the table then moves
on to records, columns, rows, fields, etc. You can see an
3. example in the text by reviewing figure 2.1.
Database records usually need a starting point, such as an
identifier to make the record unique from others. This can be
done in many ways, but what this is known as in a database is a
key. There are two major categories of a database key; the
primary key and the foreign key but there are other keys that
could be used. Below is the definition given by (Basta, 2012):
· Primary Key: It is a best practice, but not necessary, to use
keys that are meaningful to the data being stored. Examples of
primary keys are employee ID numbers, student IDs, ISBNs,
and Social Security numbers.
· Foreign Key: A foreign key is a field within a table that
contains a label that is used to build a relationship between two
tables. Use Figure 2-2 to aid the discussion.
· Other Keys: The use of the following keys depends on the
administrator, the DBMS, and the database model within an
environment: secondary or alternative key, candidate key, sort
or control key, and alternate key.
Keys help to map relationships in databases and make it easier
to create queries that group data that is being searched.
There are many database models to consider. A database model
is a representation of the way data is stored. Note that the model
for which a database is constructed also determines the way the
data can be retrieved and manipulated. Below are examples of
database models that are used.
· Hierarchical Model
· Network Model
· Relational Database
· Object-Oriented Databases
References/Works Sited:
Basta, A. and Zgola, M. (2012). Database Security, 1st Edition.
Florence, KY. Delmar Cengage Learning. ISBN-10/13:
1435453905/9781435453906
CIOInsight (2011). Stronger Database Security Needed, Cyber
Attacks Show. CIO Insight.
4. URL: /access/content/group/science-and-technology-
common/ISSC/ISSC431/Reading-Materials/Stronger-Database-
Security-Needed-Cyber-Attacks-Show.pdf
Full Terms & Conditions of access and use can be found at
https://www.tandfonline.com/action/journalInformation?journal
Code=rfec20
Feminist Economics
ISSN: 1354-5701 (Print) 1466-4372 (Online) Journal homepage:
https://www.tandfonline.com/loi/rfec20
Gender Disparity in Education and the
International Competition for Foreign Direct
Investment
Matthias Busse & Peter Nunnenkamp
To cite this article: Matthias Busse & Peter Nunnenkamp (2009)
Gender Disparity in Education
and the International Competition for Foreign Direct
Investment, Feminist Economics, 15:3, 61-90,
DOI: 10.1080/13545700802528315
To link to this article:
https://doi.org/10.1080/13545700802528315
Published online: 23 Jul 2009.
Submit your article to this journal
Article views: 481
5. View related articles
Citing articles: 9 View citing articles
https://www.tandfonline.com/action/journalInformation?journal
Code=rfec20
https://www.tandfonline.com/loi/rfec20
https://www.tandfonline.com/action/showCitFormats?doi=10.10
80/13545700802528315
https://doi.org/10.1080/13545700802528315
https://www.tandfonline.com/action/authorSubmission?journalC
ode=rfec20&show=instructions
https://www.tandfonline.com/action/authorSubmission?journalC
ode=rfec20&show=instructions
https://www.tandfonline.com/doi/mlt/10.1080/13545700802528
315
https://www.tandfonline.com/doi/mlt/10.1080/13545700802528
315
https://www.tandfonline.com/doi/citedby/10.1080/13545700802
528315#tabModule
https://www.tandfonline.com/doi/citedby/10.1080/13545700802
528315#tabModule
G E N D E R D I S P A R I T Y I N E D U C A T I O N A N D
T H E
I N T E R N A T I O N A L C O M P E T I T I O N F O R
F O R E I G N D I R E C T I N V E S T M E N T
Matthias Busse and Peter Nunnenkamp
A B S T R A C T
With few exceptions, the empirical literature on foreign direct
6. investment (FDI)
continues to be gender blind. This paper contributes to filling
this gap by
assessing the importance of gender inequality in education as a
determinant of
FDI. The authors estimate a standard gravity model on bilateral
FDI flows that is
augmented by educational variables, including different
measures of gender
inequality in education. The analysis covers an unprecedented
number of both
host and source countries of FDI, thereby reducing the risk of
distorted results
because of a sample selection bias. The results support the view
that foreign
investors are more likely to favor locations where education-
related gender
disparities are small. However, the discouraging effects of
gender disparity on
FDI are restricted to middle-income (rather than low-income)
developing host
countries and to investors from developed (rather than
developing) countries.
K E Y W O R D S
Foreign direct investment, gender inequality, education
JEL Codes: F23, I21, J16
I N T R O D U C T I O N
The question of whether gender inequality hinders or helps the
integration
of countries into the international division of labor has received
only scant
attention in the empirical literature. Some evidence exists on
7. the links
between gender inequality and trade. Matthias Busse and
Christian
Spielmann (2006) find that wage inequality is positively
associated with
comparative advantage in labor-intensive exports, whereas
inequality in
terms of labor-market participation and education is negatively
related with
such exports. According to Stephanie Seguino (1997), wage
inequality may
have contributed to the export success of countries such as
South Korea.1
However, the role of gender inequality has been largely ignored
in studies
about the countries’ attractiveness for foreign direct investment
(FDI).
Feminist Economics 15(3), July 2009, 61–90
Feminist Economics ISSN 1354-5701 print/ISSN 1466-4372
online � 2009 IAFFE
http://www.tandf.co.uk/journals
DOI: 10.1080/13545700802528315
This is fairly surprising in light of the fierce international
competition for
FDI. Policy-makers are falling over themselves to entice foreign
investors,
for example, by offering tax breaks and outright subsidies, in
the hope that
FDI inflows would induce higher growth and employment. Yet,
8. it is still
open to debate what actually drives FDI inflows.2 In particular,
the sizeable
literature on FDI determinants has generally been gender blind
(Elissa
Braunstein 2006).
This paper attempts to fill this gap by assessing the role of
gender
disparity with respect to host countries’ attractiveness for FDI.
The focus
will be on education-related gender disparity and its effects on
FDI flows to
developing countries, for which the linkage is of particular
concern.3
Opposing hypotheses in this regard call for empirical analyses.
On the one
hand, gender disparity in education may stimulate FDI by
offering cost
advantages if it leads to lower average wages at a given level of
labor
productivity. On the other hand, FDI may be discouraged if
foreign
investors increasingly rely on the local availability of skilled
labor, which
gender disparity in education is likely to constrain.
We estimate a gravity model on bilateral FDI flows, covering as
many
(developing) host countries of FDI as possible to avoid a sample
selection
bias. The standard gravity model is augmented by educational
variables,
including different measures of gender inequality in education.
We chose
9. this rather indirect approach of assessing the FDI effects of
gender disparity
as disparity measures directly capturing wage costs, labor
productivity, and
the qualification of the workforce by gender are unavailable or
subject to
serious data constraints.
Our results clearly reject the view that foreign investors favor
locations
where education-related gender disparities may offer cost
advantages.
Rather, we find that gender disparity discourages FDI inflows.
However, the
strength of this relation depends on the level of education,
being most
pronounced with respect to secondary and tertiary education.
Additional
robustness tests reveal that the discouraging effect of gender
disparity
becomes statistically insignificant when considering only low-
income host
countries and developing source countries.
P R E V I O U S S T U D I E S A N D G E N D E R D I S P A R
I T Y M E A S U R E S
Even though the literature on FDI determinants does not address
gender
issues, a strand of this literature on social factors and FDI
relates to the
analysis in this paper. Several studies raise the question of
whether FDI
tends to go where social standards are low and worker rights are
repressed
to save costs, or rather where social and political conditions are
10. similar to
those prevailing in the home country.4 Howard J. Shatz (2003)
focuses on
education as a determinant of FDI but does not consider gender
gaps in
education. Shatz finds that better educated workers attract more
FDI. The
A R T I C L E S
62
counter-hypothesis is rejected, according to which FDI is
undertaken ‘‘in
countries with low levels of education to escape the high
compensation
costs with which higher levels of education and skill are
associated’’ (Shatz
2003: 188). The question addressed in the following analysis –
that is,
whether gender inequality attracts or rather discourages FDI
inflows –
resembles this strand of the literature on FDI determinants in
that there are
two opposing hypotheses.
On the one hand, gender disparity in education could be
associated with
higher FDI inflows. In the process of economic globalization,
multinational
companies appear to face mounting cost pressure. They
increasingly refer to
vertical types of FDI (also labeled efficiency-seeking FDI),
which provides a
11. means to allocate specific steps of the production process to
where the
relevant comparative advantages can be utilized. Consequently,
this type of
FDI tends to be sensitive to international cost differentials. In
particular,
vertical FDI is often associated with the relocation of labor-
intensive parts of
the value chain to lower-wage locations. This may strengthen
the incentives
of multinational companies to exploit less-skilled, low-wage
female labor. The
movement of FDI in so-called footloose industries, such as
textiles and cloth-
ing, to countries with segmented labor markets may provide
cases in point.5
On the other hand, multinational companies may be more
interested in
drawing on sufficiently qualified labor rather than just cheap
labor. David
Kucera (2002) refers to survey results in which the managers of
multinational companies rated the quality of labor in the host
country to
be more important than the cost of labor. Indeed, empirical
evidence
suggests that the labor demand of multinational companies is
biased toward
relatively skilled workers in developing host countries
(Overseas Develop-
ment Institute 2002). Furthermore, multinational companies are
increas-
ingly under pressure, notably from nongovernmental
organizations
(NGOs), to show good corporate behavior (Matthias Busse
2004). As a
12. consequence, they may shy away from host countries with
pervasive social
injustice in general and gender inequality in particular.6
It follows that the impact of gender inequality in education on
FDI is
theoretically ambiguous. Unit labor costs tend to decline to the
extent that
gender inequality in education involves lower average wages at
a given level
of labor productivity, with less educated women entering the
labor force.7
Locations where education-related gender inequality is more
pronounced
might then have a competitive edge in attracting cost-oriented
FDI of the
vertical type. However, gender inequality may also be
associated with higher
unit labor costs, and thus less vertical FDI, if it is mainly
associated with
lower average labor productivity. In other words, gender
inequality in
education has opposing effects on unit labor costs. Moreover,
the impact of
gender inequality in education on FDI inflows would still be
indeterminate
even if unit labor costs declined on balance. In contrast to
vertical FDI, the
horizontal type of FDI (also labeled market-seeking FDI) may
be unaffected
G E N D E R D I S P A R I T Y A N D F D I
63
13. by changes in unit labor costs. This type of FDI essentially
duplicates the
parent company’s production at home in the host countries.
Market access
motivations dominate over cost considerations, and factor
intensities of
production in the host countries largely resemble those at home.
Hence,
the importance of unit labor costs for overall FDI inflows is
likely to depend
on the composition of FDI, which – though difficult to measure
exactly –
tends to vary considerably across host countries (see also
Kucera [2002]).
Ideally, we would like to cover several aspects of gender
disparity and
their effects on FDI inflows, including gender wage gaps,
differences in
labor-force participation rates between males and females, and
education-
related differences. The focus on education-related disparity
measures
implies some limitations. Inferences about the FDI effects of
gender
disparity in general remain indirect and incomplete. First,
education-
related measures tend to capture the net effects of two
transmission
mechanisms running through wages and labor productivity,
without being
able to disentangle them. Second, any positive FDI effects of
less disparity in
education may be associated with gender wage disparity to the
14. extent that
an improved qualification of female workers does not lead to a
corresponding pay rise. Consequently, concerns about gender
equity and
fairness would not necessarily be overcome if only less gender
disparity in
education resulted in more FDI.
However, wage disparity measures and differences in labor-
force
participation rates are not particularly useful as possible
determinants of
FDI in the present context of a large panel of host countries and
a time
span of about twenty-five years because of the following
reasons:
. Data on wage differences are only available for selected years
and a
limited number of countries.8 The insufficient country coverage
especially may cause seriously biased results when analyzing
FDI
determinants (Shatz 2003; Matthias Busse, Jens Königer, and
Peter
Nunnenkamp 2008). Moreover, when available, wage data
typically
refer to the manufacturing sector only (Kucera 2002; Busse and
Spielmann 2006).9 This limitation is problematic, as FDI in
develop-
ing countries increasingly consists of FDI in the services sector
(United Nations Conference on Trade and Development
[UNCTAD]
2004; Braunstein 2006). And finally, the problem of reverse
causation
running from FDI to wages and wage disparity would be all but
impossible to resolve.
15. . Similar arguments apply to labor-force participation rates.
Again,
problems of reverse causality loom large (Braunstein 2006). The
statistically insignificant results Kucera (2002) achieves when
adding
the proportion of female workers in the industry to his list of
FDI
determinants may well reflect that causality between FDI and
female
employment shares goes both ways (see also Elissa Braunstein
A R T I C L E S
64
[2002]). Moreover, gender-specific labor-market participation
rates
do not necessarily reflect discrimination but rather may be
based on
voluntary decisions of female workers (Busse and Spielmann
2006).
Consequently, education-related gender disparity appears to be
the first
choice when analyzing FDI determinants. While theory
indicates that the
level of education in a host country should influence FDI
inflows (Shatz
2003), the possibility of reverse causation – meaning that higher
FDI results
in better education – seems to be rather remote in comparison
with wages
and employment. The empirical studies of Shatz (2003) as well
16. as Jonathan
Eaton and Akiko Tamura (1996), considering education among
the
determinants of FDI, find that better educated workers in host
countries
attract higher FDI inflows. However, both studies cover only
selected FDI
source countries (United States FDI in the case of Shatz, US
and Japanese
FDI in the case of Eaton and Tamura). Furthermore,
Braunstein’s (2006)
verdict that most FDI studies are gender blind applies to both
Shatz (2003)
and Eaton and Tamura (1996).
To the best of our knowledge, Kucera (2002) is the only
exception in that
he considers gender-specific educational variables as
determinants of FDI.
He does not find evidence suggesting that education-related
gender
disparity resulted in higher FDI inflows. Yet, his results are far
from robust.
The positive effect of (relative) female educational attainment
on FDI is
statistically significant only when high-income host countries
are included
in the sample, and the coefficient of this variable even changes
its sign once
the regressions are run with regional dummies.
Moreover, Kucera’s study has some shortcomings that we
attempt to
overcome in the following analysis. First of all, it is purely
cross-sectional,
while we use a panel analysis to examine changes over time in
17. the relation
between gender gaps in education and FDI. Second, we employ
a gravity
model on bilateral FDI flows, and we explicitly account for the
fact that
various host countries have not attracted any FDI flows from
particular
source countries. Third, we draw on a large, new dataset to
cover essentially
all (developing) host countries as well as a large number of
source
countries and thereby avoid, or at least substantially reduce, a
sample
selection bias.
In the regressions reported below, we measure gender gaps in
education
by comparing females and males with respect to average years
of schooling.
While we also consider three different levels of education when
estimating
the Tobit model later in this paper, we confine the subsequent
presentation
of stylized facts to gender gaps in education at all levels of
schooling
combined, in order to save space. We compare the situation
prevailing in
1980 with that in the most recent years (average of 2000 and
2005). The
mean and the range of gender differences at specific levels of
schooling are
presented in the Appendix.
G E N D E R D I S P A R I T Y A N D F D I
65
18. In Figure 1, ratios far below one reflect larger gender gaps in
education
working against women. On the other hand, women are
overrepresented in
some countries with ratios above one (notably in several Latin
American
countries). Not surprisingly, high-income countries, on average,
have a
relatively narrow gender gap in education, whereas the gap is
widest in low-
income countries. This applies to both 1980 and the most recent
years. In
contrast to what one might expect, however, there is also
considerable
variation over time.10 Middle-income countries, on average,
caught up with
high-income countries in terms of narrowing the gender gap; in
recent
years, middle-income countries resembled the high-income
group in that
the gender gap in education was less than 10 percent. At the
same time,
low-income countries, while still lagging behind, made
remarkable progress
in expanding the schooling of females relative to males.
Moreover, the group averages reported in Figure 1 conceal
considerably
different developments in particular countries. This may be
exemplified by
three middle-income countries in Latin America. Colombia and
Honduras
started with a ratio of close to one in 1980 but through
19. subsequent
developments diverged: females spent 24 percent more time in
education
than males in Colombia in recent years, whereas the ratio of
females to
males deteriorated to 0.67 in Honduras. Bolivia, starting with a
pronounced
gender gap (0.68), made substantial progress in closing this gap
(to 0.88 in
2000/2005). Similar discrepancies apply to low-income
countries in sub-
Saharan Africa. Mozambique reported a large gender gap (0.23)
at the
beginning of the period of observation but a relatively narrow
one recently
Figure 1 Gender disparity in schooling,a 1980 and 2000/2005
Note: aAverage years of schooling at all levels combined:
females divided by males;
2000/2005 represents the average for 2000 and 2005.
Sources: Robert J. Barro and Jong-Wha Lee (2001) and
UNESCO (2007).
A R T I C L E S
66
(0.69). Ghana and Sudan both started at a ratio of females to
males in
education of about 0.4. While this ratio increased to 0.62 in
Sudan, it
declined slightly in Ghana.
A P P R O A C H A N D D A T A
20. We follow a standard approach in the large empirical FDI
literature11 and
estimate a gravity-type model on the determinants of FDI.
Gravity models
are widely used to analyze the movement of goods, services,
and factors of
production between different locations within or across
countries. The
common intuition is to portray spatial transactions analogous to
Newton’s
Law of Gravity. Consequently, mass and distance are core
elements of this
class of models. In cross-country contexts as the present one,
the focus is on
economic size (in terms of income and/or population) and
geographical
distance between each pair of countries. Economic interaction is
supposed
to be an increasing function of the economic size of partner
countries and
a decreasing function of the distance between them; larger
countries with
higher income are thus expected to be involved in more
transactions with
nearer-by and larger countries. Various extensions of this basic
model
structure have been suggested in the literature. The extended
version we
use is specified below.
As noted by Alan V. Deardorff (1998), this class of models first
appeared in
the empirical economics literature on bilateral trade flows.
Deardorff also
shows that simple gravity models can be derived from standard
21. trade theories.
More recently, gravity models have also been applied to analyze
financial flows.
The explanatory power of gravity models on financial flows is
comparable with
that of models on trade flows (Philippe Martin and Hélène Rey
2004).
According to Richard Portes and Hélène Rey, this is hardly
surprising as the
gravity approach ‘‘emerges naturally’’ from theories of asset
trade (2005: 275).
Recent examples employing gravity models to analyze bilateral
FDI include
Shatz (2003) and John H. Mutti and Harry Grubert (2004).
Hence, in contrast to Avik Chakrabarti’s earlier verdict of
‘‘measurement
without theory’’ (2001: 90), there appears to be widespread
agreement by
now on the appropriate analytical framework to guide empirical
work on the
determinants of FDI. Indeed, variables such as market size and
openness to
trade that the extreme bounds analysis of Chakrabarti (2001)
found to be
fairly robust determinants of FDI represent important
cornerstones of the
gravity model. The particular advantage of the extended gravity
model in
explaining the determinants of bilateral FDI flows is the fact
that differences
between source and host country characteristics can be used as
explanatory
variables. A standard FDI analysis using aggregated FDI flows
for each
country would not be suitable for that task.
22. While the core variable set of gravity models helps prevent
fragile results
due to ad-hoc choices on control variables, the estimation
results may still
G E N D E R D I S P A R I T Y A N D F D I
67
be sensitive to sample selection. Shatz’s (2003) analysis of US
FDI clearly
reveals that sample selection matters for empirical results.12
Consequently,
we cover as many countries as possible in our baseline
regressions and, at
the same time, perform robustness tests for specific sub-
samples.13
Furthermore, when applying gravity models to FDI flows, one
must take
into account the concentration of FDI in a few host countries.
During the
period under consideration (1978–2004), about 80 percent of
FDI flows to
all (150) middle- and low-income countries were concentrated
in just
twenty countries (World Bank 2006). Bilateral FDI flows are
often equal to
zero; this applies to roughly three-quarters of all observations
in our
sample. The censored nature of this variable implies that the
results from
OLS estimations would very likely be biased. Therefore, we use
23. a non-linear
method of estimation such as Tobit.
The Tobit model represents our preferred option among
alternative
approaches suggested in the literature to avoid biased results
when the
dependent variable is censored.14 This model estimates FDI
flows between
a particular pair of countries in one step. The underlying
assumption is
that the explanatory variables have the same impact on (1) the
probability
of receiving any bilateral FDI at all (selection decision) and (2)
the amount
of FDI allocated thereafter (allocation decision). This
assumption
appears to be reasonable in the context of bilateral FDI flows; it
would
be difficult to find an exclusion variable that affects selection
but does not
affect allocation, as two-step models such as the Heckman
model would
require.
In our empirical approach, we principally follow David L. Carr,
James R.
Markusen, and Keith E. Maskus (2001), who estimate the so-
called
knowledge-capital model that integrates the previously separate
concepts
of horizontal (market-seeking) and vertical (efficiency-seeking)
FDI into a
single model by considering the determinants of both types of
FDI within a
single estimation equation.15
24. Our basic specification reads as follows:
InðFDI ijtÞ¼ a0 þ a1lnðFDI ijt�1Þþ g
0X jt þ f0Y ijt þ a2 GenderInequalityjt
þ lt þ eijt ð1Þ
where FDIijt stands for foreign direct investment of country i in
country j at
period t, FDIijt-1 corresponds to FDI inflows in the previous
period t-1, Xjt
represents a set of host country control variables, Yijt denotes
the differ-
ence between source and host country characteristics, lt is a set
of year
dummies, and GenderInequalityjt corresponds to gender
inequality in
education between males and females in the host country. The
error term
of the random effects estimation can be written as:
eijt ¼ nijt þ uijt ð2Þ
A R T I C L E S
68
where uijt is the random unobserved bilateral effect and vijt
represents the
remaining error.16
For the dependent variable, we use two measures of FDI: first,
FDI flows
25. from the source to the (developing) host country in percent of
host country
GDP (the variable is labeled FDI1), and second, the share of
FDI attracted
by a specific (developing) host country in total FDI flows from
the source
country under consideration to all developing host countries
(FDI2)
included in our sample. The second measure captures the
attractiveness of
a particular country relative to other host countries. We
calculate three-year
averages to smooth the considerable fluctuation of annual
bilateral FDI
flows. At the same time, this approach ensures that we have
enough
variation in the data.17
The limited host country coverage of previous analyses of
bilateral FDI
flows is overcome by fully exploiting the (largely unpublished)
data
available upon request from UNCTAD’s Data Extract Service.
Yet, some
data limitations remain. Most importantly, it is not possible to
differentiate
between different types of bilateral FDI flows. For instance,
vertical FDI
should be affected more strongly by gender inequality in
education than
horizontal FDI; it is mainly the former type of FDI that is
supposed to
depend on international cost differences as well as the
availability of
sufficiently qualified labor in the relevant literature. Likewise,
the impact of
26. gender inequality in education may be stronger in the case of
greenfield
FDI, compared with mergers and acquisitions (M&As), which
amount to a
change in ownership of existing production facilities and may
be driven by
asset-seeking motives in the first place.18 Tax-induced
distortions in
international FDI patterns are minimized by excluding FDI
flows to
offshore financial centers (see also below); but the problem
remains that
FDI channeled through offshore centers to the ultimate host
country
cannot be accounted for appropriately.
We include the lagged dependent variable on the right-hand side
of the
regression equation for two reasons. First, this solves the
potential problem
of autocorrelation in the pooled time-series regressions.19
Second, this
procedure is theoretically plausible as foreign investment in the
previous
period is highly relevant for FDI in the current period. Above
all, countries
that already have considerable FDI inflows are much more
likely to attract
multinational corporations. This has been shown, for example,
by Victor M.
Gastanaga, Jeffrey B. Nugent, and Bistra Pashamova (1998); the
lagged FDI
variable is always highly statistically significant in their
regressions. By
including lagged FDI flows, the econometric specification
becomes a
27. dynamic panel.
We employ a fairly standard set of controls, including total host
country
population and real GDP growth for market-seeking FDI
(labeled
population and growth, respectively),20 host country inflation
(inflation),
host country openness to trade (openness), the difference in
GDP per capita
G E N D E R D I S P A R I T Y A N D F D I
69
between the source and the host country for vertical FDI
(DiffGDPpc), and a
dummy for the existence of a bilateral or regional trading
agreement – that
is, a free trade agreement or customs union (RTA). We expect a
positive
association of population, growth, DiffGDPpc, and RTA with
FDI; the opposite
applies to inflation, as this variable can be interpreted as a
proxy for
macroeconomic distortions. Exact definitions and data sources
for all
variables as well as descriptive statistics can be found in the
Appendix.
As for time invariant variables, we also closely follow the
empirical
literature on gravity models and incorporate dummies for a
common border, a
28. common language, and colonial ties as well as the distance
between the source
and the host country (distance). The first three control variables
are
expected to be positively associated with FDI flows, whereas
the sign of
distance is unclear. On the one hand, management and transport
costs are
likely to increase if two countries are located far away from
each other; on
the other hand, remote markets might be better served through
local
production, that is, FDI in the host country. Hence, the net
impact on FDI
is uncertain.
To reduce the skewness in the data, we take the natural
logarithm of
population, FDI1, FDI2, DiffGDPpc, distance, and inflation.
But this would
mean that we would lose observations with negative values or
zeros. To
overcome this problem, we use the following logarithmic
transformation
that reduces the skewness in the data and, at the same time,
retains negative
and zero observations:
y ¼ ln x þ
ffiffiffiffiffiffiffiffiffiffiffiffiffiffiffiffiffi
x2 þ 1ð Þ
p� �
ð3Þ
Using this transformation leaves the sign of x unchanged, while
29. the values
of x pass from a linear scale at small absolute values to a
logarithmic scale at
large values.
In addition to these standard control variables, we include the
institutional development of host countries, proxied by political
constraints
on the executive branch (political constraints). Poor institutions
may
discourage FDI by giving rise to uncertainty (for example, with
respect to
the protection of property rights [Jeong-Yeon Lee and Edwin
Mansfield
1996; Witold J. Henisz 2000]) and additional costs (for
example, in the case
of corruption [Shang-Jin Wei 2000]). We use the index for
political
constraints that was developed by Henisz (2000). In contrast to
alternative
institutional indicators, this variable is available for a large
number of
countries and years. Political constraints focuses on the
political discretion of
the executive branch. Less discretion is supposed to render
credible
commitments to (foreign) investors more likely. The indicator
ranges from
zero (total political discretion) to one (no political discretion).
Thus, we
expect a positive link between political constraints and FDI
flows. Finally, we
include two variables that control for investment liberalization:
(1) CapOpen
A R T I C L E S
30. 70
for unilateral capital account liberalization of the host country
(Menzie D.
Chinn and Hiro Ito 2005) and (2) BIT for a bilateral investment
treaty
ratified between the source and the host country (Busse,
Königer, and
Nunnenkamp 2008). Both measures are expected to stimulate
higher FDI
flows.
Lastly, we measure the variable of principal interest, gender
inequality in
education, as the difference between the male and female score
for average
years of schooling in the population aged 25 and above
(education
inequality).21 In additional estimations, we use more detailed
information
of gender inequality in primary, secondary, and tertiary
education. This
allows us to examine at which level of education gender
inequality matters
most for the host countries’ attractiveness to FDI. Needless to
say, we also
control for years of schooling of both sexes combined with
respect to either
all levels of schooling (education) or specific levels of
schooling (primary
education, secondary education, and tertiary education).
Our analysis covers the period 1978–2004, that is, optimally
31. nine
observations of three-year averages for all indicators.
UNCTAD’s Data
Extract Service provides FDI data since 1970, but very few
countries report
FDI flows for the 1970s at a bilateral level. To avoid any biases
arising from
an extremely small sample of reporting countries, we start with
1978. We
exclude financial offshore centers, such as Panama, the
Bahamas, or the
Cayman Islands.22 Extending the sample to include a large
number of poor
developing host countries is crucial to avoid a sample selection
bias and to
assess the chances of these countries becoming more attractive
to FDI. Our
sample consists of seventy-seven developing host countries,
based on the
World Bank’s classification of low- and middle-income
countries.23 By
covering twenty-eight FDI source countries, including various
non-OECD
source countries, we at least partly capture the recent surge of
FDI flows
from developing countries to other developing countries. The
Appendix
includes lists of the source and host countries.
M A I N R E S U L T S
Following the model specification and the introduction of the
variables, we
now turn to the empirical results. Table 1 reports the results of
the Tobit
model for both FDI variables and total years of schooling. The
32. estimations
include all control variables introduced before. Apart from
inflation, all
control variables have the expected sign, and the significance of
the
coefficients is not much affected when considering FDI as a
share of GDP
(FDI1) or FDI shares (FDI2) as the dependent variable.
As anticipated, FDI in the past is a strong predictor for current
FDI as the
coefficient of the lagged dependent variable is positive and
highly
statistically significant. The strongly positive coefficients of the
host
countries’ populations, GDP growth rates, and the differences in
per
G E N D E R D I S P A R I T Y A N D F D I
71
capita income between the host and source countries
(DiffGDPpc) reveal
that FDI flows to the sample countries are driven by both
market-seeking
and efficiency-seeking motives (horizontal and vertical FDI).
The impor-
tance of vertical FDI is also indicated by the significantly
positive coefficient
of openness; greater openness to trade reflected in this variable
improves the
host countries’ attractiveness to FDI involving the relocation of
particular
33. segments of the value chain and the offshoring of intermediate
produc-
tion.24 Likewise, less regulated capital transactions are
associated with
higher bilateral FDI flows, as the coefficient of CapOpen is
positive and
significant at the 1 percent level.
Apart from colonial ties in one specification, all the time-
invariant
variables traditionally included in gravity models turn out to be
statistically
significant at the 5 percent level. Bilateral FDI flows between a
source and a
host country having a common border or speaking the same
language are
higher than bilateral flows between countries without such
common
characteristics. The same applies for colonial ties (except
column [2]). By
contrast, a larger distance between the host and the source
country tends to
reduce bilateral FDI flows. Distance-related management and
transport
costs outweigh the source country’s incentive to undertake FDI
in remote
countries and serve these markets through local production.
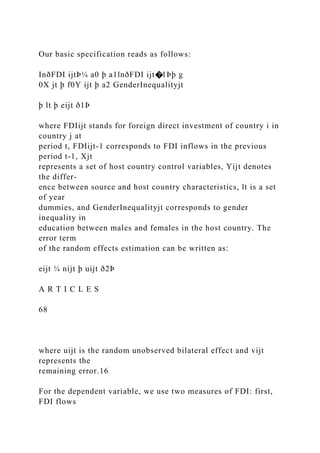
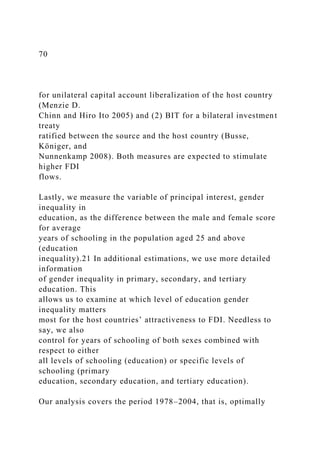
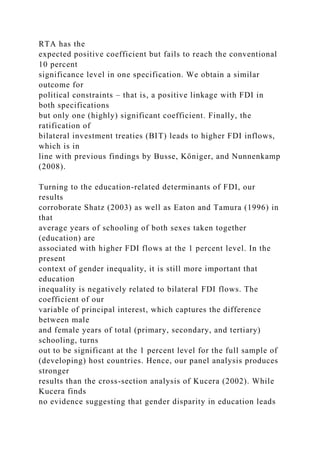
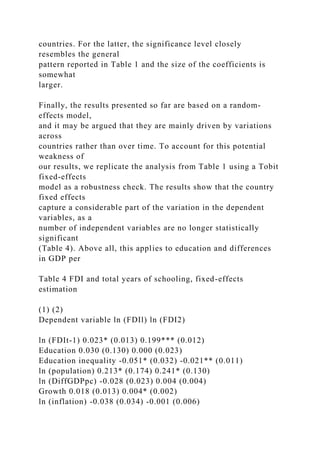
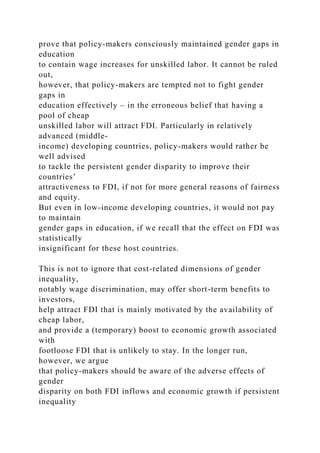
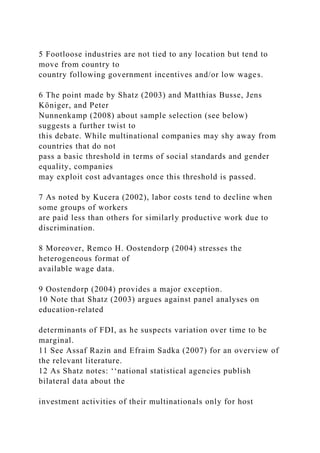
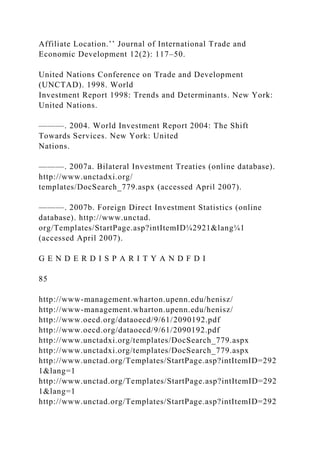
Table 1 FDI and education, total years of schooling
(1) (2)
Dependent variable ln (FDIl) ln (FDI2)
ln (FDIt-1) 0.299*** (0.012) 0.619*** (0.020)
Education 0.108*** (0.021) 0.035*** (0.005)
Education inequality -0.128*** (0.043) -0.050*** (0.009)
34. ln (population) 0.291*** (0.033) 0.101*** (0.008)
ln (DiffGDPpc) 0.044*** (0.009) 0.007*** (0.002)
Growth 0.027** (0.012) 0.005** (0.002)
ln (inflation) 0.004 (0.026) 0.003 (0.005)
Openness 0.004*** (0.001) 0.001*** (0.000)
Common border 0.674** (0.290) 0.295*** (0.061)
Common language 0.476*** (0.110) 0.080*** (0.023)
ln (distance) -0.539*** (0.063) -0.143*** (0.014)
Colonial ties 0.448** (0.210) 0.037 (0.044)
RTA 0.518** (0.200) 0.050 (0.041)
Political constraints 0.710*** (0.190) 0.022 (0.038)
CapOpen 0.081*** (0.029) 0.020*** (0.006)
BIT 0.390*** (0.096) 0.028** (0.012)
Observations 8,299 8,299
Country pairs 1,531 1,531
Notes: Marginal effects, computed at the mean, are displayed;
standard errors are reported in
parentheses; due to space constraints, the coefficients for
constant term and the year dummies are
not shown; *** significant at 1 percent level, ** significant at 5
percent level, and * significant at 10
percent level. The p-values of the Wald w2 test for the null
hypothesis that all explanatory variables
equal zero are always statistically significant at the 1 percent
level (not reported).
A R T I C L E S
72
Results turn out to be weaker for some other control variables.
In contrast
to our expectations, inflation is positive but never significant.25
35. RTA has the
expected positive coefficient but fails to reach the conventional
10 percent
significance level in one specification. We obtain a similar
outcome for
political constraints – that is, a positive linkage with FDI in
both specifications
but only one (highly) significant coefficient. Finally, the
ratification of
bilateral investment treaties (BIT) leads to higher FDI inflows,
which is in
line with previous findings by Busse, Königer, and Nunnenkamp
(2008).
Turning to the education-related determinants of FDI, our
results
corroborate Shatz (2003) as well as Eaton and Tamura (1996) in
that
average years of schooling of both sexes taken together
(education) are
associated with higher FDI flows at the 1 percent level. In the
present
context of gender inequality, it is still more important that
education
inequality is negatively related to bilateral FDI flows. The
coefficient of our
variable of principal interest, which captures the difference
between male
and female years of total (primary, secondary, and tertiary)
schooling, turns
out to be significant at the 1 percent level for the full sample of
(developing) host countries. Hence, our panel analysis produces
stronger
results than the cross-section analysis of Kucera (2002). While
Kucera finds
no evidence suggesting that gender disparity in education leads
36. to higher
FDI inflows, our results support the stronger conclusion that
gender
disparity in education clearly reduces FDI inflows.
The quantitative effect of less gender disparity in education on
FDI inflows
is modest but by no means negligible. Taking the estimated
coefficient on
education inequality with FDI1 as the dependent variable
(70.128) at face
value, a decrease in the difference between male and female
years of total
schooling by 0.25 years (that is, the standard deviation of
education inequality)
would lead – on average – to an increase in the FDI/GDP ratio
by some 2.5
percent.26 The long-run effect would be still more pronounced.
The long-
run effect can be calculated by dividing the coefficient of
education inequality
by one minus the coefficient of the lagged dependent variable.
Based on the
estimate reported in column (1) of Table 1, the long-run FDI
effect of a
decrease in education inequality by one standard deviation
would amount to
3.6 percent of FDI inflows as a share of GDP.
Overall, the findings for the effect of gender inequality on FDI
underscore the findings for the effect of the education of both
sexes
combined on FDI: In the first place, the attractiveness of host
countries to
FDI stems from offering foreign investors the opportunity to
draw on
37. sufficiently qualified labor, be it male or female workers. This
does not rule
out that foreign investors aim to reduce wage costs for similarly
qualified
labor.27 But the estimation results suggest that the wage-
reducing motive of
FDI is dominated by the motive to complement FDI-related
production
techniques with sufficiently qualified labor in the host country.
Gender
inequality in education tends to constrain this option as it limits
the pool of
G E N D E R D I S P A R I T Y A N D F D I
73
locally available labor that meets the standards required by
foreign
investors.
In the next step of our analysis, we differentiate the educational
variables
(average years of schooling of both sexes combined as well as
gender
disparity related to years of schooling) by considering three
levels of
schooling separately. In all other respects, the specification of
the Tobit
model remains as before.28
The results shown in Table 2 suggest that education at all levels
is positively
associated with FDI inflows. In contrast to Shatz (2003), we do
38. not find that
primary education had stronger effects on FDI than higher
levels of
education. The pattern found here for various sources of FDI
appears to be
plausible given that primary education tends to be a weaker
indicator of the
availability of skilled labor than higher levels of education. US
FDI
(analyzed by Shatz) may deviate from this pattern because the
motives
underlying US FDI differ from those underlying FDI from other
sources.29
Off-shoring labor-intensive parts of the production process to
lower income
host countries appears to figure relatively prominently in US
FDI, which
may thus depend less on skilled local labor.
Moreover, we do not find any evidence that gender inequality
results in
higher FDI inflows either at the lower level of primary
education or at the
higher level of secondary and tertiary education. Rather, as
before for total
schooling, all coefficients on education inequality are
statistically significant
and have the same negative sign. Apart from inequality in
tertiary
education, the coefficients reach the 1 percent significance
level. However,
the results also show that the size of the coefficients at the
secondary and
tertiary level of education is considerably higher in comparison
to the
39. primary level. In other words, changes in secondary or tertiary
education
disparities have a much stronger impact on FDI inflows than
changes at the
primary level.
S E N S I T I V I T Y A N A L Y S E S
We perform two types of sensitivity analyses in this section.
First, we
replicate our estimations with average years of schooling at all
levels
combined for various sub-samples of host and source countries,
and
second, we perform Tobit fixed-effects estimations to control
for country-
pair fixed effects.
In the estimations reported in Table 3, we return to average
years of
schooling at all levels combined as a measure of gender
inequality in
education. To save space, we show only the results for the
variable of
principal interest in the present context.30 To facilitate
comparison, the
main results from Table 1 are listed again in the first row of
Table 3.
The size of the discouraging effect of gender inequality in
education on
FDI inflows may depend on the stage of development of the
host country.
A R T I C L E S
100. ca
n
t
a
t
1
0
p
e
rc
e
n
t
le
ve
l.
G E N D E R D I S P A R I T Y A N D F D I
75
For this reason, we test whether a differentiation of the fairly
hetero-
geneous group of developing host countries offers additional
insights.
Indeed, the discouraging effects of gender inequality on FDI are
confined
to middle-income countries, which (according to the World
101. Bank’s
classification) comprise countries with a per capita income of
between
US$876 and US$10,725 in 2005 (World Bank 2006). By
contrast, gender
inequality remains completely statistically insignificant as a
determinant of
FDI in low-income countries, that is, countries with a per capita
income of
US$875 or less. Some types of FDI undertaken in low-income
countries are
rather unlikely to be motivated by the availability of qualified
labor. For
example, this probably applies to resource-seeking FDI in the
primary
sector, which accounts for the bulk of total FDI flows to various
low-income
countries. In any case, qualified labor tends to be in extremely
short supply
in these host countries, and less gender inequality in education
is unlikely
to improve this situation substantially. Consequently, foreign
investors in
low-income host countries may care less about gender
inequality than in
more advanced host countries. It is important to note, however,
that even
in low-income countries gender inequality does not induce more
FDI.
Next, we check whether the impact of gender inequality on FDI
has
changed over time. One would expect that the discouraging
effect had
become more pronounced in recent years. The demand of
foreign
102. investors for qualified local labor may have risen with the
increasing
complexity of production techniques transferred to the host
countries. In
fact, there is support for this proposition as the size of the
coefficients is
larger (in both regressions) when the estimations are based on
the 1990–
2004 period, instead of between 1978 and 2004.
Next, we replicate the estimations for two groups of source
countries. As
mentioned previously, developing countries have increasingly
become
sources of FDI. Arguably, the motives underlying FDI from
developing
countries differ from the motives underlying FDI from more
advanced
Table 3 Robustness checks and extensions, education inequality
(1) (2)
Dependent variable ln (FDI1) Ln (FDI2)
Full sample (as reported in Table 1) -0.128*** (0.043) -
0.050*** (0.009)
Middle-income countries -0.246*** (0.059) -0.066*** (0.013)
Low-income countries 0.075 (0.085) 0.007 (0.011)
Period 1990–2004 -0.204*** (0.060) -0.107*** (0.017)
Developed source countries -0.182*** (0.061) -0.062***
(0.010)
Developing source countries 0.021 (0.039) -0.003 (0.019)
Notes: To save space, we only report the results for the
education inequality variable; *** significant at
1 percent level, ** significant at 5 percent level, and *
103. significant at 10 percent level. See Table 1 for
further notes.
A R T I C L E S
76
source countries: On the one hand, wage-related cost savings
could be a less
important driving force of FDI undertaken by less developed
source
countries in other developing countries, since wages tend to be
similar in
the source and the host country. Ceteris paribus, this could have
strengthened the discouraging effect of gender inequality on
FDI from
developing countries. On the other hand, some relatively
advanced
developing source countries appear to have used FDI as a means
to
relocate less sophisticated industrial activities to where cost
savings could be
realized.31 This type of FDI probably draws less on qualified
labor in the
lower-income host countries.32
It turns out that gender inequality in education enters
insignificantly
when the estimation is restricted to developing source countries.
The
results for the full sample of source countries are mainly driven
by the
discouraging effect of gender inequality on FDI from developed
source
104. countries. For the latter, the significance level closely
resembles the general
pattern reported in Table 1 and the size of the coefficients is
somewhat
larger.
Finally, the results presented so far are based on a random-
effects model,
and it may be argued that they are mainly driven by variations
across
countries rather than over time. To account for this potential
weakness of
our results, we replicate the analysis from Table 1 using a Tobit
fixed-effects
model as a robustness check. The results show that the country
fixed effects
capture a considerable part of the variation in the dependent
variables, as a
number of independent variables are no longer statistically
significant
(Table 4). Above all, this applies to education and differences
in GDP per
Table 4 FDI and total years of schooling, fixed-effects
estimation
(1) (2)
Dependent variable ln (FDIl) ln (FDI2)
ln (FDIt-1) 0.023* (0.013) 0.199*** (0.012)
Education 0.030 (0.130) 0.000 (0.023)
Education inequality -0.051* (0.032) -0.021** (0.011)
ln (population) 0.213* (0.174) 0.241* (0.130)
ln (DiffGDPpc) -0.028 (0.023) 0.004 (0.004)
Growth 0.018 (0.013) 0.004* (0.002)
ln (inflation) -0.038 (0.034) -0.001 (0.006)
105. Openness 0.008*** (0.003) -0.001 (0.001)
RTA 0.436 (0.290) 0.096* (0.053)
Political constraints 0.352 (0.280) 0.006 (0.051)
CapOpen 0.114*** (0.044) 0.008 (0.008)
BIT 0.178* (0.101) 0.006* (0.003)
Observations 8,299 8,299
Country pairs 1,531 1,531
Notes: See Table 1; *** significant at 1 percent level, **
significant at 5 percent level, and * significant
at 10 percent level.
G E N D E R D I S P A R I T Y A N D F D I
77
capita. On the other hand, market size (population), economic
growth,
openness to trade, joining a regional trade agreement, and
liberalizing the
capital account through unilateral measures or bilateral
investment treaties
still matter for FDI flows, though significance levels tend to be
weaker in
comparison to the random-effects model and the coefficients
often remain
insignificant in one of our two specifications. Importantly,
gender inequal-
ity in education is always negatively associated with FDI
inflows; the
coefficient is significant at the 10 percent level or better.
Jointly with the
previous evidence from additional regressions in this section,
this outcome
106. demonstrates that the link between education inequality and FDI
inflows is
quite robust.
C O N C L U S I O N S
With few exceptions, the empirical literature on FDI continues
to be
gender blind. This paper contributes to filling this gap by
assessing the
importance of gender inequality in education as a determinant
of FDI. We
estimate a standard gravity model on bilateral FDI flows, which
is
augmented by educational variables, including measures of
gender
inequality in education. Since we lack sufficient data on
disparity measures
such as wages, labor productivity, and worker qualification by
gender, this
approach takes an indirect route by testing the opposing
propositions that
gender disparity in education may either stimulate FDI by
reducing unit
labor costs or discourage FDI by constraining the local
availability of
sufficiently qualified labor.
We find no evidence whatsoever that multinational companies
favor
locations where education-related gender disparity exists.
Gender disparity
in education clearly discourages FDI flows from developed
countries to
relatively advanced (middle-income) developing countries.
However, the
107. effect is statistically insignificant in low-income host countries.
The latter
finding can be attributed to the prominence of specific types of
FDI that
rely considerably less on qualified local labor; resource-seeking
FDI in the
primary sector of low-income countries is a case in point.
Likewise, the
motivation underlying FDI from developing countries –
including resource-
seeking and cost-oriented FDI in fairly poor developing
countries –
provides an explanation for why this group of foreign investors
appears to
care less about gender inequality in the host countries.
The finding that gender disparity does not attract FDI for any of
the sub-
groups of host and source countries under consideration has
important
implications for the fierce international competition for FDI
inflows. It
would clearly be counter-productive if policy-makers entered
into a race to
the bottom not only by lowering corporate tax rates or corporate
contributions to social security systems but also by being
lenient about
the still widespread gender gaps in education. It is obviously
difficult to
A R T I C L E S
78
108. prove that policy-makers consciously maintained gender gaps in
education
to contain wage increases for unskilled labor. It cannot be ruled
out,
however, that policy-makers are tempted not to fight gender
gaps in
education effectively – in the erroneous belief that having a
pool of cheap
unskilled labor will attract FDI. Particularly in relatively
advanced (middle-
income) developing countries, policy-makers would rather be
well advised
to tackle the persistent gender disparity to improve their
countries’
attractiveness to FDI, if not for more general reasons of fairness
and equity.
But even in low-income developing countries, it would not pay
to maintain
gender gaps in education, if we recall that the effect on FDI was
statistically
insignificant for these host countries.
This is not to ignore that cost-related dimensions of gender
inequality,
notably wage discrimination, may offer short-term benefits to
investors,
help attract FDI that is mainly motivated by the availability of
cheap labor,
and provide a (temporary) boost to economic growth associated
with
footloose FDI that is unlikely to stay. In the longer run,
however, we argue
that policy-makers should be aware of the adverse effects of
gender
disparity on both FDI inflows and economic growth if persistent
inequality
109. in education adds to the supply of cheap female workers. Our
estimation
results suggest that the negative effects of gender disparity on
FDI are
quantitatively modest in the short run but clearly become more
important
over time. This implies that persistent gender disparity in
education would
run the risk of developing host countries ending up in a trap of
low wages,
low labor productivity, and footloose FDI.
Multinational companies in the manufacturing and services
sectors tend
to rely on relatively skilled labor in the host countries.
Unskilled labor-
intensive FDI – for example, in footloose industries such as
clothing and
footwear – may have received considerable public attention. But
empirical
evidence indicates that foreign investors in developing countries
typically
apply more advanced production techniques than local firms
operating in
the same industry, and FDI is frequently concentrated in skill-
intensive
industries (Overseas Development Institute 2002). It also
appears that
multinational companies are pursuing increasingly complex
integration
strategies (UNCTAD 1998), in which educated and well-trained
labor plays
an important role. With labor demand of foreign investors being
focused
on higher skills, better-educated and high-skilled women would
enhance
110. the attractiveness to FDI by adding to the pool of skilled labor
available in a
host country.
Our findings suggest that less gender disparity in education
would
promote FDI-related economic growth in the long run.
According to the
relevant literature, the growth effects of FDI in developing host
countries
critically depend on the degree to which transfers of technology
and
know-how are disseminated throughout the host economy.33
Local
absorptive capacity plays an important role with regard to FDI-
related
G E N D E R D I S P A R I T Y A N D F D I
79
spillovers: FDI can only be expected to provide a stimulus to
economy-
wide productivity gains if local producers and workers are
sufficiently
qualified to imitate superior technology and acquire advanced
skills.
According to Eduardo Borensztein, José De Gregorio, and Jong-
Wha Lee
(1998), local human capital constraints hinder stronger growth
effects of
FDI. Increasing female education and skills levels can help
overcome this
constraint and, thereby, help transform larger FDI inflow into
111. higher
economic growth.
By analyzing the FDI effects of gender inequality in education,
we specify
an important transmission mechanism that has received little
attention in
the literature on gender inequality and economic growth.
However, the
present paper offers just one more piece of the complex puzzle
on gender
inequality and economic growth. Further research is clearly
required in
several respects. First, we do not address dimensions of gender
disparity
other than education-related disparity. In particular,
immediately cost-
related dimensions, such as wage discrimination, may have
different
implications for specific types of FDI. Wage disparity may
attract cost-
oriented FDI, notably the off-shoring of labor-intensive parts of
production.
This would resemble the finding of Busse and Spielmann (2006)
that wage
disparity is positively associated with comparative advantage in
labor-
intensive export production. Furthermore, the particular
dimension of
gender inequality matters not only for FDI but also more
broadly for the
economic development of the host countries (Jean Drèze and
Amartya Sen
1989; Lant Pritchett and Lawrence H. Summers 1996; Stephanie
Seguino
2000; Stephan Klasen 2002).
112. Second, disaggregating the different types of FDI may also
complement
the picture of FDI-related transmissions of gender disparity to
growth.
Specific types of FDI are likely to respond differently to gender
disparity.
For example, FDI of the horizontal (or local market-seeking)
type may be
less affected than FDI of the vertical (or efficiency-seeking)
type by gender
inequality in terms of both education and labor costs. At the
same time, the
growth effects may depend on the specific type of FDI. The
literature on
the growth effects of (aggregate) FDI suggests that attracting
more FDI per
se is no guarantee to achieve higher growth (for example, Maria
Carkovic
and Ross Levine 2005). Data constraints render it difficult to
assess the
transmission mechanisms between gender disparity and growth
for specific
types of FDI in the context of broad (host and source) country
samples. A
more promising option could be to conduct case studies for
specific host
countries attracting different types of FDI. Another option
would be to
focus on one particular source country, notably the US, which
offers
detailed data on the operations of foreign affiliates that may
allow for a
distinction between different types of FDI.
Finally, future research may attempt to provide an integrated
113. account of
several transmission mechanisms between gender disparity and
growth. An
A R T I C L E S
80
important step in this direction would be to simultaneously
account for
FDI and trade-related effects. These two transmission
mechanisms may
well work in opposite directions. This might be the case, for
instance, if
wage inequality strengthened comparative advantage in labor-
intensive
exports of developing countries (as found in the trade paper of
Busse
and Spielmann 2006) but no longer attracted FDI. The tendency
of
multinational companies to contract out unskilled, labor-
intensive work to
local firms, and to purchase inputs from them, could explain
why
wage inequality promoted trade, while leaving FDI unaffected
or even
reducing it.
On the other hand, both transmission mechanisms may reinforce
each
other. This possibility arises from the above finding that less
gender
disparity in education induces more FDI, in combination with
the earlier
114. finding of Busse and Spielmann (2006) that less gender
disparity in
education is positively associated with comparative advantage
in labor-
intensive exports. From a gender perspective, the equity and
fairness
implications of such a scenario would still remain unresolved. It
would have
to be assessed whether and to what extent wage discrimination
is
underlying the positive export and FDI effects of less gender
disparity in
education. In other words, overcoming gender disparity in
education and
reaping any ensuing trade and FDI benefits may come at the
cost of
violating other dimensions of gender equity, such as wage
equity.
Matthias Busse, Hamburg Institute of International Economics
(HWWI)
Heimhuder Str. 71, Hamburg, 20148, Germany
e-mail: [email protected]
Peter Nunnenkamp, Kiel Institute for the World Economy,
Duesternbrooker Weg 120, Kiel, 24100, Germany
e-mail: [email protected]
N O T E S
1 By contrast, Günseli Berik, Yana van der Meulen Rodgers,
and Joseph E. Zveglich
(2004) consider openness to trade to be a determinant of gender
wage gaps, finding
that trade openness is inversely related to women’s relative
wages in South Korean
115. and Taiwanese industries.
2 Avik Chakrabarti (2001) subjects the findings of various
studies on FDI determinants
to extreme bounds analysis and concludes that few determinants
are robust to minor
changes in sample selection and the specification of the test
equation.
3 Restricting the sample to developing host countries is in line
with Bruce A. Blonigen
and Miao Grace Wang (2005), who argue strongly against
pooling rich and poor
countries in empirical FDI studies. Later in this paper, we will
further differentiate
between low- and medium-income countries within the fairly
heterogeneous group of
developing countries.
G E N D E R D I S P A R I T Y A N D F D I
81
4 Overall, the available evidence seems to be in conflict with
the hypothesis
that exploiting low social standards and repressed worker rights
represents an
important motivation of FDI. The survey of Drusilla K. Brown
(2000) concludes
that poor labor practices did not attract FDI; recent studies
include Phillipp Harms
and Heinrich W. Ursprung (2002), David Kucera (2002), and
Matthias Busse (2003,
2004).
116. 5 Footloose industries are not tied to any location but tend to
move from country to
country following government incentives and/or low wages.
6 The point made by Shatz (2003) and Matthias Busse, Jens
Königer, and Peter
Nunnenkamp (2008) about sample selection (see below)
suggests a further twist to
this debate. While multinational companies may shy away from
countries that do not
pass a basic threshold in terms of social standards and gender
equality, companies
may exploit cost advantages once this threshold is passed.
7 As noted by Kucera (2002), labor costs tend to decline when
some groups of workers
are paid less than others for similarly productive work due to
discrimination.
8 Moreover, Remco H. Oostendorp (2004) stresses the
heterogeneous format of
available wage data.
9 Oostendorp (2004) provides a major exception.
10 Note that Shatz (2003) argues against panel analyses on
education-related
determinants of FDI, as he suspects variation over time to be
marginal.
11 See Assaf Razin and Efraim Sadka (2007) for an overview of
the relevant literature.
12 As Shatz notes: ‘‘national statistical agencies publish
bilateral data about the
investment activities of their multinationals only for host
117. countries that have sizeable
inflows of FDI. This means that nearly all research on foreign
direct investment
focuses on the winners, countries that have achieved at least
some success in attracting
FDI. This is a major problem since policy advice is most often
sought by the countries
that are excluded from analysis’’ (2003: 118).
13 By replicating the regressions for specific sub-groups of
countries, we assess the
sensitivity of results with respect to sample selection, while the
extreme bounds
analysis of Chakrabarti (2001) is particularly suited to assess
the sensitivity of results
with respect to variable selection.
14 See Eric Neumayer (2002) for a more detailed discussion of
alternative approaches.
15 We divert from the model by Carr, Markusen, and Maskus
(2001) in that we use
additional control variables. We do not include the interactive
terms used by them.
16 A Hausman test showed that there is no clear preference for
the random- or fixed-
effects model. Depending on the dependent variable or host
country sample, we
prefer either a random- or a fixed-effects model.
17 Note that bilateral FDI flows take negative values if the
source country divests in a
particular host country (for example, through selling its equity
share to local firms
and transferring the proceeds back home). We keep negative
118. values with respect to
FDI1. However, the results for FDI1 hardly change if we
exclude negative values. By
contrast, negative bilateral flows are set equal to zero when
calculating the share
variable FDI2. This helps us include as many observations as
possible, while avoiding
the somewhat odd notion of negative FDI shares.
18 In contrast to M&As, greenfield FDI creates new or
additional assets.
19 While a standard Durbin-Watson test showed that we do not
necessarily have (first-
order serial) correlation in the regressions, we cannot reject the
hypothesis of no
correlation either. In fact, the evidence is inconclusive.
20 The growth rate of GDP may suffer from endogeneity, as
FDI inflows could have an
impact on it. In the present context, however, we are not
particularly interested in an
unbiased estimate of the coefficient on GDP growth. Crucially,
any bias in this respect
is unlikely to affect the coefficient on our educational
indicators – that is, the main
interest of the present empirical analysis.
A R T I C L E S
82
21 The data have principally been taken from Robert J. Barro
and Jong-Wha Lee (2001).
119. We extended their dataset with more recent figures from United
Nations Education,
Scientific, and Cultural Organization (UNESCO 2007) to ensure
that we can run a
panel analysis up to the year 2004. We also performed
estimations with average years
of schooling for the age group of 15 and above. Unreported
results proved very
similar to those reported below. The results for the age group of
25 and above may be
more reliable, however. This is because average years of
schooling for this age group
would hardly be affected, even if FDI flows had an impact on
the educational
attainment of younger cohorts. We owe the point that
endogeneity problems may be
mitigated in this way to the guest editors of this volume.
22 FDI flows to financial offshore centers can hardly be
explained in the context of a
gravity model that does not capture tax-related motivations of
FDI; including financial
offshore centers may thus lead to biased estimation results. We
exclude all countries
that are on the list of offshore financial centers as reported by
Eurostat (2005). For a
discussion on tax-induced distortions in international capital
flows, see Organisation
for Economic Co-operation and Development (OECD 2000).
23 Since we use the 2005 World Bank definition for the
distinction between developing
und developed countries, economies like Taiwan and the
Republic of Korea fall into
the latter category. While this has not been the case for the
entire 1978–2004 period,
120. our results do not change much if both countries are treated as
developing countries.
24 Obviously, greater openness to trade encourages trade in
finished goods, too. In
contrast to trade in intermediates, however, the effect of more
trade in final goods on
FDI flows tends to be ambiguous. This is because the removal
of trade barriers for
finished goods reduces the incentive to undertake FDI of the
‘‘tariff jumping’’ kind to
penetrate protected host-country markets.
25 The results for the remaining variables do not change much
if inflation and other
insignificant variables are excluded from the analysis. Yet, we
include them as they
could have an impact on FDI from a theoretical point of view.
26 Note that the mean of 1.06 for FDI1, reported in the
Appendix, has to be changed
using the reversed transformation equation (3), which results in
1.27. The 2.5 percent
increase in the dependent variable then results from the product
of -0.128 and -0.25
divided by 1.27.
27 Obviously, it would be desirable to control for the wages of
skilled and unskilled labor
in our estimations. However, the data situation does not allow
us to do so.
28 The results for the control variables are essentially
unchanged. Therefore, they are
not discussed here in any detail.
121. 29 Another reason for different results is that Shatz (2003)
performs a pure cross-country
analysis, whereas our findings are based on a panel analysis.
30 Complete results are available from the authors upon
request.
31 See Gaute Ellingsen, Winfried Likumahuwa, and Peter
Nunnenkamp (2006) for a
recent analysis of the case of Singapore in this context.
32 Probably, the same applies to resource-seeking FDI
undertaken by developing source
countries such as China in low-income regions, notably in
Africa.
33 See, for example, the extensive survey of the relevant
literature by Robert E. Lipsey (2002).
R E F E R E N C E S
Barro, Robert J. and Jong-Wha Lee. 2001. ‘‘International Data
on Education Attainment:
Updates and Implications.’’ Oxford Economic Papers 53(3):
541–63.
Berik, Günseli, Yana van der Meulen Rodgers, and Joseph E.
Zveglich. 2004.
‘‘International Trade and Gender Wage Discrimination:
Evidence from East Asia.’’
Review of Development Economics 8(2): 237–54.
G E N D E R D I S P A R I T Y A N D F D I
83
122. Blonigen, Bruce A. and Miao Grace Wang. 2005.
‘‘Inappropriate Pooling of Wealthy
and Poor Countries in Empirical FDI Studies,’’ in Theodore H.
Moran, Edward M.
Graham, and Magnus Blomström, eds. Does Foreign Direct
Investment Promote
Development? pp. 221–44. Washington, DC: Institute for
International Economics.
Borensztein, Eduardo, José De Gregorio, and Jong-Wha Lee.
1998. ‘‘How Does Foreign
Direct Investment Affect Economic Growth?’’ Journal of
International Economics 45(1):
115–35.
Braunstein, Elissa. 2002. ‘‘Gender, FDI and Women’s
Autonomy: A Research Note on
Empirical Analysis.’’ University of Massachusetts Amherst.
http://www.peri.umass.
edu/fileadmin/pdf/gls_conf/glw_braunstein.pdf (accessed April
2007).
———. 2006. ‘‘Foreign Direct Investment, Development and
Gender Equity: A Review of
Research and Policy.’’ Occasional Paper 12, United Nations
Research Institute for
Social Development, Geneva.
Brown, Drusilla K. 2000. ‘‘International Trade and Core Labour
Standards: A Survey
of the Recent Literature.’’ Occasional Paper 43, Organisation
for Economic Co-
operation and Development.
Busse, Matthias. 2003. ‘‘Do Transnational Corporations Care
123. About Labour Standards?’’
Journal of Developing Areas 36(2): 49–68.
———. 2004. ‘‘Transnational Corporations and Repression of
Political Rights and Civil
Liberties: An Empirical Analysis.’’ Kyklos 57(1): 45–66.
Busse, Matthias and Christian Spielmann. 2006. ‘‘Gender
Inequality and Trade.’’ Review
of International Economics 14(3): 362–79.
Busse, Matthias, Jens Königer, and Peter Nunnenkamp. 2008.
‘‘FDI Promotion through
Bilateral Investment Treaties: More Than a Bit?’’ Kiel Working
Paper 1403, Kiel
Institute for the World Economy.
Carkovic, Maria and Ross Levine. 2005. ‘‘Does Foreign Direct
Investment Accelerate
Economic Growth?’’ in Theodore H. Moran, Edward M.
Graham, and Magnus
Blomström, eds. Does Foreign Direct Investment Promote
Development? pp. 195–220.
Washington, DC: Institute for International Economics.
Carr, David L., James R. Markusen, and Keith E. Maskus. 2001.
‘‘Estimating the
Knowledge-Capital Model of the Multinational Enterprise.’’
American Economic Review
91(3): 693–708.
Chakrabarti, Avik. 2001. ‘‘The Determinants of Foreign Direct
Investment: Sensitivity
Analyses of Cross-country Regressions.’’ Kyklos 54(1): 89–
113.
124. Chinn, Menzie D. and Hiro Ito. 2005. ‘‘What Matters for
Financial Development? Capital
Controls, Institutions, and Interactions.’’ Working Paper 11370,
National Bureau of
Economic Research, Cambridge, MA.
Deardorff, Alan V. 1998. ‘‘Determinants of Bilateral Trade:
Does Gravity Work in a Neo-
classical World,’’ in Jeffrey A. Frankel, ed. Regionalization in
the World Economy, pp. 7–22.
Chicago: University of Chicago Press.
Dollar, David and Art Kraay. 2007. Institutions, Trade and
Growth Database. http://
eron.worldbank.org/WBSITE/EXTERNAL/EXTDEC/O,,Content
MDK:20311740_page
PK:64165401*piPK:64165026*thesitePK:469372,00.html
(accessed April 2007).
Drèze, Jean and Amartya Sen. 1989. Hunger and Public Action.
Oxford: Oxford University
Press.
Eaton, Jonathan and Akiko Tamura. 1996. ‘‘Japanese and U.S.
Exports and Investment as
Conduits of Growth,’’ in Takatoshi Ito and Anne O. Krueger,
eds. Financial Deregulation
and Integration in East Asia, pp. 51–75. Chicago: University of
Chicago Press.
Ellingsen, Gaute, Winfried Likumahuwa, and Peter
Nunnenkamp. 2006. ‘‘Outward FDI
by Singapore: A Different Animal?’’ Transnational
Corporations 15(2): 1–40.
Eurostat. 2005. European Union Foreign Direct Investment
125. Yearbook 2005. Luxembourg:
European Communities.
A R T I C L E S
84
http://www.peri.umass.edu/fileadmin/pdf/gls_conf/glw_braunste
in.pdf
http://www.peri.umass.edu/fileadmin/pdf/gls_conf/glw_braunste
in.pdf
http://www.unctad.org/Templates/StartPage.asp?intItemID=292
1&lang=1
http://www.unctad.org/Templates/StartPage.asp?intItemID=292
1&lang=1
http://www.unctad.org/Templates/StartPage.asp?intItemID=292
1&lang=1
Gastanaga, Victor M., Jeffrey B. Nugent, and Bistra Pashamova.
1998. ‘‘Host Country
Reforms and FDI Inflows: How Much Difference Do They
Make?’’ World Development
26(7): 1299–314.
Harms, Phillipp and Heinrich W. Ursprung. 2002. ‘‘Do Civil
and Political Repression
Really Boost Foreign Direct Investment?’’ Economic Inquiry
40(4): 651–63.
Henisz, Witold J. 2000. ‘‘The Institutional Environment for
Multinational Investment.’’
Journal of Law, Economics, and Organization 16(2): 334–64.
———. 2007. The Political Constraint Index (POLCON)
Dataset. http://www-management.
126. wharton.upenn.edu/henisz/ (accessed January 2007).
Klasen, Stephan. 2002. ‘‘Low Schooling for Girls, Slower
Growth for All? Cross-Country
Evidence on the Effect of Gender Inequality in Education on
Economic Develop-
ment.’’ World Bank Economic Review 16(3): 345–73.
Kucera, David. 2002. ‘‘Core Labour Standards and Foreign
Direct Investment.’’
International Labour Review 141(1–2): 31–68.
Lee, Jeong-Yeon and Edwin Mansfield. 1996. ‘‘Intellectual
Property Protection and U.S.
Foreign Direct Investment.’’ Review of Economics and
Statistics 78(2): 181–6.
Lipsey, Robert E. 2002. ‘‘Home and Host Country Effects of
FDI.’’ Working Paper 9293,
National Bureau of Economic Research, Cambridge, MA.
Martin, Philippe and Hélène Rey. 2004. ‘‘Financial Super-
Markets: Size Matters for Asset
Trade.’’ Journal of International Economics 64(2): 335–61.
Mutti, John H. and Harry Grubert. 2004. ‘‘Empirical
Asymmetries in Foreign Direct
Investment and Taxation.’’ Journal of International Economics
62(2): 337–58.
Neumayer, Eric. 2002. ‘‘Is Good Governance Rewarded? A
Cross-National Analysis of
Debt Forgiveness.’’ World Development 30(6): 913–30.
Organisation for Economic Co-operation and Development
(OECD). 2000. ‘‘Towards
127. Global Tax Co-operation.’’ Report to the 2000 Ministerial
Council Meeting and
Recommendations by the Committee on Fiscal Affairs.
http://www.oecd.org/
dataoecd/9/61/2090192.pdf (accessed April 2008).
Oostendorp, Remco H. 2004. ‘‘Globalization and the Gender
Wage Gap.’’ Policy
Research Working Paper 3256, World Bank, Washington, DC.
Overseas Development Institute. 2002. ‘‘Foreign Direct
Investment: Who Gains?’’
Briefing Paper, Overseas Development Institute, London.
Portes, Richard and Hélène Rey. 2005. ‘‘The Determinants of
Cross-Border Equity
Flows.’’ Journal of International Economics 65(2): 269–96.
Pritchett, Lant and Lawrence H. Summers. 1996. ‘‘Wealthier is
Healthier.’’ Journal of
Human Resources 31(4): 841–68.
Razin, Assaf and Efraim Sadka. 2007. Foreign Direct
Investment: Analysis of Aggregated Flows.
Princeton: Princeton University Press.
Seguino, Stephanie. 1997. ‘‘Gender Wage Inequality and
Export-Led Growth in South
Korea.’’ Journal of Development Studies 34(2): 102–37.
———. 2000. ‘‘Gender Inequality and Economic Growth: A
Cross-Country Analysis.’’
World Development 28(7): 1211–30.
Shatz, Howard J. 2003. ‘‘Gravity, Education, and Economic
Development in a Multinational
128. Affiliate Location.’’ Journal of International Trade and
Economic Development 12(2): 117–50.
United Nations Conference on Trade and Development
(UNCTAD). 1998. World
Investment Report 1998: Trends and Determinants. New York:
United Nations.
———. 2004. World Investment Report 2004: The Shift
Towards Services. New York: United
Nations.
———. 2007a. Bilateral Investment Treaties (online database).
http://www.unctadxi.org/
templates/DocSearch_779.aspx (accessed April 2007).
———. 2007b. Foreign Direct Investment Statistics (online
database). http://www.unctad.
org/Templates/StartPage.asp?intItemID¼2921&lang¼1
(accessed April 2007).
G E N D E R D I S P A R I T Y A N D F D I
85
http://www-management.wharton.upenn.edu/henisz/
http://www.oecd.org/dataoecd/9/61/2090192.pdf
http://www.unctadxi.org/templates/DocSearch_779.aspx
http://www.unctad.org/Templates/StartPage.asp?intItemID=292
1&lang=1
http://www.unctad.org/Templates/StartPage.asp?intItemID=292
1&lang=1
http://www.unctad.org/Templates/StartPage.asp?intItemID=292
129. 1&lang=1
http://www.unctad.org/Templates/StartPage.asp?intItemID=292
1&lang=1
United Nations Education, Scientific, and Cultural Organization
(UNESCO). 2007.
UNESCO Institute for Statistics.
http://www.uis.unesco.org/ev_en.php?ID¼2867_201&
ID2¼DO_TOPIC (accessed April 2007).
Wei, Shang-Jin. 2000. ‘‘How Taxing is Corruption on
International Investors?’’ Review of
Economics and Statistics 82(1): 1–11.
World Bank. 2006. World Development Indicators 2006: Data
on CD-Rom. Washington, DC:
World Bank.
World Trade Organization (WTO). 2007. Regional Trade
Agreements. http://www.wto.org/
english/tratop_e/region_e/region_e.htm (accessed April 2007).
A R T I C L E S
86
http://www.uis.unesco.org/ev_en.php?ID=2867_201&ID2=DO=
TOPIC
http://www.uis.unesco.org/ev_en.php?ID=2867_201&ID2=DO=
TOPIC
http://www.uis.unesco.org/ev_en.php?ID=2867_201&ID2=DO=
TOPIC
http://www.uis.unesco.org/ev_en.php?ID=2867_201&ID2=DO=
TOPIC
http://www.wto.org/english/tratop_e/region_e/region_e.htm
201. d
U
N
E
S
C
O
(2
0
0
7
)
A R T I C L E S
88
Descriptive statistics
Source country sample
Argentina, Australia, Austria, Belgium-Luxembourg, Brazil,
Chile, Colombia, Denmark,
Finland, France, Germany, Iceland, Japan, Republic of Korea,
Malaysia, Mexico,
Netherlands, New Zealand, Portugal, Spain, Sweden,
Switzerland, Taiwan, Thailand,
Turkey, United Kingdom, United States, Venezuela
203. Tertiary education 9,743 0.22 0.06 0.01 0.84
Tertiary education
inequality
9,743 0.08 0.02 -0.17 0.37
G E N D E R D I S P A R I T Y A N D F D I
89
Host country sample
Albania, Algeria, Angola, Argentina, Bangladesh, Bolivia,
Botswana, Brazil, Bulgaria, Burkina
Faso, Cameroon, Chile, China, Colombia, Republic of Congo,
Costa Rica, Côte d’Ivoire, Croatia,
Dominican Republic, Ecuador, Egypt, El Salvador, Estonia,
Ethiopia, Gambia, Ghana,
Guatemala, Guyana, Haiti, Honduras, Hungary, India,
Indonesia, Jordan, Kazakhstan,
Kenya, Latvia, Lithuania, Malaysia, Mali, Mauritius, Mexico,
Mongolia, Mozambique,
Namibia, Nicaragua, Niger, Nigeria, Oman, Pakistan, Papua
New Guinea, Paraguay, Peru,
Philippines, Poland, Romania, Russian Federation, Saudi
Arabia, Senegal, Slovenia, Sri Lanka,
Sudan, Swaziland, Syrian Arab Republic, Tanzania, Thailand,
Togo, Trinidad and Tobago,
Tunisia, Turkey, Uganda, Ukraine, Uruguay, Venezuela,
Vietnam, Zambia, Zimbabwe
A R T I C L E S
204. 90
Stronger Database Security Needed, Cyber-Attacks Show
http://www.cioinsight.com/print/c/a/Latest-News/CyberAttacks-
Highlight-Need-to-Focus-on-Stronger-Database-Security-
342260[2/2/2017 9:31:02 AM]
Stronger Database Security Needed, Cyber-Attacks Show
By CIOinsight | Posted 06-03-2011
When cyber-attackers breach an organization's network, the
database is usually their target. However, many organizations
are so focused on protecting the perimeter that they don't think
abo
protecting the database itself, according to several security
experts.
Many organizations still think that protecting the perimeter is
sufficient to protect the data, but as recent data breaches at
Epsilon and Sony have shown, traditional perimeter security
can't
relied on to protect the data, Josh Shaul, CTO of Application
Security, told eWEEK. It's a "losing battle" to try to protect
every single endpoint within the organization, Shaul said.
That's not to suggest that organizations shouldn't be investing in
firewalls and other security products. Shaul recommended the
layered model, where attackers have to get past multip
gatekeepers before they even get to the database. Organizations
should be thinking, "When the perimeter fails, what's next?" and
combining all the layers to pinpoint when something is wron
according to Shaul.
205. It's ironic that "the closer we get to the data, we see fewer
preventive controls and more detection measures," Shaul said.
IT departments are more likely to have deployed products that
send o
alerts that a breach has occurred, than ones that actively block
the threat from getting in to the database. Most blocking
technologies are still deployed on the perimeter, according
Shaul.
Organizations still assume that all activity hitting the database
is "untrusted," Shaul said. Instead, they should monitor all
requests to figure out whether the activity is normal or
malicious.
Continuous, real-time monitoring is crucial to detect suspicious
or unauthorized activity within the database, Phil Neray, vice
president of data security strategy and information management
IBM, told eWEEK. Database activity monitoring allows security
managers to catch anyone who is trying to get access to
information they shouldn't be able to obtain.
To read the original eWeek article, click here: Cyber-Attacks
Highlight Need to Focus on Stronger Database Security.
http://www.cioinsight.com/c/a/Security/Epsilon-Data-Breach-
Hits-Banks-Retail-Giants-154971/
http://www.cioinsight.com/c/a/Security/Sony-Networks-Lacked-
Firewall-Ran-Obsolete-Software-Testimony-103450/
http://www.eweek.com/c/a/Security/CyberAttacks-Highlight-
Need-to-Focus-on-Stronger-Database-Security-
342260/cioinsight.comStronger Database Security Needed,
Cyber-Attacks Show