Download to read offline

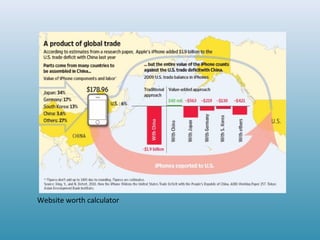

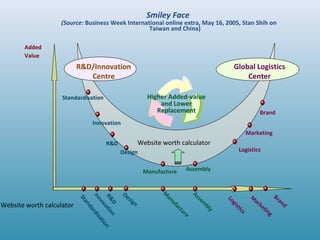

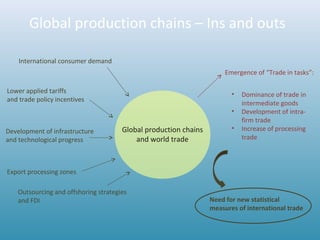
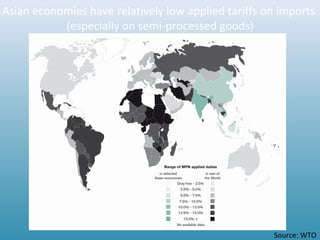
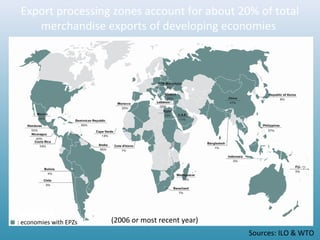
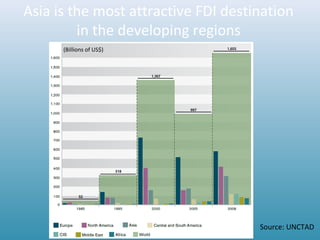
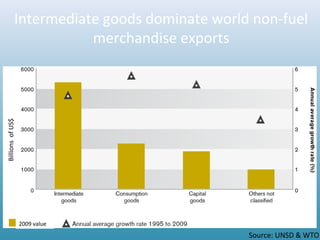
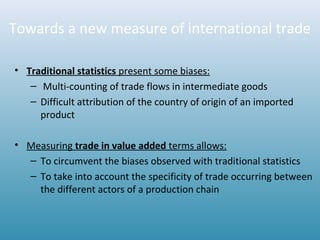
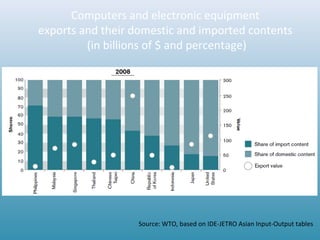
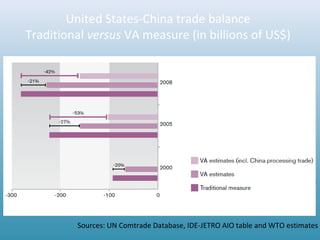
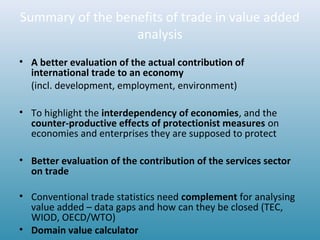


The document discusses the transformation of global trade from goods to tasks, emphasizing the role of value chains, particularly in Asia, which dominates intermediate goods exports. It highlights the challenges of traditional trade statistics and advocates for measuring trade in value-added terms to better understand the economic impacts and interdependencies of global trade. Additionally, it outlines how export processing zones contribute significantly to merchandise exports and the importance of innovations and branding in enhancing value captured in global supply chains.


