This document summarizes SN-Reach sharing metrics from August 12 to September 12. It shows that the total audience reach was 100 people, comprised of 85 starters who clicked branded share buttons and 15 responders who were invited by starters. The viral lift was 18%, meaning responders were 18% of the total audience. Engagement lift was 21%, indicating responders who took action were 21% higher than starters. Demographic data on the audience is also provided.
Linkedin Analytics Week 11 MKT 9715 baruch mba program Prof Marshall SponderMarshall Sponder
This LinkedIn Analytics presentation is part of my MBA class at Baruch College that I teach on Monday nights -- MKT 9715 - I will also be teaching the undergrad class next semester as well as the graduate class.
Merging Geo Social Data & web analytics at the Metropolitan Museum of ARTMarshall Sponder
Using public data and platforms such as Geofeedia (to mine the public Instagram and Twitter postings at the Metropolitan Museum of Art), together with StatSocial (a tool for Twitter Follower Analysis) I was able to come up with a very unique approach to Analytics and Storytelling for the MET.
As I'm a sustaining member of the Metropolitan Museum of Art, I really love the museum, its my favorite place, and also a place of RESEARCH.
Social media
Moderator: Stephen Davies, Founder & Managing Director of 3WPR, blogger at stedavies.com, UK
14.30-15.30
· Integrating SM internally
Philippe Borremans, Chief Social Media Officer at Van Marcke Group, Belgium:
- "ROI of SM for internal comms: How organizations should apply collaborative and interactive social media tools to enhance productivity and communication?"
· SM into existing PR campaigns
Kerry Bridge, Global Digital Media Communications Manager at DELL Public Sector, UK:
- "Integrating Social Media into existing PR campaigns."
· Multinational SM campaigns
Marshall Sponder, SM Metrics, Web Analytics, and SEO expert, owner of webmetricsguru.com, USA:
- "How can multinational organizations create a social media campaign to target a number of markets?"
Social media analytics for the pr industry Mexico City 5-24-12Marshall Sponder
Here's my presentation to a conference that happened in Mexico City this week. I don't have the url of the conference but I was asked to pre-record it (which is up on my blog and in YouTube). Here's the deck by itself.
III Colóquio internacional sobre literatura brasileira contemporâneaLaeticia Jensen Eble
III Colóquio internacional sobre literatura brasileira contemporânea: percursos, cruzamentos e interseções
Brasil – Estados Unidos
Washington, 14 e 15 de abril de 2014
Digital marketing analytics paths of value - 12-4-17Marshall Sponder
Digital Marketing Analytics Paths of Value is an adaption of many of the highlights of my book along with the Connecting the Dots methodology used in the book, and that sets it apart.
This is a presentation for The Global Big Data Conference where I am focusing on how creative people can leverage algorithms and Big Data without having it take over their entire lives.
My presentation is on the afternoon of October 23rd, 2017 and I am publishing the deck a few days earlier than that. This presentation also coincides with the publication of the Digital Analytics for Marketing (Sponder/Khan) textbook that is now available (Routledge, 2018) online and in bookstores.
What went right or wrong on election day - Nov 8th, 2016 USAMarshall Sponder
I created this lecture for my Baruch and Rutgers classes but figured it really ought to be online. While preparing this deck, noticed the cathectic emotion, even though it is impossible to capture everything that has happened.
Here is my presentation to the Design Bloggers Conference that is taking place in Atlanta, GA on Feb 25th - 27th, 2015.
I was originally going to present this in person but it will be delivered remotely as a last minute circumstance arose that made it necessary for me to postpone attending.
Scaling online and hybrid training rutgers university 1-14-15 submittedMarshall Sponder
Presenting this deck at the Online and Hybrid Learning Conference (January 14 and 15, 2015) at NJIT and Rutgers.
My presentation in on Wednesday afternoon, January 14th, https://onlinelearning.rutgers.edu/ruonline2015/scaling-online-and-hybrid-courses-effective-design-and-rubrics
Analytics for Musicians - Presentation to Chamber Music America - December 2n...Marshall Sponder
This presentation covers the kind of data that can be collected and how it might be used to promote the local and online following of Classical and Jazz Musicians.
In particular, we take a tour of some of the more exotic enhancements in Google Analytics combined with Geo-Location that I have become found of lately.
The work in this course also draws on the work I do at Baruch College Zicklin School of Business, where I am a Lecturer Faculty - much of the work I present has been informed by students who helped to pull the data around certain of the slides.
Finally, the need to develop the assessments also draws upon the Rutgers University Social Media for the Arts.
This deck does a nice job of blending the thinking behind the teachings I've done in both places, and is a true synthesis.
Integrating social media monitoring, analytics and engagment marshall sponde...
Webmetrics 9.13.10
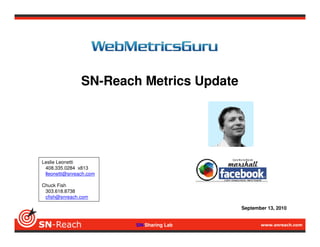
1. SN-Reach Metrics Update
Leslie Leonetti
408.335.0284 x813
lleonetti@snreach.com
Chuck Fish
303.618.8738
cfish@snreach.com
September 13, 2010
SN-Sharing Lab
2. Sharing: Terminology
Starter SN-Reach Multiplier Page
Your Home Page
Sends to
5 friends
Responders
Starter
= generates a Responder
Branded Share Button 1
SN-Sharing Lab
3. Multiply per button (button clicks)
Sharing Starters Responders V-Lift
Performance Reach (= total audience button clicks ) 100
website 51 14 27%
Time period: Viral Lift (= # Responders / # Starters) 18% email 20 1 5%
8/12/10 thru 9/12/10 twitter 14 — —
Engagement Lift 21% Total 85 15 18%
>> NOTES: This shows the sharing
performance, in a specific time
period.
The total audience is made up of:
a) “Starters” who the client touched via
branded share buttons (see list)
-and-
b) “Responders” who acted on an invite
from a friend.
Reach = # Starters + # Responders
Viral Lift = how many new viewers were
generated as a result of invites sent to
them. It is expressed as a growth %.
In this example: 85 Starters arrived from
share buttons, and 15 Responders
arrived from invites —
(Total = 100) 15 / 85 = 18% growth
Engagement Lift=
# Responder Clicks / # Starter Clicks
SN-Sharing Lab
4. Total Audience, by Start Point button
Demographics button clicks LP clicks
clicks LP clicks
Australia 3 3
website 65 25
Time period: Belgium 2 2
email 21 1
8/12/10 thru 9/12/10 twitter 14 8
Canada 7 4
Great Britain 1 —
Total 100 34
Germany 2 1
California 3 1
Colorado 9 5
New York 20 1
Oregon 1 1
Rhode Island 2 —
Subtotal 50 18
----------------------------------------------------------------------------------------------------------
NA 50 16
Work with me Total 100 34
White Paper
8/2, 25% button
20 starter clicks clicks LP clicks
3 responder clicks Male
31 – 40 3 3
15% engagement lift NA 40 13
Subtotal – Male 43 16
Female
31 – 40 — —
NA 23 1
Subtotal – Female 23 1
NA 34 17
Total 100 34
SN-Sharing Lab