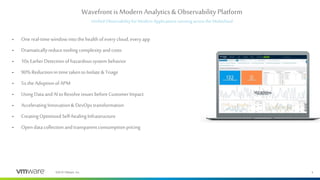
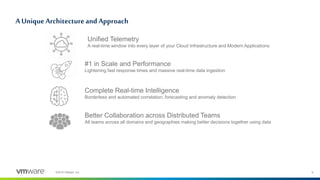
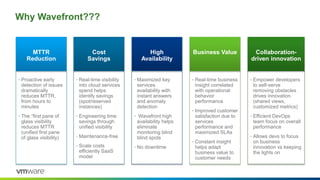
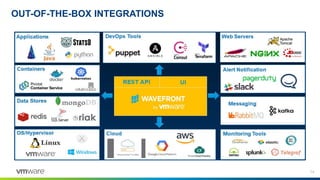
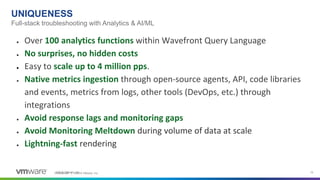
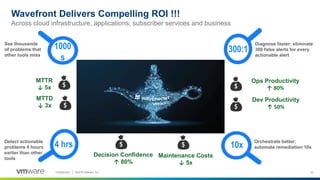
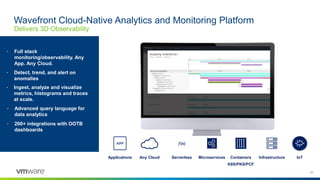
© 2017, Wavefront. All rights reserved. Wavefront Confidential.
Move Fast,
See Everything.
Stable Infrastructure
Anil Gupta, vExpert
Wavefront Lead – APJ
@legraswindow
guptaanil@vmware.com
© 2017, Wavefront. All rights reserved. Wavefront Confidential.© 2017, Wavefront. All rights reserved. Wavefront Confidential.
• Why Wavefront?
• What’s Wavefront with features and functionalities
• Use Cases
• Customer Success Stories
Agenda
3©2018 VMware, Inc.
CMP as licensed software (vRealize)
Cloud
Assembly
Service
Catalog
Code
Stream
Application
Discovery
Log
Intelligence
Wavefront Network
Insight
CMP as a Service (VMware Cloud Services)
Hybrid Cloud Public Cloud
CONTAINERSVIRTUAL MACHINES KUBERNETESVM
Cloud
Health
Self-Driving
Operations
Programmable
Provisioning
Application
Operations
Cloud
Health
Cloud
Assembly
Service
Broker
Code
Stream
Wavefront
Log
Intelligence
Network
Insight
vRealize
Code Stream
2.4.1
vRealize
Network Insight
4.0
vRealize
Operations
7.0
vRealize
Log Insight
4.7
VMware
Integrated
OpenStack
5.0
vRealize
Automation
7.5
vRealize
Lifecycle
Manager
2.0
vRealize
Business
for Cloud
7.5
Cloud Management Platform
Consistent Developer Experience
One-stop solution that underpins “Cloud Center of Excellence”
VMWARE PUBLIC CLOUD MANAGEMENT SOLUTION
4©2018 VMware, Inc.
Wavefront is Modern Analytics& Observability Platform
Unified Observability for ModernApplications runningacross the Multicloud
• One real-timewindowintothe healthofevery cloud, every app
• Dramaticallyreducetooling complexityandcosts
• 10xEarlierDetectionofhazardoussystem behavior
• 90%Reductionin time takentoIsolate &Triage
• 5xthe AdoptionofAPM
• Using DataandAI toResolveissues beforeCustomerImpact
• Accelerating Innovation& DevOpstransformation
• CreatingOptimizedSelf-healingInfrastructure
• Open datacollection andtransparentconsumptionpricing
Borderless troubleshooting across all dataMetrics
Traces
EventsLog Data
DetectEarlier
IsolateFaster
TriageTogether
Auto-Remediate
Creating a Cycle of Continuous Improvement
Leveraging Data, Analyticsand AIto drive World-Class Cloud Operations
Confidential │ ©2018 VMware,Inc.
Built for the Enterprise
Effective Collaboration and SmarterDecisions
Automation<API>
High Fidelity Universal AlertEngine
6©2018 VMware, Inc.
The Wavefront Difference
A Unique Architecture and Approach
#1 in Scale and Performance
Lightening fast response times and massive real-time data ingestion
Customer data rates of 130 Billion metrics per day. Unlimited Metric Cardinality.
Complete Real-time Intelligence
Borderless and automated correlation, forecasting and anomaly detection
Automatically finding answers buried in millions of data points
Better Collaboration across Distributed Teams
All teams across all domains and geographies making better decisions together using data
1,000s of engineers across 100s of teams actively collaborating in one venue
Unified Telemetry
A real-time window into every layer of your Cloud Infrastructure and Modern Applications
Compute, Network, Storage, OS, Middleware, Application telemetry in context. 200+ Integrations.
Why Wavefront???
8
• Proactive early
detection of issues
dramatically
reduces MTTR,
from hours to
minutes
• The “first pane of
glass visibility
reduces MTTR
(unified first pane
of glass visibility)
• Real-time visibility
into cloud services
spend helps
identify savings
(spot/reserved
instances)
• Engineering time
savings through
unified visibility
• Maintenance-free
• Scale costs
efficiently SaaS
model
• Maximized key
services
availability with
instant answers
and anomaly
detection
• Wavefront high
availability helps
eliminate
monitoring blind
blind spots
• No downtime
• Real-time business
insight correlated
with operational
behavior
performance
• Improved customer
satisfaction due to
services
performance and
maximized SLAs
• Constant insight
helps adapt
business value to
customer needs
• Empower developers
to self-serve
removing obstacles
drives innovation
(shared views,
customized metrics)
• Efficient DevOps
team focus on overall
performance
• Allows devs to focus
on business
innovation vs keeping
the lights on
MTTR
Reduction
Cost
Savings
High
Availability
Business Value Collaboration-
driven innovation
10©2018 VMware, Inc.
WF primarily collects time series metrics data:
• Anything being measured overtime (time
series data; business, host, app)
• Time series data is easily understood
(visually) and helps to quickly identify
patterns
Time Series Data Collection Example
Single platform with metrics, traces and histograms - the first pane of glass
CUSTOMERS NEED NEW OPS TOOLING
Monitoring Silos
Hard to triage, correlate,
collaborate, maintain
EASY to triage,
correlate, collaborate,
maintain
11Confidential │ ©2018 VMware, Inc.
Modern Monitoring Ecosystem: Metrics Is At The Forefront
Metrics Sit on Top of a Modern Observability Stack – the first place to look…
Metrics
Aggregable
Metrics are simple. Ease to
analyze at speed, store at
scale
Metrics provide real-time
visibility into performance
and health, system-wide
METRICS
in-flights, designed for
pilots
APM
for ground staff,
not pilots
LOGS
for crash investigators
See system-wide
with metrics, than
drill-down deeper
with traces and
logs.
Complements Metrics:
Logs contain all the
excruciating detail and
the kitchen sink
Complements Metrics:
APM uniquely does
automatic transaction
tracing for Gen2
Stacks
12©2018 VMware, Inc.
 Dynamically filter noise and capture true anomalies.
 Reduce Alert Sprawl & raise Alert Quality by
consolidating metrics
 Collaborate across teams by integrating Wavefront
alerts to DevOps
 Correlate Alerts and Events like deployment activities
DETECT YOUR PROBLEMS
 Ingest millions of metric data points per second
 Monitor over 100,000 containers in real-time
 Deliver metrics-as-a-service to 1000s of users across
Ops, Dev and Biz
 Provide richer data by maintaining full fidelity with no
down-sampling over 18 months.
 See the Real-Time impact of Code in Production
 Run your systems with tighter Margins
 Improve capacity forecasting & plan for future
changes with AI Genie Automation
 Real-Time Interactive Charts for Your First Pane of
Glass
 Find Root Causes Quickly with Unified Insights and
Easy Drill-Downs
 Use Unified Views Across Teams for Accelerated
Code Delivery
 Full OpenTracing/OpenCensus Compliance
RESOLVE INCIDENTS FASTER
OPTIMIZE PERFORMANCE REAL-TIME INTERACTIVE CHARTS
Features & Functionalities
Four Easy Ways of Sending Metrics into Wavefront
13
1. Wavefront
Agents
2. Metrics
Library/Application
Code
4. Logs via TCP
or via Filebeat
3. Directly from AWS,GCP
Pivotal Cloud Foundry
Wavefront
Proxy
14
OUT-OF-THE-BOX INTEGRATIONS
Confidential │ ©2019 VMware, Inc. 15©2018 VMware, Inc.
● Over 100 analytics functions within Wavefront Query Language
● No surprises, no hidden costs
● Easy to scale up to 4 million pps.
● Native metrics ingestion through open-source agents, API, code libraries
and events, metrics from logs, other tools (DevOps, etc.) through
integrations
● Avoid response lags and monitoring gaps
● Avoid Monitoring Meltdown during volume of data at scale
● Lightning-fast rendering
Full-stack troubleshooting with Analytics & AI/ML
UNIQUENESS
16Confidential │ ©2018 VMware, Inc.
1000
s
4 hrs
300:1
10x
See thousands
of problems that
other tools miss
Detect actionable
problems 4 hours
earlier than other
tools
Diagnose faster: eliminate
300 false alerts for every
actionable alert
Orchestrate better:
automate remediation 10x
METRICS DATA
HUB
MTTD
↓ 3x
MTTR
↓ 5x
Ops Productivity
↑ 80%
Decision Confidence
↑ 80%
Maintenance Costs
↓ 5x
Dev Productivity
↑ 50%
Across cloud infrastructure, applications, subscriber services and business
Wavefront Delivers Compelling ROI !!!
18Confidential │ ©2018 VMware, Inc.
Many Use cases = One Solution
Analytics lends itself to more…but let’s start from common ones
The First Pane
of Glass
Kubernetes &
Containerized
Applications
Monitoring
Microservices
Observability
CI/CD Pipeline
Monitoring
Public Cloud
Monitoring
Confidential │ ©2019 VMware, Inc. 19
Use Case: The First Pane of Glass - FPOG
“When there is an issue everyone is on webex sharing 15+ tools for hours”
 Aggregation of data/metrics from
multiple sources
 Simple correlation analysis to ID
events and possible causal areas
 Prove innocence, get to the last mile
in 2 minutes – hence FPOG
APM
Cloud
Selected**
“Logs/
Events”
Infrastructure
Aggregate!
Analyze!
Act!
Wavefront Becomes The Master
Aggregator of Metrics
Business KPI
20©2018 VMware, Inc.
Wavefront Cloud-Native Analytics and Monitoring Platform
Delivers 3D Observability
𝑓(x)
ServerlessApplications InfrastructureMicroservicesAny Cloud IoTContainers
K8S/PKS/PCF
• Full stack
monitoring/observability. Any
App. Any Cloud.
• Detect, trend, and alert on
anomalies
• Ingest, analyze and visualize
metrics, histograms and traces
at scale.
• Advanced query language for
data analytics
• 200+ integrations with OOTB
dashboards
Confidential │ ©2019 VMware, Inc. 21
Use Case: VMware Enterprise PKS + Wavefront = Happy Meal
21
Develop Containerized Services,
Leave the Heavy Lifting to Us
Full stack monitoring – Kubernetes health,
containerized application/microservices, cloud
infrastructure
Unified visibility for developers and Kubernetes
operators reduces MTTR
Up to speed in minutes - Integrated with PKS, 60
OOB K8S dashboards, packaged alerting
Helps Scale K8S Reliably
Happy Meal in 4 Clicks
Better Together - Wavefront and PKS
Kubernetes
Health
Monitoring
Resource
Consumption
Programmatic
Alerting
Containerized
Application
Visibility
Future proof. Bring Devs and PKS admins together. Offer Wavefront on Day 1.
Confidential │ ©2019 VMware, Inc. 23Confidential │ ©2018 VMware, Inc.
• OOB dashboards
• Visualize Kubernetes performance metrics from K8s at any scale,
including nodes, pods, cluster, down to individual container
performance metrics, also critical events such as behavioral errors.
• Node metrics: Average memory, file system, CPU, and storage utilization
• Namespace metrics: Memory usage by namespace, various counts
(containers, pods)
• Pod metrics: CPU usage rate, bytes transferred and received rate
• Container metrics: Uptime by container, CPU, memory and file system
usage, memory faults too
K8s & Containerized Applications + Wavefront
Operationalize your container platform
• Blog: https://www.wavefront.com/pks-wavefront-analytics/
Develop on Containerized Services,
Leave the Heavy Lifting to Us
24Confidential │ ©2018 VMware, Inc.
Use Case: Microservices Monitoring
TROUBLESHOOT FASTER
OPTIMIZE APPLICATION
PERFORMANCE
• Out-of-the-box visibility
• OpenTracing/OpenCensus
compliant
• Jaeger/Zipkin drop-in
replacement
EASILY MONITOR
MICROSERVICES
• Quickly pinpoint issues
• Easily find long/errored API
calls
• Troubleshoot errored API
responses
• Find performance
bottlenecks
• Query and narrow down
traces with long spans
• Find APIs that can be
optimized
Enhanced Application Observability
With Unified Metrics and Distributed Tracing
25Confidential │ ©2018 VMware, Inc.
Wavefront Eliminates Microservices Monitoring Pains
Lack of end-to-end request flow visibility across
services boundaries drives long MTTR
Scale limitation of open source DT solutions make
them unsuitable for production use-case
Different solutions for metrics and traces leads to
time wasted in context switching
Out-of-the-box, 3D observability with a scale tested
solution reduces context switching and MTTR
Long response time due to unoptimized services impacts
revenue and customer experience
Too much engineering time is spent in instrumenting and
maintaining DT solutions
Scale limitation of open source DT solutions make them
unsuitable for production use-case
Out-of-the-box, 3D observability with a scale tested
solution empowers developers to optimize performance
SREs/DevOps Team Developers
Pains
Gains
26Confidential │ ©2018 VMware, Inc.
Getting Started is Easy
Out-of-the-box support for metrics and traces
Include
SDK1
Write < 10
lines of
code
2
TRACES
27Confidential │ ©2018 VMware, Inc.
Wavefront Distributed Tracing Built-In Support
OpenTracing 2.0 compliant
Languages and Frameworks Third Party Instrumentation Service Mesh
X-RayJersey
Jaeger
AppMetrics
Confidential │ ©2019 VMware, Inc. CONFIDENTIAL 28
Confidential │ ©2019 VMware, Inc. 29
Use Case - Public Cloud Monitoring
Turn-key visibility across AWS, Azure and Google Cloud Platform
Azure App
Service
Azure Redis
Cache
Azure AD Azure Application
Gateway
Azure Container
Instances
Azure SQL
Database
Azure
Functions
Real-time into AWS, Azure, and
GCP helps troubleshoot cloud
applications. Correlate app and
cloud metrics.
Optimize utilization with
analytics-driven insights.
Rightsizing. Use Wavefront and
CloudHealth integration to
balance cloud costs with
performance.
Google Cloud
Datastore
Google Cloud
Pub/Sub
Google Cloud
Big Query
Google Cloud
Machine Learning
Google Cloud
App Engine
Google Cloud
Billing
Google Cloud
Router
Amazon EC2
AWS KMS
Amazon ECS
Amazon CacheAmazon EKS
Amazon
CloudWatch
Amazon EMR Amazon CloudFront
Amazon EBS
AWS KMSAWS Lambda
AWS Direct
Connect
AWS AutoScaling
Amazon S3
Amazon
Redshift
Amazon RDS
Amazon SQS
Amazon SNS
Amazon DynamoDB
Amazon EFSAWS Elastic
Beanstalk
Amazon Kinesis
Data Firehose
Amazon
Route53
AWS OpsWorks
Confidential │ ©2019 VMware, Inc.
Dev Ops Security
Plan Feedback
Configuration
ManagementCommit Operations
Continuous
Deployment
Artifact
ManagementCode Test
Continuous
Integration
Dev + Ops
decide on
sprint stories
App Code
Infra-as-Code
Architecture
consulting
Upload / commit
of code
automatically
triggers app +
infra + security
code review
If code passes
review, deploy to
production-like
env for
automated
testing.
Auto deploy to
production-like
environment for
user acceptance
testing, STAGE.
Both Dev and
Ops can
monitor
Continuous
learning and
cooperation
between Dev
and Ops
Use case: CI/CD Monitoring
Example App Dev Environment
CDStackTestStack OpsStackArtifactStackCommitStack CIStack
Plugins
CodeStack ConfigStackPlanStack FeedbackStack
Issues
DevOps
Stacks
Infrastructure-as-Code
Confidential │ ©2019 VMware, Inc.
Dev Ops Security
Plan Feedback
Configuration
Management
Commit Operations
Continuous
Deployment
Artifact
ManagementCode Test
Continuous
Integration
Dev + Ops
decide on
sprint stories
App Code
Infra-as-Code
Architecture
consulting
Upload / commit
of code
automatically
triggers app +
infra + security
code review
If code passes
review, deploy
to production-
like env for
automated
testing.
Auto deploy to
production-like
environment for
user acceptance
testing, STAGE.
Both Dev and
Ops can
monitor
Continuous
learning and
cooperation
between Dev
and Ops
CDStackTestStack OpsStackArtifactStackCommitStack CIStack
Plugins
CodeStack ConfigStackPlanStack FeedbackStack
Issues
DevOps
Stacks
Infrastructure-as-Code
Fully Instrumented pipeline. Analytics feedback loop from every delivery stage
Use case: CI/CD Monitoring
Example App Dev Environment
Confidential │ ©2019 VMware, Inc.
Demetri Mouratis, Staff SRE, Box
What Customers are Saying About Wavefront
Nick Walker, DevOps Team Lead, SpaceApe
Rob Fisher, Consultant for Largest Energy
Provider in UK
Mark Riegal, Development Manager
Fashion ID/Peek & Cloppenburg
“Wavefront metrics help us predict our future
cloud utilization, giving us the ability to
anticipate problems and correct them earlier
and faster. It empowers with self-service
metrics helping them engineering teams to find
a needle in the haystack”
“Wavefront SaaS analytics lets us troubleshoot
very accurately any problem before our cloud
game customers get impacted. We can track our
user experience, service, operational and
business performance in real-time.”
“It is very powerful to have all container,
microservices and business metrics in
Wavefront. We can see in real-time that our
business systems and infrastructure are
running as expected.”
“The beauty of using Wavefront, as opposed point
or silod tools, is that my metrics and alerting all
stay in the same place. I only need one
maintenance window, one Slack, Webhook, or
one PagerDuty configuration.”
Enter Wavefront: Cloud Services Monitoring at Box Today
34
• Amazon EC2 insight
• Real-time cost analytics - spot & reserved
instances pricing
• OS metrics monitoring - CPU, disk,
network
• Application performance monitoring -
200s, 500s,latency
• More than 800,000 metrics/second
(peaked at 1,000,000 pps)
• 400 engineers using Wavefront
• 848 Wavefront dashboards as of Oct 2017
35
“Good metrics help predict the future, giving you an opportunity
to anticipate problems and correct them.”
– Croll, and Yoskovitz.*
* From Lean analytics: Use data to build a better startup faster.
Sebastopol, CA: O’Reilly, 2013. Print.
Box: Predict the Future with Metrics-Driven Analytics
Box:Find the Needle in the Haystack
36
Box: Influence Decision Makers to Get More Resources
37
38
Box: Data-driven Business Decisions
39
• Understanding real user experience with
Amazon DynamoDB performance metrics
• Making business & operational decisions from
AWS lambda insight
• Improving game performance with AWS load
balancer metrics
“Wavefront SaaS analytics lets us troubleshoot
very accurately any problem before our cloud
game customers get impacted. We can track
our user experience, service, operational and
business performance in real time.”
- Louis McCormack
Lead DevOps Engineer,
Space Ape Games
Space Ape Ups Time-Sensitive Cloud Applications
Performance with AWS Analytics
40
Demetri Mouratis
SRE Engineer, Box
Monitoring AWS Lambda for Key Business and Operational Insights
Wavefront at Space Ape:
AWS, Application, and Business Insight
Real-time Insight into Amazon
Elastic Load Balancer Metrics
Latency
Request
Count
41
• Aggregate monitoring and alerting
• Seamless integration
• Metrics-analytics driven business
decisions
The First Pane of Glass for Large European Energy Supplier
UK SRE practitioner blog:
https://sysdef.xyz/
42
AWS CloudWatch
Security Dashboards
PagerDuty, Slack
The Logging Service
AWS Lambda
WavefrontWavefront
Puppet
Custom Application
Metrics
Custom Application
Metrics
Puppet
43
• Real-time insight into business
performance
• Visibility into a microservices, containers
and Kubernetes
• Monitoring various AWS (Lambda, etc)
Custom-Metrics Driven Operational and Business Decisions
at Fashion ID (Peek & Kloppenburg)
“It is very powerful to have all container,
microservices and business metrics in
Wavefront. We can see in real-time that
our business systems and infrastructure
are running as expected.
Marc Riegal
Development Manager
Fashion ID's Wavefront Kubernetes & Microservices
Dashboards
Confidential │ ©2019 VMware, Inc. 45©2018 VMware, Inc.
Passenger metrics
• New user signups / installs / activations
• Current passengers with the app open
Driver metrics
• New driver applications / activations
• Current drivers with the app open
Ride metrics
• Rides requested / accepted / dropped off / canceled / lapsed
• Lyft Line rides dropped off
• Paid vs. Couponed rides dropped off
Marketplace metrics
• Drivers available
• Drivers en route
• Driver utilization %
LYFT BUSINESS METRICS ON WAVEFRONT
Confidential │ ©2019 VMware, Inc. 46©2018 VMware, Inc.
PASSENGER - PAX CLIENT METRICS
Confidential │ ©2019 VMware, Inc. 47©2018 VMware, Inc.
CONSISTENT LOOK/FEEL ACROSS MICROSERVICES
48Confidential │ ©2019 VMware, Inc.
About Symphony – VMware
• Collection of business critical services
• Cloud Automation Service
• Log Intelligence
• Network Insight
• High SLA expectations
• Currently @99.9%
• Customer expectation @ 99.99%
• Daily delivery of value to customers
Confidential │ ©2019 VMware, Inc. 49©2018 VMware, Inc.
Our Scale
Containers
5000
Kubernetes
Clusters
12+
Users
400
Alerts
600
Application
Services
100+
Dashboards
500
Confidential │ ©2019 VMware, Inc. 50
Use Cases
Full Stack
Monitoring for
AWS &
Kubernetes
CI/CD Pipeline
Monitoring
Hybrid Cloud
Monitoring
Monitoring
Monitors
Measuring
SLAs
Wavefront – The First Pane of Glass for Symphony
Confidential │ ©2019 VMware, Inc. 51
Wavefront Delivers Visibility Across Kubernetes Clusters and CI/CD
Pipelines Public and Hybrid Cloud
Confidential │ ©2019 VMware, Inc. 52©2018 VMware, Inc.
Is My Service Available? Real-Time SLA Across All Services
Wavefront – The First Pane of Glass (FPOG) for Symphony
Confidential │ ©2019 VMware, Inc.
Thank You
Lets take a leap together,
Lets do a PoC

Wavefront presentation-May-2019

  • 1.
    © 2017, Wavefront.All rights reserved. Wavefront Confidential. Move Fast, See Everything. Stable Infrastructure Anil Gupta, vExpert Wavefront Lead – APJ @legraswindow guptaanil@vmware.com
  • 2.
    © 2017, Wavefront.All rights reserved. Wavefront Confidential.© 2017, Wavefront. All rights reserved. Wavefront Confidential. • Why Wavefront? • What’s Wavefront with features and functionalities • Use Cases • Customer Success Stories Agenda
  • 3.
    3©2018 VMware, Inc. CMPas licensed software (vRealize) Cloud Assembly Service Catalog Code Stream Application Discovery Log Intelligence Wavefront Network Insight CMP as a Service (VMware Cloud Services) Hybrid Cloud Public Cloud CONTAINERSVIRTUAL MACHINES KUBERNETESVM Cloud Health Self-Driving Operations Programmable Provisioning Application Operations Cloud Health Cloud Assembly Service Broker Code Stream Wavefront Log Intelligence Network Insight vRealize Code Stream 2.4.1 vRealize Network Insight 4.0 vRealize Operations 7.0 vRealize Log Insight 4.7 VMware Integrated OpenStack 5.0 vRealize Automation 7.5 vRealize Lifecycle Manager 2.0 vRealize Business for Cloud 7.5 Cloud Management Platform Consistent Developer Experience One-stop solution that underpins “Cloud Center of Excellence” VMWARE PUBLIC CLOUD MANAGEMENT SOLUTION
  • 4.
    4©2018 VMware, Inc. Wavefrontis Modern Analytics& Observability Platform Unified Observability for ModernApplications runningacross the Multicloud • One real-timewindowintothe healthofevery cloud, every app • Dramaticallyreducetooling complexityandcosts • 10xEarlierDetectionofhazardoussystem behavior • 90%Reductionin time takentoIsolate &Triage • 5xthe AdoptionofAPM • Using DataandAI toResolveissues beforeCustomerImpact • Accelerating Innovation& DevOpstransformation • CreatingOptimizedSelf-healingInfrastructure • Open datacollection andtransparentconsumptionpricing
  • 5.
    Borderless troubleshooting acrossall dataMetrics Traces EventsLog Data DetectEarlier IsolateFaster TriageTogether Auto-Remediate Creating a Cycle of Continuous Improvement Leveraging Data, Analyticsand AIto drive World-Class Cloud Operations Confidential │ ©2018 VMware,Inc. Built for the Enterprise Effective Collaboration and SmarterDecisions Automation<API> High Fidelity Universal AlertEngine
  • 6.
    6©2018 VMware, Inc. TheWavefront Difference A Unique Architecture and Approach #1 in Scale and Performance Lightening fast response times and massive real-time data ingestion Customer data rates of 130 Billion metrics per day. Unlimited Metric Cardinality. Complete Real-time Intelligence Borderless and automated correlation, forecasting and anomaly detection Automatically finding answers buried in millions of data points Better Collaboration across Distributed Teams All teams across all domains and geographies making better decisions together using data 1,000s of engineers across 100s of teams actively collaborating in one venue Unified Telemetry A real-time window into every layer of your Cloud Infrastructure and Modern Applications Compute, Network, Storage, OS, Middleware, Application telemetry in context. 200+ Integrations.
  • 8.
    Why Wavefront??? 8 • Proactiveearly detection of issues dramatically reduces MTTR, from hours to minutes • The “first pane of glass visibility reduces MTTR (unified first pane of glass visibility) • Real-time visibility into cloud services spend helps identify savings (spot/reserved instances) • Engineering time savings through unified visibility • Maintenance-free • Scale costs efficiently SaaS model • Maximized key services availability with instant answers and anomaly detection • Wavefront high availability helps eliminate monitoring blind blind spots • No downtime • Real-time business insight correlated with operational behavior performance • Improved customer satisfaction due to services performance and maximized SLAs • Constant insight helps adapt business value to customer needs • Empower developers to self-serve removing obstacles drives innovation (shared views, customized metrics) • Efficient DevOps team focus on overall performance • Allows devs to focus on business innovation vs keeping the lights on MTTR Reduction Cost Savings High Availability Business Value Collaboration- driven innovation
  • 10.
    10©2018 VMware, Inc. WFprimarily collects time series metrics data: • Anything being measured overtime (time series data; business, host, app) • Time series data is easily understood (visually) and helps to quickly identify patterns Time Series Data Collection Example Single platform with metrics, traces and histograms - the first pane of glass CUSTOMERS NEED NEW OPS TOOLING Monitoring Silos Hard to triage, correlate, collaborate, maintain EASY to triage, correlate, collaborate, maintain
  • 11.
    11Confidential │ ©2018VMware, Inc. Modern Monitoring Ecosystem: Metrics Is At The Forefront Metrics Sit on Top of a Modern Observability Stack – the first place to look… Metrics Aggregable Metrics are simple. Ease to analyze at speed, store at scale Metrics provide real-time visibility into performance and health, system-wide METRICS in-flights, designed for pilots APM for ground staff, not pilots LOGS for crash investigators See system-wide with metrics, than drill-down deeper with traces and logs. Complements Metrics: Logs contain all the excruciating detail and the kitchen sink Complements Metrics: APM uniquely does automatic transaction tracing for Gen2 Stacks
  • 12.
    12©2018 VMware, Inc. Dynamically filter noise and capture true anomalies.  Reduce Alert Sprawl & raise Alert Quality by consolidating metrics  Collaborate across teams by integrating Wavefront alerts to DevOps  Correlate Alerts and Events like deployment activities DETECT YOUR PROBLEMS  Ingest millions of metric data points per second  Monitor over 100,000 containers in real-time  Deliver metrics-as-a-service to 1000s of users across Ops, Dev and Biz  Provide richer data by maintaining full fidelity with no down-sampling over 18 months.  See the Real-Time impact of Code in Production  Run your systems with tighter Margins  Improve capacity forecasting & plan for future changes with AI Genie Automation  Real-Time Interactive Charts for Your First Pane of Glass  Find Root Causes Quickly with Unified Insights and Easy Drill-Downs  Use Unified Views Across Teams for Accelerated Code Delivery  Full OpenTracing/OpenCensus Compliance RESOLVE INCIDENTS FASTER OPTIMIZE PERFORMANCE REAL-TIME INTERACTIVE CHARTS Features & Functionalities
  • 13.
    Four Easy Waysof Sending Metrics into Wavefront 13 1. Wavefront Agents 2. Metrics Library/Application Code 4. Logs via TCP or via Filebeat 3. Directly from AWS,GCP Pivotal Cloud Foundry Wavefront Proxy
  • 14.
  • 15.
    Confidential │ ©2019VMware, Inc. 15©2018 VMware, Inc. ● Over 100 analytics functions within Wavefront Query Language ● No surprises, no hidden costs ● Easy to scale up to 4 million pps. ● Native metrics ingestion through open-source agents, API, code libraries and events, metrics from logs, other tools (DevOps, etc.) through integrations ● Avoid response lags and monitoring gaps ● Avoid Monitoring Meltdown during volume of data at scale ● Lightning-fast rendering Full-stack troubleshooting with Analytics & AI/ML UNIQUENESS
  • 16.
    16Confidential │ ©2018VMware, Inc. 1000 s 4 hrs 300:1 10x See thousands of problems that other tools miss Detect actionable problems 4 hours earlier than other tools Diagnose faster: eliminate 300 false alerts for every actionable alert Orchestrate better: automate remediation 10x METRICS DATA HUB MTTD ↓ 3x MTTR ↓ 5x Ops Productivity ↑ 80% Decision Confidence ↑ 80% Maintenance Costs ↓ 5x Dev Productivity ↑ 50% Across cloud infrastructure, applications, subscriber services and business Wavefront Delivers Compelling ROI !!!
  • 18.
    18Confidential │ ©2018VMware, Inc. Many Use cases = One Solution Analytics lends itself to more…but let’s start from common ones The First Pane of Glass Kubernetes & Containerized Applications Monitoring Microservices Observability CI/CD Pipeline Monitoring Public Cloud Monitoring
  • 19.
    Confidential │ ©2019VMware, Inc. 19 Use Case: The First Pane of Glass - FPOG “When there is an issue everyone is on webex sharing 15+ tools for hours”  Aggregation of data/metrics from multiple sources  Simple correlation analysis to ID events and possible causal areas  Prove innocence, get to the last mile in 2 minutes – hence FPOG APM Cloud Selected** “Logs/ Events” Infrastructure Aggregate! Analyze! Act! Wavefront Becomes The Master Aggregator of Metrics Business KPI
  • 20.
    20©2018 VMware, Inc. WavefrontCloud-Native Analytics and Monitoring Platform Delivers 3D Observability 𝑓(x) ServerlessApplications InfrastructureMicroservicesAny Cloud IoTContainers K8S/PKS/PCF • Full stack monitoring/observability. Any App. Any Cloud. • Detect, trend, and alert on anomalies • Ingest, analyze and visualize metrics, histograms and traces at scale. • Advanced query language for data analytics • 200+ integrations with OOTB dashboards
  • 21.
    Confidential │ ©2019VMware, Inc. 21 Use Case: VMware Enterprise PKS + Wavefront = Happy Meal 21 Develop Containerized Services, Leave the Heavy Lifting to Us Full stack monitoring – Kubernetes health, containerized application/microservices, cloud infrastructure Unified visibility for developers and Kubernetes operators reduces MTTR Up to speed in minutes - Integrated with PKS, 60 OOB K8S dashboards, packaged alerting Helps Scale K8S Reliably Happy Meal in 4 Clicks
  • 22.
    Better Together -Wavefront and PKS Kubernetes Health Monitoring Resource Consumption Programmatic Alerting Containerized Application Visibility Future proof. Bring Devs and PKS admins together. Offer Wavefront on Day 1.
  • 23.
    Confidential │ ©2019VMware, Inc. 23Confidential │ ©2018 VMware, Inc. • OOB dashboards • Visualize Kubernetes performance metrics from K8s at any scale, including nodes, pods, cluster, down to individual container performance metrics, also critical events such as behavioral errors. • Node metrics: Average memory, file system, CPU, and storage utilization • Namespace metrics: Memory usage by namespace, various counts (containers, pods) • Pod metrics: CPU usage rate, bytes transferred and received rate • Container metrics: Uptime by container, CPU, memory and file system usage, memory faults too K8s & Containerized Applications + Wavefront Operationalize your container platform • Blog: https://www.wavefront.com/pks-wavefront-analytics/ Develop on Containerized Services, Leave the Heavy Lifting to Us
  • 24.
    24Confidential │ ©2018VMware, Inc. Use Case: Microservices Monitoring TROUBLESHOOT FASTER OPTIMIZE APPLICATION PERFORMANCE • Out-of-the-box visibility • OpenTracing/OpenCensus compliant • Jaeger/Zipkin drop-in replacement EASILY MONITOR MICROSERVICES • Quickly pinpoint issues • Easily find long/errored API calls • Troubleshoot errored API responses • Find performance bottlenecks • Query and narrow down traces with long spans • Find APIs that can be optimized Enhanced Application Observability With Unified Metrics and Distributed Tracing
  • 25.
    25Confidential │ ©2018VMware, Inc. Wavefront Eliminates Microservices Monitoring Pains Lack of end-to-end request flow visibility across services boundaries drives long MTTR Scale limitation of open source DT solutions make them unsuitable for production use-case Different solutions for metrics and traces leads to time wasted in context switching Out-of-the-box, 3D observability with a scale tested solution reduces context switching and MTTR Long response time due to unoptimized services impacts revenue and customer experience Too much engineering time is spent in instrumenting and maintaining DT solutions Scale limitation of open source DT solutions make them unsuitable for production use-case Out-of-the-box, 3D observability with a scale tested solution empowers developers to optimize performance SREs/DevOps Team Developers Pains Gains
  • 26.
    26Confidential │ ©2018VMware, Inc. Getting Started is Easy Out-of-the-box support for metrics and traces Include SDK1 Write < 10 lines of code 2 TRACES
  • 27.
    27Confidential │ ©2018VMware, Inc. Wavefront Distributed Tracing Built-In Support OpenTracing 2.0 compliant Languages and Frameworks Third Party Instrumentation Service Mesh X-RayJersey Jaeger AppMetrics
  • 28.
    Confidential │ ©2019VMware, Inc. CONFIDENTIAL 28
  • 29.
    Confidential │ ©2019VMware, Inc. 29 Use Case - Public Cloud Monitoring Turn-key visibility across AWS, Azure and Google Cloud Platform Azure App Service Azure Redis Cache Azure AD Azure Application Gateway Azure Container Instances Azure SQL Database Azure Functions Real-time into AWS, Azure, and GCP helps troubleshoot cloud applications. Correlate app and cloud metrics. Optimize utilization with analytics-driven insights. Rightsizing. Use Wavefront and CloudHealth integration to balance cloud costs with performance. Google Cloud Datastore Google Cloud Pub/Sub Google Cloud Big Query Google Cloud Machine Learning Google Cloud App Engine Google Cloud Billing Google Cloud Router Amazon EC2 AWS KMS Amazon ECS Amazon CacheAmazon EKS Amazon CloudWatch Amazon EMR Amazon CloudFront Amazon EBS AWS KMSAWS Lambda AWS Direct Connect AWS AutoScaling Amazon S3 Amazon Redshift Amazon RDS Amazon SQS Amazon SNS Amazon DynamoDB Amazon EFSAWS Elastic Beanstalk Amazon Kinesis Data Firehose Amazon Route53 AWS OpsWorks
  • 30.
    Confidential │ ©2019VMware, Inc. Dev Ops Security Plan Feedback Configuration ManagementCommit Operations Continuous Deployment Artifact ManagementCode Test Continuous Integration Dev + Ops decide on sprint stories App Code Infra-as-Code Architecture consulting Upload / commit of code automatically triggers app + infra + security code review If code passes review, deploy to production-like env for automated testing. Auto deploy to production-like environment for user acceptance testing, STAGE. Both Dev and Ops can monitor Continuous learning and cooperation between Dev and Ops Use case: CI/CD Monitoring Example App Dev Environment CDStackTestStack OpsStackArtifactStackCommitStack CIStack Plugins CodeStack ConfigStackPlanStack FeedbackStack Issues DevOps Stacks Infrastructure-as-Code
  • 31.
    Confidential │ ©2019VMware, Inc. Dev Ops Security Plan Feedback Configuration Management Commit Operations Continuous Deployment Artifact ManagementCode Test Continuous Integration Dev + Ops decide on sprint stories App Code Infra-as-Code Architecture consulting Upload / commit of code automatically triggers app + infra + security code review If code passes review, deploy to production- like env for automated testing. Auto deploy to production-like environment for user acceptance testing, STAGE. Both Dev and Ops can monitor Continuous learning and cooperation between Dev and Ops CDStackTestStack OpsStackArtifactStackCommitStack CIStack Plugins CodeStack ConfigStackPlanStack FeedbackStack Issues DevOps Stacks Infrastructure-as-Code Fully Instrumented pipeline. Analytics feedback loop from every delivery stage Use case: CI/CD Monitoring Example App Dev Environment
  • 32.
  • 33.
    Demetri Mouratis, StaffSRE, Box What Customers are Saying About Wavefront Nick Walker, DevOps Team Lead, SpaceApe Rob Fisher, Consultant for Largest Energy Provider in UK Mark Riegal, Development Manager Fashion ID/Peek & Cloppenburg “Wavefront metrics help us predict our future cloud utilization, giving us the ability to anticipate problems and correct them earlier and faster. It empowers with self-service metrics helping them engineering teams to find a needle in the haystack” “Wavefront SaaS analytics lets us troubleshoot very accurately any problem before our cloud game customers get impacted. We can track our user experience, service, operational and business performance in real-time.” “It is very powerful to have all container, microservices and business metrics in Wavefront. We can see in real-time that our business systems and infrastructure are running as expected.” “The beauty of using Wavefront, as opposed point or silod tools, is that my metrics and alerting all stay in the same place. I only need one maintenance window, one Slack, Webhook, or one PagerDuty configuration.”
  • 34.
    Enter Wavefront: CloudServices Monitoring at Box Today 34 • Amazon EC2 insight • Real-time cost analytics - spot & reserved instances pricing • OS metrics monitoring - CPU, disk, network • Application performance monitoring - 200s, 500s,latency • More than 800,000 metrics/second (peaked at 1,000,000 pps) • 400 engineers using Wavefront • 848 Wavefront dashboards as of Oct 2017
  • 35.
    35 “Good metrics helppredict the future, giving you an opportunity to anticipate problems and correct them.” – Croll, and Yoskovitz.* * From Lean analytics: Use data to build a better startup faster. Sebastopol, CA: O’Reilly, 2013. Print. Box: Predict the Future with Metrics-Driven Analytics
  • 36.
    Box:Find the Needlein the Haystack 36
  • 37.
    Box: Influence DecisionMakers to Get More Resources 37
  • 38.
  • 39.
    39 • Understanding realuser experience with Amazon DynamoDB performance metrics • Making business & operational decisions from AWS lambda insight • Improving game performance with AWS load balancer metrics “Wavefront SaaS analytics lets us troubleshoot very accurately any problem before our cloud game customers get impacted. We can track our user experience, service, operational and business performance in real time.” - Louis McCormack Lead DevOps Engineer, Space Ape Games Space Ape Ups Time-Sensitive Cloud Applications Performance with AWS Analytics
  • 40.
    40 Demetri Mouratis SRE Engineer,Box Monitoring AWS Lambda for Key Business and Operational Insights Wavefront at Space Ape: AWS, Application, and Business Insight Real-time Insight into Amazon Elastic Load Balancer Metrics Latency Request Count
  • 41.
    41 • Aggregate monitoringand alerting • Seamless integration • Metrics-analytics driven business decisions The First Pane of Glass for Large European Energy Supplier UK SRE practitioner blog: https://sysdef.xyz/
  • 42.
    42 AWS CloudWatch Security Dashboards PagerDuty,Slack The Logging Service AWS Lambda WavefrontWavefront Puppet Custom Application Metrics Custom Application Metrics Puppet
  • 43.
    43 • Real-time insightinto business performance • Visibility into a microservices, containers and Kubernetes • Monitoring various AWS (Lambda, etc) Custom-Metrics Driven Operational and Business Decisions at Fashion ID (Peek & Kloppenburg) “It is very powerful to have all container, microservices and business metrics in Wavefront. We can see in real-time that our business systems and infrastructure are running as expected. Marc Riegal Development Manager
  • 44.
    Fashion ID's WavefrontKubernetes & Microservices Dashboards
  • 45.
    Confidential │ ©2019VMware, Inc. 45©2018 VMware, Inc. Passenger metrics • New user signups / installs / activations • Current passengers with the app open Driver metrics • New driver applications / activations • Current drivers with the app open Ride metrics • Rides requested / accepted / dropped off / canceled / lapsed • Lyft Line rides dropped off • Paid vs. Couponed rides dropped off Marketplace metrics • Drivers available • Drivers en route • Driver utilization % LYFT BUSINESS METRICS ON WAVEFRONT
  • 46.
    Confidential │ ©2019VMware, Inc. 46©2018 VMware, Inc. PASSENGER - PAX CLIENT METRICS
  • 47.
    Confidential │ ©2019VMware, Inc. 47©2018 VMware, Inc. CONSISTENT LOOK/FEEL ACROSS MICROSERVICES
  • 48.
    48Confidential │ ©2019VMware, Inc. About Symphony – VMware • Collection of business critical services • Cloud Automation Service • Log Intelligence • Network Insight • High SLA expectations • Currently @99.9% • Customer expectation @ 99.99% • Daily delivery of value to customers
  • 49.
    Confidential │ ©2019VMware, Inc. 49©2018 VMware, Inc. Our Scale Containers 5000 Kubernetes Clusters 12+ Users 400 Alerts 600 Application Services 100+ Dashboards 500
  • 50.
    Confidential │ ©2019VMware, Inc. 50 Use Cases Full Stack Monitoring for AWS & Kubernetes CI/CD Pipeline Monitoring Hybrid Cloud Monitoring Monitoring Monitors Measuring SLAs Wavefront – The First Pane of Glass for Symphony
  • 51.
    Confidential │ ©2019VMware, Inc. 51 Wavefront Delivers Visibility Across Kubernetes Clusters and CI/CD Pipelines Public and Hybrid Cloud
  • 52.
    Confidential │ ©2019VMware, Inc. 52©2018 VMware, Inc. Is My Service Available? Real-Time SLA Across All Services Wavefront – The First Pane of Glass (FPOG) for Symphony
  • 53.
    Confidential │ ©2019VMware, Inc. Thank You Lets take a leap together, Lets do a PoC