Wave Rider Trading Records - PDF
•
12 likes•4,334 views

Table for Trading Records Use for records stock trading Designed by Wave Riders Pui

Recommended
More Related Content
What's hot
What's hot (15)
Viewers also liked
Similar to Wave Rider Trading Records - PDF
Similar to Wave Rider Trading Records - PDF (20)
More from Pragasit Thitaram
More from Pragasit Thitaram (12)
Recently uploaded
Recently uploaded (20)
Wave Rider Trading Records - PDF
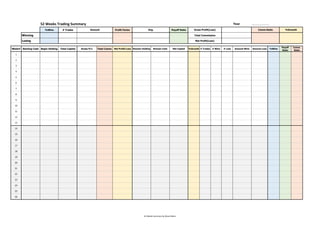
- 1. 52#Weeks(Summary(by(Wave(Riders 52#Weeks#Trading#Summary Year# ________________ %Wins # Trades Profit Factor Payoff Ratio Winning Losing Week# Starting Cash Begin Holding Total Capital Gross P/L Total Comm. Net Profit/Loss Remain Holding Remain Cash Net Capital %Growth # Trades # Wins # Loss Amount Wins Amount Loss %Wins Payoff Ratio Comm. Ratio 1 2 3 4 5 6 7 8 9 10 11 12 13 14 15 16 17 18 19 20 21 22 23 24 25 26 Comm.Ratio %GrowthAmount Gross Profit(Loss) Total Commission Net Profit(Loss) Avg.
- 2. 52#Weeks(Summary(by(Wave(Riders 52#Weeks#Trading#Summary Year# ________________ %Wins # Trades Profit Factor Payoff Ratio Winning Losing Week# Starting Cash Begin Holding Total Capital Gross P/L Total Comm. Net Profit/Loss Remain Holding Remain Cash Net Capital %Growth # Trades # Wins # Loss Amount Wins Amount Loss %Wins Payoff Ratio Comm. Ratio Comm.Ratio %GrowthAmount Gross Profit(Loss) Total Commission Net Profit(Loss) Avg. 27 28 29 30 31 32 33 34 35 36 37 38 39 40 41 42 43 44 45 46 47 48 49 50 51 52 TOTAL
- 3. StockRecords+by+Wave+Riders Stock Trading Records -- Weekly Sheet %Wins #Trades Profit Factor Avg. Payoff Ratio Comm./Gross %Net Profit Avg.Days Winning Losing Date Units Price Amount Comm. Total Pay Date Price Amount Comm. Total Return TOTAL Week # From Date To Date Total Commission Net Profit(Loss) Year / Month CommentDaysSymbol %Net P/L Gross Profit/Loss Total Comm. Entry Exit Net Profit/Loss Gross Profit(Loss)Amount
- 4. FutureRecord+by+Wave+Riders Future Trading Records -- Weekly Sheet %Wins #Trades Profit Factor Avg. Payoff Ratio Comm./Gross %Net Profit Avg.Days Winning Losing Date Position Unit Price Comm. Total Pay Date Position Price Comm. Total Return TOTAL %Net P/L Days CommentSymbol Entry Exit Gross Profit/Loss Total Comm. Net Profit/Loss From Date Net Profit(Loss) To Date Total Commission Year / Month Amount Gross Profit(Loss) Week #
- 5. Trading(Action(Plan(by(Wave(Riders !!!!Plan Symbol Price Size Price!#1 Size!#1 Stop Amount Price!#2 Size!#2 Signal Avg.!Price Total!Size Total!Amount Stop !!!!Plan Symbol Price Size Price!#1 Size!#1 Stop Amount Price!#2 Size!#2 Signal Avg.!Price Total!Size Total!Amount Stop !!!!Plan Symbol Price Size Price!#1 Size!#1 Stop Amount Price!#2 Size!#2 Signal Avg.!Price Total!Size Total!Amount Stop !!!!Plan Symbol Price Size Price!#1 Size!#1 Stop Amount Price!#2 Size!#2 Signal Avg.!Price Total!Size Total!Amount Stop !!!!Plan Symbol Price Size Price!#1 Size!#1 Stop Amount Price!#2 Size!#2 Signal Avg.!Price Total!Size Total!Amount Stop !!!Entry!!!!!!!! !!!!!!!!!!!!!!!!!!!!!Exit Date:!______/______/______ Actual!!!! Emotion !!!Entry!!!!!!!! !!!!!!!!!!!!!!!!!!!!!Exit Date:!______/______/______ Actual!!!! Emotion !!!Entry!!!!!!!! !!!!!!!!!!!!!!!!!!!!!Exit Date:!______/______/______ Actual!!!! Emotion !!!Entry!!!!!!!! !!!!!!!!!!!!!!!!!!!!Exit Date:!______/______/______ Actual!!!! Emotion !!!Entry!!!!!!!! !!!!!!!!!!!!!!!!!!!!!Exit Date:!______/______/______ Actual!!!! Emotion