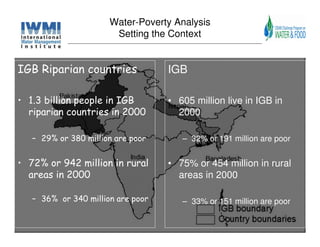
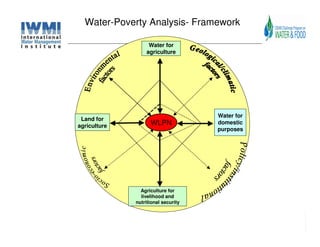
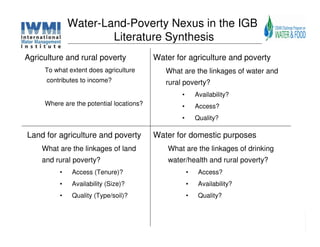
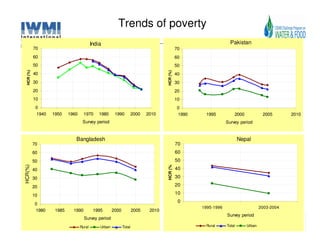
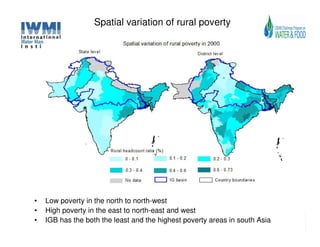
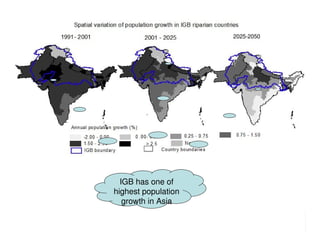
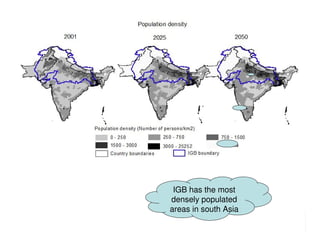
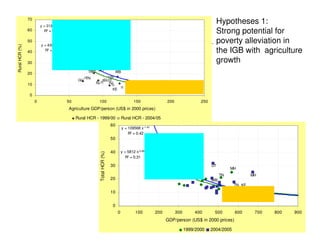
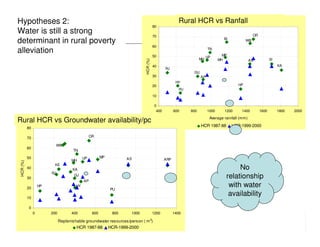
Water Poverty Analysis
      IGB Basin Focal project

         Upali Amarasinghe
Stefanos Xenarios, Rajendran Srinivasulu,
            Madar Samad
Water-Poverty Analysis
                       Setting the Context


IGB Riparian countries             IGB

• 1.3 billion people in IGB        • 605 million live in IGB in
  riparian countries in 2000         2000

   – 29% or 380 million are poor      – 32% or 191 million are poor


• 72% or 942 million in rural      • 75% or 454 million in rural
  areas in 2000                      areas in 2000

   – 36% or 340 million are poor      – 33% or 151 million are poor
Water-Poverty Analysis
                    Setting the Context

In IGB - 150 million rural population are poor!
• Many depends their livelihood on agriculture

• Natural resources, especially renewable water resources are

   under tremendous pressure

• Droughts and floods are recurrent phenomenon

• Spatial variation of poverty is high

• Spatial variation of natural resources is also high

• What is the extent of water-land-poverty nexus in the IGB?
Water-Poverty Analysis
                   Setting the Context

Water-Land-Poverty Nexus in the IGB
• Extent of adequate access to land and water resources helped
  poverty alleviation?

• Extent of inadequate access to water and land are constraints to
  poverty alleviation?

• Extent of degradation of natural resource base due to extensive
  irrigated agriculture, causes poverty?

• The coping mechanisms in places under such adversity?
Water-Poverty Analysis
                     Setting the Context

Objectives of Water-Poverty Analysis in the IGB Basin
  Focal project:

• Map sub-national poverty in the IGB


• Identify the determinants of poverty, with a special focus on water,

   land and poverty nexus, and


• Identify the coping mechanisms of the people living under poor

   conditions of water and land.
Water-Poverty Analysis
                      Setting the Context

Agreed outputs and progress
• Literature synthesis (Completed. Upali A.)

• Poverty mapping (In progress)
   – Small area estimation method (R. Srinivasulu)
   – Non-parametric density estimation method (Upali A.)
• Analysis of water-land-environment poverty nexus and coping
  mechanisms in the IGB (In progress)

   – District level (Upali A.)

   – Household level (Stefanos Xenarios)
Water-Land-Poverty Nexus in
          the IGB
         Upali Amarasinghe
  Rajendran Srinivasulu, Dhrubra Pant
Water-Land-Poverty Nexus in the IGB
                   Literature Synthesis


Outline
• Framework
• Spatial variation of poverty in the IGB
• Linkages of agriculture growth, water and land with poverty
• Econometric analysis of the water-land-poverty nexus
• Future activities
Water-Poverty Analysis- Framework

                   Water for
                  agriculture


                                     Water for
 Land for
agriculture         WLPN             domestic
                                     purposes


                Agriculture for
                livelihood and
              nutritional security
Water-Land-Poverty Nexus in the IGB
                      Literature Synthesis
Agriculture and rural poverty             Water for agriculture and poverty
     To what extent does agriculture         What are the linkages of water and
      contributes to income?                 rural poverty?
                                                  •       Availability?
     Where are the potential locations?           •       Access?
                                                  •       Quality?

Land for agriculture and poverty          Water for domestic purposes
    What are the linkages of land             What are the linkages of drinking
    and rural poverty?                        water/health and rural poverty?
          •   Access (Tenure)?                        •    Access?
          •   Availability (Size)?                    •    Availability?
          •   Quality (Type/soil)?                    •    Quality?
Trends of poverty
                                           India                                                                    Pakistan
            70                                                                                 70
            60                                                                                 60
            50                                                                                 50
  HCR (%)


                                                                                     HCR (%)
            40                                                                                 40
            30                                                                                 30
            20                                                                                 20
            10                                                                                 10
             0                                                                                 0
             1940   1950    1960     1970      1980     1990          2000   2010              1990    1995           2000            2005       2010
                                    Survey period                                                                 Survey period


                               Bangladesh                                                                                 Nepal
            70                                                                                 70
            60                                                                                 60
            50                                                                                 50
                                                                                     HCR (%)
HCR(%)


            40                                                                                 40

            30                                                                                 30

            20                                                                                 20

            10                                                                                 10
                                                                                                0
            0
                                                                                                      1995-1996                      2003-2004
            1980     1985     1990          1995       2000           2005    2010
                                                                                                                  Survey period
                                     Survey period
                                   Rural       Urban          Total                                    Rural      Total      Urban
Spatial variation of rural poverty


•   Low poverty in the north to north-west
•   High poverty in the east to north-east and west
•   IGB has the both the least and the highest poverty areas in south Asia
2025-2050


IGB has one ofof
  IGB has one the
highest population
   growth in Asia
2025-2050


 IGB has the most
densely populated
areas in south Asia
70
                         y = 3132 x -1.05   JH
                                                                                                                                                                       Hypotheses 1:
                60         R2 = 0.37                                                                                                                                   Strong potential for
                50
                         y = 4398 x -1.19
                                                 CH
                                                      BI
                                                            OR                                                                                                         poverty alleviation in
Rural HCR (%)


                40         R2 = 0.59
                                                 JH MP
                                                                                                                                                                       the IGB with agriculture
                                                                     OR                    UT WB
                30                               BI        CH        UP
                                                                        UT
                                                                                                                                                                       growth
                                                                MP UP
                                                                     MH
                20                                               TN MH                            WB
                                                                TN
                                                       GU                          GU
                10                                                    RJ                    RJ                                   HR
                                                                                                                                                             PU
                                                                                              KE             HP           HP      HR                          PU
                 0
                     0                      50                            100                                  150                     200                     250
                                             Agriculture GDP/person (US$ in 2000 prices)

                                                      Rural HCR - 1999/00                              Rural HCR - 2004/05
                                                                                             60
                                                                                                       y = 109568 x -1.43
                                                                                                           R2 = 0.42
                                                                                             50                                         OR
                                                                                                                            BI               JH
                                                                                             40        y = 5812 x -0.96                     MP
                                                                           Total HCR (%)


                                                                                                                                              CH OR
                                                                                                         R2 = 0.31
                                                                                                                                       UP          MP         UT
                                                                                             30                             BI                          CH           UT
                                                                                                                                                             WB                MH
                                                                                                                                        UP                                TN             MH
                                                                                             20                                                                      WB
                                                                                                                                                                                 TN KE
                                                                                             10                                                                                HP HR GUPU
                                                                                                                                                                                                    HR
                                                                                                                                                                                            HP PU
                                                                                              0
                                                                                                   0              100            200         300             400      500        600        700          800   900
                                                                                                                                       GDP/person (US$ in 2000 prices)

                                                                                                                                                   1999/2000         2004/2005
Hypotheses 2:                                                                                            Rural HCR (HCR) vs average rainfall
                                                                                                         Head count ratio vs Ranfall
                                                                                        80
Water is still a strong                                                                                                                             OR
                                                                                        70
determinant in rural poverty                                                                                                      BI           WB
                                                                                        60
alleviation                                                                                                              TN
                                                                                                                                  MP
                                                                                        50                               UP
                                                                                                                    MH          MH                              SI


                                                                              HCR (%)
                                                                                                                                                  AS
                                                                                        40                                                                           KA
                                                                                                RJ
                                                                                                               GU
                                                                                        30                          AP
                                                                                                       HY
                                                                                        20                                                HP
                                                                                                         PU
                                                                                        10

                                                                                         0
                                                                                          400         600     800        1000      1200    1400          1600        1800   2000

                                                                                                                          Average rainfall (mm)
Rural HCRcountGroundwater capita Groundwater availability
      Head vs ratio (HCR) vs per availability/pc
                                                                                                                    HCR 1987-88        HCR-1999-2000
           80

           70                                     OR

                              WB
           60
                                      TN
           50                                UP          MP          AS
                                      MH                                                        ARP
 HCR (%)


                          KE
           40                         KA                                                                                                No
                         RJ
           30
                                       GJ
                                                                                                                                   relationship
                                             AP
           20
                    HP                  HY
                                                              PU
                                                                                                                                    with water
           10
                                                                                                                                    availability
           0
                0        200          400          600         800     1000             1200          1400

                               Replenishable groundwater resources/person ( m 3)
                                        HCR 1987-88           HCR-1999-2000
Hypotheses 2:
Water is still a strong
                                                                                                                                                                                                                                       But rural
determinant in rural poverty
                                                                                                                                                                                                                                    poverty has a
alleviation
                                                                                                                                                                                                                                    strong linkage
                                                                                                                                                                                                                                    with access to
                                                                                                                                                                                                                                       irrigation
Rural HCR vs access to irrigation
                     100                                                                                                                                                                                                                                     HCR 1999-
                                                                                                                                                                                                                                                             2000
                     80
HCR and % Area (%)


                     60
                                                                                                                                                                                                                                                             Net
                                                                                                                                                                                                                                                             irrigated
                     40                                                                                                                                                                                                                                      area-% of
                                                                                                                                                                                                                                                             net sown
                                                                                                                                                                                                                                                             area
                     20
                                                                                                                                                                                                                                                             Groundwat
                                                                                                                                                                                                                                                             er irrigated
                      0
                                                                                                                                                                                                                                                             area - % of
                                                       Haryana


                                                                                                                                                                                      Madhya Pradesh
                                                                                           Gujarat


                                                                                                                                                                                                                                            Bihar
                           Punjab


                                                                 Kerala

                                                                          Andhra Pradesh


                                                                                                                 Karnataka


                                                                                                                                          Maharashtra


                                                                                                                                                                                                                Arunachal Pradesh
                                                                                                                                                                                                       Sikkim
                                                                                                                                                                        West Bengal
                                                                                                     Rajasthan


                                                                                                                             Tamil Nadu


                                                                                                                                                        Uttar Pradesh


                                                                                                                                                                                                                                    Assam
                                    Himachal Pradesh


                                                                                                                                                                                                                                                    Orissa
                                                                                                                                                                                                                                                             total
Hypotheses 3:
Access to land is still a strong determinant in rural poverty alleviation
Rural HCR vs land holding size
          60
                                                                                                                      Rural poverty
          50
                                                                                           India                        has strong
          40
                                                                                                                      linkages with
HCR (%)


          30
                                                                                           Pakistan                  access to Land
          20
                                                                                                                    and land holding
          10
                                                                                                                           size
           0                                                                               Banglade
                                                                                           sh


                                                                                   e
                                              m


                                                      m
                             al
                  ss


                                                l


                                                                  e
                                              al


                                                                                rg
                                                               rg
                                            iu
                           n


                                                      iu
                                          Sm
               le


                                                                          la
                        gi


                                                            La
                                          ed


                                                     ed
           nd


                        ar


                                                                      ry
                                      l-m


                                                    M
          La


                       M


                                                                  Ve
                                    al


                                                                                60
                                  Sm


                                                                                                                                       Orissa

                                        Land holding size                       50
                                                                                                                                       Bihar
                                                                                                                                       Assam
                                                                                                                                       Madhya Pradesh
                                                                                40                                                     Uttar Pradesh
                                                                      HCR (%)


                                                                                                                                       West Bengal

                         Strong linkage in                                      30
                                                                                                                                       Maharashtra
                                                                                                                                       TamilNadu
                         the poor parts of                                                                                             Karnataka
                                                                                20                                                     Rajasthan

                                  the IGB                                                                                              Gujarat
                                                                                                                                       Andhra Pradesh
                                                                                10
                                                                                                                                       Haryana
                                                                                                                                       Kerala
                                                                                0                                                      Punjab
                                                                                       Small       Small-medium    Medium    Large

                                                                                                       Land holding size
Hypotheses 4:
Access to domestic water supply is a cause and effect of poverty

HCR vs access to safe sanitation and drinking water supply
      90

      75

      60
  %


      45

      30

      15

       0
               a r du
               H jab


                  Be h


                                                                    n g tan
                           h
                  as t


                m ka


                Pr al


                  O r


                                                                            sh
                 As s t


                                                                             al
                 G h


              r P htra
                         na

                Pr l a


             Ka than


                         sa
                          m
             R jara


                        ha
             N de s
                        es
                        es


           y a ng
                         a


                                                                          ep
                      ea
                      ra


                     sa
            Ta ta


                                                                         de
                     ri s
                      n
                     ya


         M il N


                                                                  Ba k is
                    Bi
         W rad
                   ad
                  Pu


        d h Ke


                   as
                    u


                                                                        N
                    a


                   a

                  th


                                                                       la
                  ar


                 rn


                                                                     Pa
               aj


               or
      M st
            ah
            ra


            e
          tta


        ad
        U
      An


                    Head count ratio                                              •No apparent
                    % population using latrine
                                                                                  linkages
                    % population with drinking water supply within the premices

                                                                                  •Data are too
                                                                                  aggregate to find
                                                                                  any relationship
Econometric analysis

              Dependent variable- Ln (Rural head count ratio)
                                                       Coefficient Standard
                                                                   Error
   Constant                                                  -1.60              1.3
   Ln (Water productivity)                                   -3.42              0.5*
   (Ln (Water productivity))2                                -1.52              0.3*
   Ln (% CWU from irrigation)                                -0.17             0.08*
   Ln (% of groundwater irri. area)                          -0.18              0.1*
   Ln (Net sown area/person)                                 -0.19             0.09*
   Ln (% rural population)                                    0.58              0.3*
   R2                                                            75%

Determinants of rural poverty

1. Water productivity, 2. irrigation quantity, 3. Reliability of irrigation,
4. Land holding size, 5. agriculture dependent population
End of the Literature Review

          Thank you
Poverty Mapping of the IGB
Using Small Area Estimation

       Rajendran Srinivasulu
           PhD Student
Issue
• Can we estimate poverty mapping at district level?
  Yes! But it requires more time and sufficient econometric model
• Do we have sufficient data sources?
  Yes!
• What are the data sources are available? and time period?
  NSS, Census and other secondary sources
• Is there any study?
  India – Bigman and Srinivasan (2002), N S Sastry (2003), Indira
  et al, (2002), Bigman & Deichmann, (2000), Dreze and Srinivasan
  (1996)
• What are the methodology has been adopted by the literature?
  Pooling Data from NSS and Census, Small Area Estimation
  (SAE), other secondary data set at regional level and Primary
  survey
• The present study’s methodology and future plan
Methodology Available

• Small Area Estimation (SAE)
• Pooling Data from Census, NSS,
  Agricultural Survey, Cost of Cultivation
  Survey and various Geographical
  Surveys (Bigman and Srinivasan, 2002)
• Pooling Data from Census and NSS
• Region-wise Analysis
Small Area Estimation
• The term small area usually denote a small geographical area,
  such as a county, a province, an administrative area or a census
  division

• From a statistical point of view the small area is a small domain,
  that is a small subpopulation constituted by specific
  demographic and socioeconomic group of people, within a larger
  geographical areas

• Sample survey data provide effective reliable estimators of
  totals and means for large areas and domains. But it is
  recognized that the usual direct survey estimators performing
  statistics for a small area, have unacceptably large standard
  errors, due to the circumstance of small sample size in the area
Small Area Estimation (SAE)
• The small area statistics are based on a collection of
  statistical methods that “borrow strength” form
  related or similar small areas through statistics
  models that connect variables of interest in small
  areas with vectors of supplementary data, such as
  demographic, behavioral, economic notices, coming
  from administratvive, census and specific sample
  surveys records

• Small area efficient statistics provide, in addition of
  this, excellent statistics for local estimation of
  population, farms, and other characteristics of
  interest in post-censual years
Type of Approaches
•   The most commonly used tecniques for small area estimation are the
    empirical Bayes (EB) procedures, the hierarchical Bayes (HB) and the
    empirical best linear unbiased prediction (EBLUP) procedures (Rao,
    2003)

•   Some utilization of this tecniques in agrigultural statistics are related
    to the implementation of satellite data, and, in general, of differently-
    oriented sumpley surveys in model-based frameworks

•   There are two types of small area models that include random area-
    specific effects: in the first type, the basic area level model,
    connection through response and area specific auxiliary variables is
    established, because the limited availability at such type of data at unit
    level
•   The second type are the unit level area models, in which element-
    specific auxiliary data are available for the population elements (Ghosh
    and Rao, 1994; Rao, 2002)
Bigman and Srinivasan (2002) Model

• Step 1: Econometric Estimation of the Impact of
  district-specific characteristics based on the
  probability that the households residing in a given
  district are poor
• Step 2: predictions of the incidence of poverty in all
  the districts of the country based on the
  characteristics of these districts.
• Step 3: First validation of the prediction – predicted
  and actual value from NSS
• Step 4: Ranking and Grouping
• Step 5: second validation of the prediction:
  comparison of predicted values and actual values

Water poverty analysis in the Indo-Ganges Basin

  • 1.
    Water Poverty Analysis IGB Basin Focal project Upali Amarasinghe Stefanos Xenarios, Rajendran Srinivasulu, Madar Samad
  • 2.
    Water-Poverty Analysis Setting the Context IGB Riparian countries IGB • 1.3 billion people in IGB • 605 million live in IGB in riparian countries in 2000 2000 – 29% or 380 million are poor – 32% or 191 million are poor • 72% or 942 million in rural • 75% or 454 million in rural areas in 2000 areas in 2000 – 36% or 340 million are poor – 33% or 151 million are poor
  • 3.
    Water-Poverty Analysis Setting the Context In IGB - 150 million rural population are poor! • Many depends their livelihood on agriculture • Natural resources, especially renewable water resources are under tremendous pressure • Droughts and floods are recurrent phenomenon • Spatial variation of poverty is high • Spatial variation of natural resources is also high • What is the extent of water-land-poverty nexus in the IGB?
  • 4.
    Water-Poverty Analysis Setting the Context Water-Land-Poverty Nexus in the IGB • Extent of adequate access to land and water resources helped poverty alleviation? • Extent of inadequate access to water and land are constraints to poverty alleviation? • Extent of degradation of natural resource base due to extensive irrigated agriculture, causes poverty? • The coping mechanisms in places under such adversity?
  • 5.
    Water-Poverty Analysis Setting the Context Objectives of Water-Poverty Analysis in the IGB Basin Focal project: • Map sub-national poverty in the IGB • Identify the determinants of poverty, with a special focus on water, land and poverty nexus, and • Identify the coping mechanisms of the people living under poor conditions of water and land.
  • 6.
    Water-Poverty Analysis Setting the Context Agreed outputs and progress • Literature synthesis (Completed. Upali A.) • Poverty mapping (In progress) – Small area estimation method (R. Srinivasulu) – Non-parametric density estimation method (Upali A.) • Analysis of water-land-environment poverty nexus and coping mechanisms in the IGB (In progress) – District level (Upali A.) – Household level (Stefanos Xenarios)
  • 7.
    Water-Land-Poverty Nexus in the IGB Upali Amarasinghe Rajendran Srinivasulu, Dhrubra Pant
  • 8.
    Water-Land-Poverty Nexus inthe IGB Literature Synthesis Outline • Framework • Spatial variation of poverty in the IGB • Linkages of agriculture growth, water and land with poverty • Econometric analysis of the water-land-poverty nexus • Future activities
  • 9.
    Water-Poverty Analysis- Framework Water for agriculture Water for Land for agriculture WLPN domestic purposes Agriculture for livelihood and nutritional security
  • 10.
    Water-Land-Poverty Nexus inthe IGB Literature Synthesis Agriculture and rural poverty Water for agriculture and poverty To what extent does agriculture What are the linkages of water and contributes to income? rural poverty? • Availability? Where are the potential locations? • Access? • Quality? Land for agriculture and poverty Water for domestic purposes What are the linkages of land What are the linkages of drinking and rural poverty? water/health and rural poverty? • Access (Tenure)? • Access? • Availability (Size)? • Availability? • Quality (Type/soil)? • Quality?
  • 11.
    Trends of poverty India Pakistan 70 70 60 60 50 50 HCR (%) HCR (%) 40 40 30 30 20 20 10 10 0 0 1940 1950 1960 1970 1980 1990 2000 2010 1990 1995 2000 2005 2010 Survey period Survey period Bangladesh Nepal 70 70 60 60 50 50 HCR (%) HCR(%) 40 40 30 30 20 20 10 10 0 0 1995-1996 2003-2004 1980 1985 1990 1995 2000 2005 2010 Survey period Survey period Rural Urban Total Rural Total Urban
  • 12.
    Spatial variation ofrural poverty • Low poverty in the north to north-west • High poverty in the east to north-east and west • IGB has the both the least and the highest poverty areas in south Asia
  • 13.
    2025-2050 IGB has oneofof IGB has one the highest population growth in Asia
  • 14.
    2025-2050 IGB hasthe most densely populated areas in south Asia
  • 15.
    70 y = 3132 x -1.05 JH Hypotheses 1: 60 R2 = 0.37 Strong potential for 50 y = 4398 x -1.19 CH BI OR poverty alleviation in Rural HCR (%) 40 R2 = 0.59 JH MP the IGB with agriculture OR UT WB 30 BI CH UP UT growth MP UP MH 20 TN MH WB TN GU GU 10 RJ RJ HR PU KE HP HP HR PU 0 0 50 100 150 200 250 Agriculture GDP/person (US$ in 2000 prices) Rural HCR - 1999/00 Rural HCR - 2004/05 60 y = 109568 x -1.43 R2 = 0.42 50 OR BI JH 40 y = 5812 x -0.96 MP Total HCR (%) CH OR R2 = 0.31 UP MP UT 30 BI CH UT WB MH UP TN MH 20 WB TN KE 10 HP HR GUPU HR HP PU 0 0 100 200 300 400 500 600 700 800 900 GDP/person (US$ in 2000 prices) 1999/2000 2004/2005
  • 16.
    Hypotheses 2: Rural HCR (HCR) vs average rainfall Head count ratio vs Ranfall 80 Water is still a strong OR 70 determinant in rural poverty BI WB 60 alleviation TN MP 50 UP MH MH SI HCR (%) AS 40 KA RJ GU 30 AP HY 20 HP PU 10 0 400 600 800 1000 1200 1400 1600 1800 2000 Average rainfall (mm) Rural HCRcountGroundwater capita Groundwater availability Head vs ratio (HCR) vs per availability/pc HCR 1987-88 HCR-1999-2000 80 70 OR WB 60 TN 50 UP MP AS MH ARP HCR (%) KE 40 KA No RJ 30 GJ relationship AP 20 HP HY PU with water 10 availability 0 0 200 400 600 800 1000 1200 1400 Replenishable groundwater resources/person ( m 3) HCR 1987-88 HCR-1999-2000
  • 17.
    Hypotheses 2: Water isstill a strong But rural determinant in rural poverty poverty has a alleviation strong linkage with access to irrigation Rural HCR vs access to irrigation 100 HCR 1999- 2000 80 HCR and % Area (%) 60 Net irrigated 40 area-% of net sown area 20 Groundwat er irrigated 0 area - % of Haryana Madhya Pradesh Gujarat Bihar Punjab Kerala Andhra Pradesh Karnataka Maharashtra Arunachal Pradesh Sikkim West Bengal Rajasthan Tamil Nadu Uttar Pradesh Assam Himachal Pradesh Orissa total
  • 18.
    Hypotheses 3: Access toland is still a strong determinant in rural poverty alleviation Rural HCR vs land holding size 60 Rural poverty 50 India has strong 40 linkages with HCR (%) 30 Pakistan access to Land 20 and land holding 10 size 0 Banglade sh e m m al ss l e al rg rg iu n iu Sm le la gi La ed ed nd ar ry l-m M La M Ve al 60 Sm Orissa Land holding size 50 Bihar Assam Madhya Pradesh 40 Uttar Pradesh HCR (%) West Bengal Strong linkage in 30 Maharashtra TamilNadu the poor parts of Karnataka 20 Rajasthan the IGB Gujarat Andhra Pradesh 10 Haryana Kerala 0 Punjab Small Small-medium Medium Large Land holding size
  • 19.
    Hypotheses 4: Access todomestic water supply is a cause and effect of poverty HCR vs access to safe sanitation and drinking water supply 90 75 60 % 45 30 15 0 a r du H jab Be h n g tan h as t m ka Pr al O r sh As s t al G h r P htra na Pr l a Ka than sa m R jara ha N de s es es y a ng a ep ea ra sa Ta ta de ri s n ya M il N Ba k is Bi W rad ad Pu d h Ke as u N a a th la ar rn Pa aj or M st ah ra e tta ad U An Head count ratio •No apparent % population using latrine linkages % population with drinking water supply within the premices •Data are too aggregate to find any relationship
  • 20.
    Econometric analysis Dependent variable- Ln (Rural head count ratio) Coefficient Standard Error Constant -1.60 1.3 Ln (Water productivity) -3.42 0.5* (Ln (Water productivity))2 -1.52 0.3* Ln (% CWU from irrigation) -0.17 0.08* Ln (% of groundwater irri. area) -0.18 0.1* Ln (Net sown area/person) -0.19 0.09* Ln (% rural population) 0.58 0.3* R2 75% Determinants of rural poverty 1. Water productivity, 2. irrigation quantity, 3. Reliability of irrigation, 4. Land holding size, 5. agriculture dependent population
  • 21.
    End of theLiterature Review Thank you
  • 22.
    Poverty Mapping ofthe IGB Using Small Area Estimation Rajendran Srinivasulu PhD Student
  • 23.
    Issue • Can weestimate poverty mapping at district level? Yes! But it requires more time and sufficient econometric model • Do we have sufficient data sources? Yes! • What are the data sources are available? and time period? NSS, Census and other secondary sources • Is there any study? India – Bigman and Srinivasan (2002), N S Sastry (2003), Indira et al, (2002), Bigman & Deichmann, (2000), Dreze and Srinivasan (1996) • What are the methodology has been adopted by the literature? Pooling Data from NSS and Census, Small Area Estimation (SAE), other secondary data set at regional level and Primary survey • The present study’s methodology and future plan
  • 24.
    Methodology Available • SmallArea Estimation (SAE) • Pooling Data from Census, NSS, Agricultural Survey, Cost of Cultivation Survey and various Geographical Surveys (Bigman and Srinivasan, 2002) • Pooling Data from Census and NSS • Region-wise Analysis
  • 25.
    Small Area Estimation •The term small area usually denote a small geographical area, such as a county, a province, an administrative area or a census division • From a statistical point of view the small area is a small domain, that is a small subpopulation constituted by specific demographic and socioeconomic group of people, within a larger geographical areas • Sample survey data provide effective reliable estimators of totals and means for large areas and domains. But it is recognized that the usual direct survey estimators performing statistics for a small area, have unacceptably large standard errors, due to the circumstance of small sample size in the area
  • 26.
    Small Area Estimation(SAE) • The small area statistics are based on a collection of statistical methods that “borrow strength” form related or similar small areas through statistics models that connect variables of interest in small areas with vectors of supplementary data, such as demographic, behavioral, economic notices, coming from administratvive, census and specific sample surveys records • Small area efficient statistics provide, in addition of this, excellent statistics for local estimation of population, farms, and other characteristics of interest in post-censual years
  • 27.
    Type of Approaches • The most commonly used tecniques for small area estimation are the empirical Bayes (EB) procedures, the hierarchical Bayes (HB) and the empirical best linear unbiased prediction (EBLUP) procedures (Rao, 2003) • Some utilization of this tecniques in agrigultural statistics are related to the implementation of satellite data, and, in general, of differently- oriented sumpley surveys in model-based frameworks • There are two types of small area models that include random area- specific effects: in the first type, the basic area level model, connection through response and area specific auxiliary variables is established, because the limited availability at such type of data at unit level • The second type are the unit level area models, in which element- specific auxiliary data are available for the population elements (Ghosh and Rao, 1994; Rao, 2002)
  • 28.
    Bigman and Srinivasan(2002) Model • Step 1: Econometric Estimation of the Impact of district-specific characteristics based on the probability that the households residing in a given district are poor • Step 2: predictions of the incidence of poverty in all the districts of the country based on the characteristics of these districts. • Step 3: First validation of the prediction – predicted and actual value from NSS • Step 4: Ranking and Grouping • Step 5: second validation of the prediction: comparison of predicted values and actual values