Download to read offline


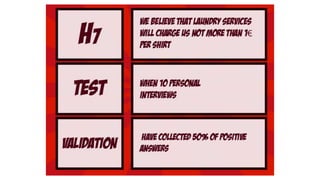
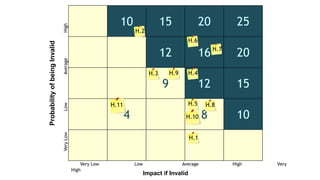

This document outlines a validation process for testing hypotheses. It presents an initial hypothesis and impact matrix to evaluate 11 hypotheses based on the potential impact if invalid and the probability of being invalid. The impact and probability are rated on a scale from very low to very high. The document aims to iteratively test and refine an initial hypothesis through validating additional hypotheses.


