A copy of Greater Burlington's labor characteristics report for the warehousing and distribution industry, including data on the number of workers with skills and experience in this industry segment, unemployment figures by industry, wage data, workforce preferences and workforce willing to change or accept employment.
A copy of Greater Burlington Iowa's 2013 food processing industry labor characteristics report, including at look at number of workers with skills and experience in this industry. The report also covers information used by many economic development and business expansion projects, including unemployment by industry segment, workforce willingness to accept or change employment, workforce preferences and wage data.
Students today consume, create and make sense of content via a range of mobile digital technologies. This workshop will discuss feedback from a classroom trial of iPads as well as exploring the innovative features the iPad and various Apps can play in enhancing and engaging students in learning.
A copy of the executive summary from our 2011 laborshed report. Greater Burlington has a laborshed of over 116,000 workers and a population within a 60 minute drive time of more than 200,000.
Absorbents Brochure from Oil Technics Ltd (OTL)Dave Holmes
Oil Technics Ltd (OTL): "There`s absorbents and then there is Oil Technics Ltd absorbents"
Everything you need to support your EMS/ISO14001 Pollution Prevention (Daily management of Leaks, weeps and spillages). For more information please contact: sales@oiltechnics.com or visit: www.oiltechnics.com
A copy of Greater Burlington Iowa's labor characteristics report for the biotech/bio processing industry related to food processing. The report contains information on the total workforce available with skills and experience, the workforce willing to change or accept employment, workforce preferences, wage data by occupational code, and other valuable laborshed data.
A copy of the 2014 Warehouse & Distribution Labor Characteristics Report for the Greater Burlington Partnership. The report features data and demographics information on this industry's total potential workforce (both employed and unemployed), including level of education, age, average wages, fringe benefits, willingness to change or accept employment, commute distance, and more. If your food processing business is looking to expand or relocate you'll want this information in order to evaluate our workforce availability.
Looking to site a new call center or back office processing facility? We've got a workforce available for you, as the unemployment rate for those with transferable skills and experience is over 14%. Our economic development team can help you evaluate potential facilities and incentives available in Greater Burlington Iowa.
A copy of the 2014 Plastics Manufacturing Labor Characteristics Report for the Greater Burlington Partnership. The report features data and demographics information on this industry's total potential workforce (both employed and unemployed), including level of education, age, average wages, fringe benefits, willingness to change or accept employment, commute distance, and more. If your plastics manufacturing company is looking to expand or relocate you'll want this information in order to evaluate our workforce availability.
A copy of the 2014 Advanced Manufacturing Labor Characteristics Report for the Greater Burlington Partnership. The report features data and demographics information on this industry's total potential workforce (both employed and unemployed), including level of education, age, average wages, fringe benefits, willingness to change or accept employment, commute distance, and more. If your advanced manufacturing business is looking to expand or relocate you'll want this information in order to evaluate our workforce availability.
How to Stand Out from the Pack with Credible Workforce Data - Part 1EMSI
In the first of a two-part webinar series geared towards economic developers, Bob Potts of the Nevada Governor’s Office of Economic Development discussed how he and his colleagues use EMSI workforce data to distinguish Nevada to site selectors and companies interested in the state. Bob walked through how he responds to RFIs and how data—particularly data on available labor—is increasingly vital.
A copy of the 2014 Food Processing Labor Characteristics Report for the Greater Burlington Partnership. The report features data and demographics information on this industry's total potential workforce (both employed and unemployed), including level of education, age, average wages, fringe benefits, willingness to change or accept employment, commute distance, and more. If your food processing business is looking to expand or relocate you'll want this information in order to evaluate our workforce availability.
Qualitative research on Milwaukee's 25 wealthiest ZIP codes group from Marshall Marketing's 2013 consumer survey PLUS news viewing for the same group based on Nielsen Feb'13 eVIP.
A copy of the 2014 Call Center Labor Characteristics Report for the Greater Burlington Partnership. The report features data and demographics information on this industry's total potential workforce (both employed and unemployed), including level of education, age, average wages, fringe benefits, willingness to change or accept employment, commute distance, and more. If your call center/back office business is looking to expand or relocate you'll want this information in order to evaluate our workforce availability
Pathways Institute panel presentation june 23, 2017-- What Will Bekfryda
How does a college know where to grow in order to meet future workforce needs? Dr. H. Jeffrey Rafn, president of Northeast Wisconsin Technical College, shares what research his college uses to stay ahead of the Midwest's workforce needs.
This report examines the opportunities for a call center/BPO company to locate in Greater Burlington Iowa. Greater Burlington has identified an available workforce of over 20,000 with skills and experience in call center and BPO related occupations. This workforce, combined with our low cost of business, available facilities, and existing telecommunications infrastructure provide a unique opportunity for an expanding business. We invited you to let our organization assist you in evaluating Greater Burlington for your next call center/BPO project.
A copy of the 2014 Laborshed Report for the Greater Burlington Partnership. The report features data and demographics information on the laborshed's workforce (both employed and unemployed), including level of education, age, average wages, fringe benefits, willingness to change or accept employment, commute distance, employment by industry and more. If your business is looking to expand or relocate you'll want this information in order to evaluate our workforce availability.
Want to know about incentives for expanding your business? You're in the right place. The Greater Burlington Partnership economic development team has organized this presentation to give you an overview of the incentives that could be available for business expansion in Greater Burlington, Iowa.
Warehousing & Distribution Labor Characteristics Report
1. ^_^_
£¤61
£¤218
£¤34
§¨¦80
§¨¦74
£¤63
£¤136
£¤67
Fairfield
Kahoka
Macomb
Muscatine
Carthage
Wapello
Monmouth
Mount Pleasant
Burlington
Galesburg
Donnellson
La Harpe
West Point
Niota
Wever
Dallas City
Danville
Keokuk
Sperry
Nauvoo
New London
Fort Madison Lomax
Gladstone
Middletown
Farmington
Columbus Junction
Farmington
Stronghurst
Oquawka
Kirkwood
West Burlington
Monmouth
Kirkwood
CLARK
SCOTLAND
ADAIR
CHUYLER
KNOX
FULTON
HANCOCK
HENRY
MERCER
WARREN
MCDONOUGH
HENDERSON
ROCK ISLAND
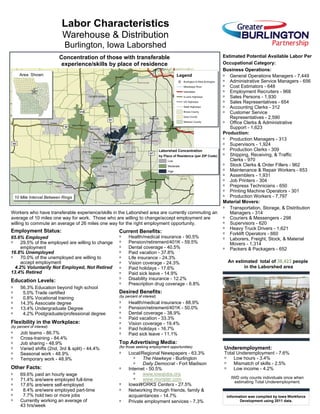
Concentration of those with transferable
experience/skills by place of residence
Workers who have transferable experience/skills in the Laborshed area are currently commuting an
average of 10 miles one way for work. Those who are willing to change/accept employment are
willing to commute an average of 26 miles one way for the right employment opportunity.
Current Benefits:
Health/medical insurance - 90.5%
Pension/retirement/401K - 59.5%
Dental coverage - 40.5%
Paid vacation - 37.8%
Life insurance - 24.3%
Vision coverage - 24.3%
Paid holidays - 17.6%
Paid sick leave - 14.9%
Disability insurance - 12.2%
Prescription drug coverage - 6.8%
Desired Benefits:
(by percent of interest)
Health/medical insurance - 88.9%
Pension/retirement/401K - 50.0%
Dental coverage - 38.9%
Paid vacation - 33.3%
Vision coverage - 19.4%
Paid holidays - 16.7%
Paid sick leave - 11.1%
Top Advertising Media:
(for those seeking employment opportunities)
Local/Regional Newspapers - 63.3%
The Hawkeye - Burlington
Daily Democrat - Fort Madison
Internet - 50.5%
www.iowajobs.org
www.monster.com
IowaWORKS Centers - 27.5%
Networking through friends, family &
acquaintances - 14.7%
Private employment services - 7.3%
Employment Status:
65.6% Employed
29.5% of the employed are willing to change
employment
16.8% Unemployed
70.0% of the unemployed are willing to
accept employment
4.2% Voluntarily Not Employed, Not Retired
13.4% Retired
Education Levels:
56.3% Education beyond high school
5.0% Trade certified
0.8% Vocational training
14.3% Associate degree
13.4% Undergraduate Degree
4.2% Postgraduate/professional degree
Flexibility in the Workplace:
(by percent of interest)
Job teams - 86.7%
Cross-training - 84.4%
Job sharing - 48.9%
Varied shifts (2nd, 3rd & split) - 44.4%
Seasonal work - 48.9%
Temporary work - 48.9%
Other Facts:
69.6% paid an hourly wage
71.4% are/were employed full-time
17.6% are/were self-employed
8.4% are/were employed part-time
7.7% hold two or more jobs
Currently working an average of
43 hrs/week
Information was compiled by Iowa Workforce
Development using 2011 data.
Underemployment:
Total Underemployment - 7.6%
Low hours - 3.4%
Mismatch of skills - 2.5%
Low income - 4.2%
IWD only counts individuals once when
estimating Total Underemployment.
Labor Characteristics
Warehouse & Distribution
Burlington, Iowa Laborshed
10 Mile Interval Between Rings
Estimated Potential Available Labor Per
Occupational Category:
Business Operations:
General Operations Managers - 7,449
Administrative Service Managers - 656
Cost Estimators - 648
Employment Recruiters - 968
Sales Persons - 1,930
Sales Representatives - 654
Accounting Clerks - 312
Customer Service
Representatives - 2,590
Office Clerks & Administrative
Support - 1,623
Production:
Production Managers - 313
Supervisors - 1,924
Production Clerks - 309
Shipping, Receiving, & Traffic
Clerks - 970
Stock Clerks & Order Fillers - 962
Maintenance & Repair Workers - 653
Assemblers - 1,931
Job Printers - 304
Prepress Technicians - 650
Printing Machine Operators - 301
Production Workers - 7,797
Material Movers:
Transportation, Storage, & Distribution
Managers - 314
Couriers & Messengers - 298
Supervisors - 620
Heavy Truck Drivers - 1,621
Forklift Operators - 660
Laborers, Freight, Stock, & Material
Movers - 1,314
Packers & Packagers - 652
An estimated total of 38,423 people
in the Laborshed area
Legend
^_ Burlington & West Burlington
Mississippi River
Interstates
4-Lane Highways
US Highways
State Highways
Illinois County
Iowa County
Missouri County
Laborshed Concentration
by Place of Residence (per ZIP Code)
Low
Moderate
High
Area Shown
2. Occupation
O
ccupationalC
ode
M
ean
W
age
Entry
W
age
Experienced
W
ageM
edian
W
age
Administrative Services Managers 11-3011 $ 32.49 $ 21.46 $ 38.00 $ 29.10
Assemblers and Fabricators, All Other 51-2099 $ 9.30 $ 8.04 $ 9.93 $ 8.82
Bookkeeping, Accounting, and Auditing Clerks 43-3031 $ 15.98 $ 10.67 $ 18.64 $ 14.55
Bus and Truck Mechanics and Diesel Engine Specialists 49-3031 $ 19.03 $ 13.44 $ 21.83 $ 16.98
Couriers and Messengers 43-5021 $ 8.52 $ 8.14 $ 8.71 $ 8.61
Customer Service Representatives 43-4051 $ 12.69 $ 8.47 $ 14.81 $ 9.64
Dispatchers, Except Police, Fire, and Ambulance 43-5032 $ 18.32 $ 13.79 $ 20.59 $ 19.29
First-Line Supervisors/Managers of Helpers, Laborers, and Material Movers, Hand 53-1021 $ 21.57 $ 14.33 $ 25.20 $ 21.37
First-Line Supervisors/Managers of Transportation and Material-Moving Machine and 53-1031 $ 22.78 $ 16.70 $ 25.82 $ 22.59
General and Operations Managers 11-1021 $ 44.67 $ 25.25 $ 54.38 $ 40.14
Helpers--Production Workers 51-9198 $ 11.52 $ 9.43 $ 12.57 $ 10.94
Human Resources, Labor Relations, and Training Specialists, All Other 13-1078 $ 20.74 $ 12.59 $ 24.83 $ 20.82
Industrial Production Managers 11-3051 $ 39.27 $ 23.72 $ 47.05 $ 34.71
Industrial Truck and Tractor Operators 53-7051 $ 15.42 $ 12.08 $ 17.09 $ 14.64
Inspectors, Testers, Sorters, Samplers, and Weighers 51-9061 $ 15.75 $ 11.60 $ 17.82 $ 14.87
Laborers and Freight, Stock, and Material Movers, Hand 53-7062 $ 13.55 $ 9.97 $ 15.33 $ 13.17
Logisticians 13-1051 $ 26.33 $ 18.52 $ 30.24 $ 25.51
Logisticians 13-1081 $ 30.64 $ 25.44 $ 33.25 $ 29.30
Maintenance and Repair Workers, General 49-9071 $ 17.74 $ 11.99 $ 20.61 $ 17.20
Office and Administrative Support Workers, All Other 43-9199 $ 14.97 $ 9.51 $ 17.70 $ 14.23
Office Clerks, General 43-9061 $ 14.00 $ 10.01 $ 16.01 $ 13.43
Packaging and Filling Machine Operators and Tenders 51-9111 $ 12.82 $ 8.88 $ 14.80 $ 12.69
Packers and Packagers, Hand 53-7064 $ 11.79 $ 10.62 $ 12.38 $ 11.36
Prepress Technicians and Workers 51-5111 $ 14.69 $ 12.67 $ 15.70 $ 14.28
Production Workers, All Other 51-9199 $ 13.75 $ 10.73 $ 15.25 $ 13.19
Production, Planning, and Expediting Clerks 43-5061 $ 21.47 $ 15.44 $ 24.48 $ 20.99
Purchasing Agents, Except Wholesale, Retail, and Farm Products 13-1023 $ 25.68 $ 17.93 $ 29.56 $ 25.53
Sales and Related Workers, All Other 41-9099 $ 19.65 $ 8.54 $ 25.20 $ 13.43
Sales Representatives, Wholesale and Manufacturing, Except Technical and Scientific 41-4012 $ 23.72 $ 12.41 $ 29.38 $ 19.94
Sales Representatives, Wholesale and Manufacturing, Technical and Scientific Products 41-4011 $ 33.24 $ 23.07 $ 38.31 $ 26.78
Shipping, Receiving, and Traffic Clerks 43-5071 $ 15.25 $ 11.69 $ 17.03 $ 14.60
Stock Clerks and Order Fillers 43-5081 $ 11.70 $ 8.39 $ 13.36 $ 10.43
Transportation, Storage, and Distribution Managers 11-3071 $ 33.10 $ 22.10 $ 38.60 $ 31.86
Truck Drivers, Heavy and Tractor-Trailer 53-3032 $ 16.53 $ 9.92 $ 19.85 $ 14.82
Truck Drivers, Light or Delivery Services 53-3033 $ 16.71 $ 9.18 $ 20.48 $ 15.21
Weighers, Measurers, Checkers, and Samplers, Recordkeeping 43-5111 $ 15.16 $ 11.15 $ 17.16 $ 16.25
Wholesale and Retail Buyers, Except Farm Products 13-1022 $ 22.77 $ 16.98 $ 25.65 $ 18.55
Greater Burlington Partnership
610 North 4th Street, Suite 200
Burlington, Iowa 52601
Phone: 319-752-6365
Fax: 319-752-6454
www.greaterburlington.com
The 2012 Iowa Wage data for Iowa Workforce Development Region 16 (Des Moines, Henry, Lee and Louisa Counties) was produced by the Labor
Force & Occupational Analysis Bureau to provide communities local information on wages by occupation. The source of the wage and employment
data is based on the May 2011 OES estimates. Additional occupational wage and employment data can be found at http://iwin.iwd.state.ia.us/iowa/
OlmisZine.