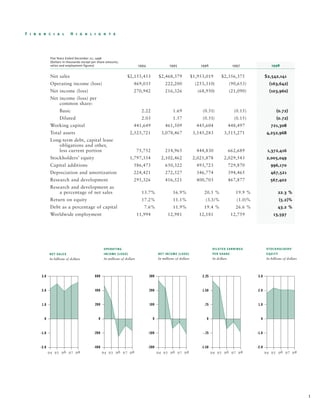
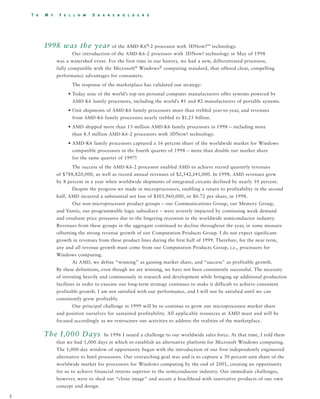
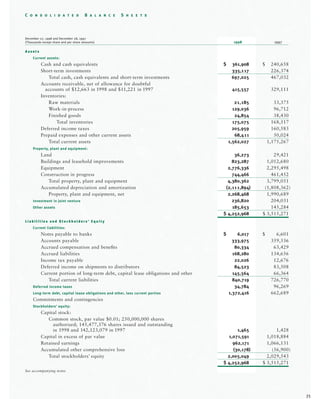
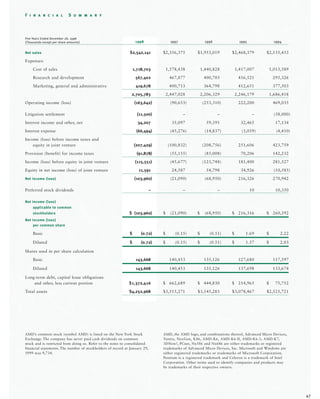
This document provides financial highlights for a company over a five year period from 1994-1998. It shows that while revenue grew steadily, peaking in 1998 at $2.54 billion, the company experienced significant net losses each year from 1996-1998, with a net loss of $104 million in 1998. Research and development spending increased each year but the company struggled with losses in non-microprocessor divisions that offset gains in their computation products group. The company achieved record revenue in 1998 but still had significant losses due to high investment in R&D and new production facilities needed to execute their long term strategy.
This document is AMD's 1999 Annual Report which provides an overview of the company's financial performance and operations. Some key points:
1) AMD had record revenue in Q4 1999 but overall posted a net loss for the year as it faced significant challenges from Intel in the PC processor market.
2) The introduction of the AMD Athlon processor was a success and helped AMD gain market share in the higher-performance PC processor sector.
3) AMD's focus is on the growing Flash memory and PC processor markets where it aims to compete with industry leader Intel by forming strategic partnerships and alliances.
Simmons First National Corporation reported earnings of $5.2 million for the first quarter of 2009, down from $0.45 per share in the same period in 2008. The company's net interest income increased 2.6% year-over-year due to strategic initiatives to grow core deposits while reducing reliance on time deposits. Asset quality remained strong with non-performing assets at 0.80% of total assets.
Parker Hannifin Corporation 2003 Annual Report
The document is Parker Hannifin Corporation's 2003 Annual Report. It summarizes Parker's financial performance for fiscal year 2003, with net sales of $6.41 billion and net income of $196.27 million. It also provides an overview of Parker's global operations, strategies to drive growth, and examples of innovation across various industries.
The document provides selected financial data for The TJX Companies, Inc. for fiscal years 1997 through 2001. It includes:
1) Income statement and per share data showing increasing net sales, income from continuing operations, and diluted earnings per share each year.
2) Balance sheet data with total assets exceeding $2.9 billion in 2001, and shareholders' equity growing from $1.1 billion in 1997 to $1.2 billion in 2001.
3) Details on the number of stores in operation for each of the company's brands, totaling over 1,493 stores by 2001.
The document is PETsMART's 2002 annual report. It summarizes that in 2002:
- PETsMART grew its total sales to $2.7 billion and net income increased to $88.9 million.
- Margins increased to 29.2% and pet services sales grew 29%.
- The company completed transforming its stores into the new format and building out its distribution system.
- Going forward, PETsMART plans to focus on growing pet services, testing new concepts like pet boarding, and continuing to improve customer experience.
Granite Company Overview 2013 | Nationwide Voice and Data for BusinessesShane Hoff
Granite is one of the premier telecommunications solutions providers for businesses across the United States and Canada, servicing more than 70 Fortune 100 companies. Granite offers dial-tone, infrastructure solutions, advanced data services, broadband, and security services to our customers at significant savings. Some of the key benefits of Granite’s solutions include: Consolidated billing and support, Nationwide coverage in the US and Canada, Optimized for multi-location companies
Ecolab's 2005 annual report provides the following information:
1) Ecolab is the leading global provider of cleaning and sanitizing products and services, serving customers in over 160 countries.
2) In 2005, Ecolab reported net sales of $4.5 billion, a 8% increase from 2004, and net income of $319 million, a 13% increase.
3) Ecolab aims to provide comprehensive solutions and service to customers in industries like hospitality, healthcare, food processing, and commercial laundries.
The document is MGM MIRAGE's 2007 annual report detailing their CityCenter project in Las Vegas. It describes the various components of CityCenter, including hotels, condo towers, retail space, and financial highlights. Some key points:
- CityCenter is a 76-acre, $18 billion privately funded project, the largest in US history. It includes multiple hotels, condo towers, and retail space designed by renowned architects.
- ARIA is a 61-story, 4,000 room hotel and conference center. Vdara is a 57-story condo-hotel tower with over 1,500 units. Other components include condo towers, hotels, retail space, and entertainment venues.
Ecolab is a global leader in cleaning, sanitizing, pest elimination, maintenance and repair products and services. It serves customers in over 160 countries across various industries including hospitality, foodservice, healthcare, industrial and commercial markets. Ecolab employs over 22,000 people worldwide and had $4.5 billion in net sales in 2005. It markets its products and services through the largest direct sales force in its industry.
This document is Bed Bath & Beyond's 2006 annual report and proxy statement. It provides financial highlights from fiscal year 2006, which ended on March 3, 2007. Some key points include:
- Net earnings for FY2006 were $2.09 per diluted share, an increase of 8.9% from the previous year.
- Net sales increased 13.9% to approximately $6.6 billion.
- Comparable store sales increased 4.9% in FY2006.
- The company opened 74 new Bed Bath & Beyond stores and ended the year with 888 stores total.
1) This document is the 2007 Annual Report, Notice of Annual Meeting, and Proxy Statement for Bed Bath & Beyond.
2) In fiscal 2007, Bed Bath & Beyond saw net sales increase 6.5% to $7.049 billion and net earnings of $2.10 per diluted share, compared to $2.09 per share the previous year.
3) The company continued its expansion, opening 66 new Bed Bath & Beyond stores and its first international store in Canada. It also operated 41 Christmas Tree Shops stores and 9 buybuy BABY stores.
This document is the annual report for Electronics Boutique Holdings Corp for fiscal year 2003. It summarizes the company's financial performance for the year, including record total revenues of $1.316 billion, record net income of $32.6 million, and comparable store sales growth of 8.3%. It highlights how the company focused exclusively on interactive entertainment, launched a rebranding under the EB Games name, and expanded its pre-owned software business to drive margin growth. The company leveraged these strategic moves to gain market share and deliver strong financial results despite heightened retail competition.
This document provides a 10-year summary of key financial and operational metrics for Canon Group from 2002-2011. It includes information on net sales, income, assets, sales by business segment and geographic region, R&D spending, capital expenditures, employee numbers, and stock price information. Canon has seen overall growth in most metrics over the past decade, with net sales peaking in 2007 before declining during the economic downturn but recovering in recent years. Office products has consistently been the largest business segment by sales. The US and Europe are the top markets after Japan. Canon also ranked among the top 10 companies receiving US patents each year.
The document contains revenue projections for two divisions (A and B) of a company across multiple scenarios from 2009-2018. It includes assumptions about revenue growth rates, projected revenues, additional sources of revenue from licensing and grants, manufacturing and operating expenses, and cash flow statements. The key information is revenue and cost projections for two divisions under different growth scenarios from 2009-2018.
This annual report summarizes the financial highlights of The Sherwin-Williams Company for 2006. Net sales increased 8.6% to $7.8 billion and net income increased 24% to $576 million. Earnings per share increased 27.7% to $4.19. The company invested $209.9 million in capital expenditures and increased its dividend for the 28th consecutive year. The Chairman and CEO reported that 2006 was another record year for sales, earnings, and net operating cash.
This document is Banco Indusval Multistock's 2009 annual report. It provides an overview of the bank's corporate profile, main indicators such as financial results and balance sheet information from 2005-2009, and performance metrics. It also includes information on the number of employees, branches, shares, and shareholder returns. The report discusses how challenges in 2009 led the bank to reflect on its business and identify opportunities to improve processes and positioning for long term growth.
Parker is the world's leading manufacturer of motion and control technologies, providing precise engineered solutions across commercial, industrial, and aerospace markets. For fiscal year 1999, Parker reported record sales of $4.96 billion, income from operations of $538.7 million, and net income of $310.5 million, despite a softening in industrial demand. Parker is strategically diversified across industries and geographies, with no single customer accounting for more than 4% of sales, positioning it for continued global growth.
The document is Bed Bath & Beyond's 2005 annual report, notice of annual meeting, and proxy statement. It summarizes the company's strong financial performance in fiscal 2005, with record net earnings of $1.92 per share, 12.9% sales growth, and 4.6% comparable store sales growth. It also discusses returning $600 million to shareholders through a share repurchase program, and expanding the store base to 809 total stores across the Bed Bath & Beyond, Christmas Tree Shops, and Harmon brands. The report aims to present shareholders with the required annual information in a straightforward and cost-efficient manner.
Quest Diagnostics provides a calculation of non-GAAP financial measures included in their June 30, 2005 earnings release. They define free cash flow as net cash from operating activities less capital expenditures. They also provide reconciliations of net income and operating income before special charges for the three and six months ended June 30, 2004, excluding charges related to pension obligations and debt refinancing, in order to provide a meaningful measure of ongoing performance.
- Advanced Micro Devices, Inc. (AMD) filed an annual report on Form 10-K with the SEC for the fiscal year ended December 27, 2008.
- In 2008, AMD decided to divest its Digital Television and Handheld business units and completed the sale of its Digital Television business to Broadcom for $141.5 million.
- AMD entered into an agreement to form a manufacturing joint venture called The Foundry Company with Advanced Technology Investment Company to manufacture AMD's semiconductor products in exchange for AMD assets valued at $1.4 billion and $700 million in cash from ATIC.
The Pantry, Inc. is the leading independently operated convenience store chain in the southeastern United States. In 2003, The Pantry significantly improved its financial performance and took strategic steps to position itself for future growth. It completed a store reset program, negotiated new gasoline supply agreements, and acquired 138 Golden Gallon stores in Georgia and Tennessee. These initiatives strengthened The Pantry's operations and brand, and set the stage for continued growth and profitability going forward.
WESCO International, Inc. reported record financial results for 2006, with net sales increasing 20% to $5.32 billion and net income more than doubling to $217 million. The company's core electrical products distribution business drove excellent performance, as continued process improvements led to increased productivity and profitability. WESCO also integrated recent acquisitions, including Communications Supply Corporation, and expects additional acquisitions will be completed to further expansion. Looking ahead, the company is well positioned for continued growth with favorable market conditions and numerous opportunities identified for further performance gains.
Advanced Micro Devices reported a net loss of $1.77 billion for Q4 2007, compared to a net loss of $396 million in Q3 2007 and $576 million in Q4 2006. Revenue increased slightly to $1.77 billion from $1.63 billion the previous quarter but was flat compared to $1.77 billion in the same quarter last year. Gross margin declined to 44% from 41% last quarter due to higher costs. Operating losses increased substantially to $1.68 billion from $226 million last quarter due to a $1.61 billion goodwill impairment charge. Adjusted EBITDA was $203 million compared to $60 million in Q3 2007 and $169 million in Q4 2006
The Pantry, Inc. 2001 Annual Report summarizes the company's strategic moves in fiscal 2001 to strengthen its future. Despite challenges from rising gas prices and economic downturn, the company streamlined processes, enhanced efficiency, and implemented technology initiatives like new reporting and inventory systems. It acquired 45 stores to strengthen its market position but curtailed aggressive expansion. The Pantry focused on cost cuts, improving merchandise sales, and leveraging new fuel pricing systems to balance profits and volume in a volatile gas market. It positioned itself to capitalize on future growth opportunities once market conditions improve.
This annual report summarizes WESCO International's financial results for 2004. Key points include:
- Net sales increased 14% to $3.74 billion, income from operations more than doubled to $149.4 million, and net income increased over 100% to $64.9 million.
- Improving economic conditions benefited industrial, utility, and construction markets. Organic sales growth of 14% was achieved through new customers and increased sales to existing customers across multiple market segments.
- Record levels of productivity and efficiency resulted in sales per employee increasing 15% to $696,000 and operating profit per employee rising 74% to $28,000.
- Opportunities for further growth
This document is AMD's 1999 Annual Report which provides an overview of the company's financial performance from 1995-1999. Some key details include:
- AMD produces microprocessors, memory devices, and circuits for telecommunications. It has manufacturing facilities worldwide.
- In 1999, net sales were $2.86 billion but the company reported a net loss of $88.9 million. R&D spending increased to $635.8 million.
- A highlight was the launch of the AMD Athlon processor in early 1999, demonstrating AMD's commitment to doubling processor performance every 18 months.
This annual report summarizes Reliance Steel & Aluminum Co.'s financial performance for 2005. Some key highlights include:
- Record sales of $3.4 billion for 2005, up 14% from 2004.
- Record net income of $205.4 million for 2005, up 21% from 2004.
- Best-ever earnings per diluted share of $6.21 for 2005, up from $5.19 in 2004.
- The company announced plans to acquire Earle M. Jorgensen Company for $934 million to expand its geographic reach, product offerings, and customer base.
Venture Capitalist competition Analysis Team Lollapaloozadoshihardik
This document summarizes financial projections for a company that produces and sells polysensors and sensor cartridges from 2008-2010. It projects increasing sales but declining operating margins over this period. Key metrics like ROE, sales to book value, EPS are provided. The document also outlines an investment strategy for the company that includes providing both equity and debt financing with terms like interest rates, required sales and ROE benchmarks. Manufacturing costs and assumptions about expenses, depreciation, tax rates and R&D spending are defined.
The world's leading provider of computer-aided design, business and manufacturing software solutions tailored for the interior design and furniture industries.
This document contains quarterly consolidated income statements for Peabody Energy Corporation for 2004 through the first quarter of 2007. It shows revenues, costs, operating profits, income before taxes, net income and earnings per share on a quarterly and annual basis. Key figures included are total revenues, operating costs and expenses, depreciation costs, operating profits, interest expenses and income, income before taxes, net income and earnings per share.
Allstate's revenues increased 4% to $27 billion in 1999. Operating income decreased 19% to $2.1 billion due to higher costs and charges from acquisitions and restructuring. Net income fell 17% to $2.7 billion. Investments grew 5% to $69.6 billion. In Property-Liability, premiums written rose 5% to $20.4 billion and underwriting income decreased 60% to $527 million due to increased losses and expenses.
The document is Coventry Healthcare's 2006 Annual Report. It discusses Coventry's business strategy and financial performance in 2006. Key points include:
- Coventry organized its business into three divisions - Commercial, Individual/Government, and Specialty - to capitalize on growth opportunities.
- The Commercial division continued strong growth while maintaining industry-leading margins.
- The Individual/Government division saw significant growth from the new Medicare Part D program and expanding Medicaid and individual businesses.
- All divisions performed well financially in 2006, with revenues reaching a record $7.7 billion and earnings continuing to grow.
The Chairman notes that ABC Holdings performed well in 2010, reflecting the improved economic environment across its markets following the global financial crisis recovery. All of the Group's banking operations reported profits for the first time. Retail banking is now offered and expected to contribute positively to income going forward. Overall, economic growth in Sub-Saharan Africa was revised upwards to 5% in 2010 and is projected to accelerate to 5.5% in 2011, though risks remain from commodity prices and political instability. The performance reflects the Group's decision to curtail lending during the recession, which reduced credit impairments.
Big Lots is a retail company that offers brand-name merchandise at discounted prices. In 2003, Big Lots saw a 7.9% increase in net sales compared to 2002. Net income increased 12.4% while earnings per share rose 10.6%. The company operates over 1,400 stores across the United States and aims to provide customers with great deals through closeout products and bargains in a unique shopping environment.
The annual report summarizes the Social Security System's (SSS) operations and financial performance in 2009. It achieved growth in revenues, assets, and reserves while benefit payments also increased. The SSS aims to develop a viable, universal, and equitable social protection system through world-class service as spelled out in its mission and vision statements.
Reliance Steel & Aluminum Co. reported strong financial performance in 2006 with increased sales, gross profit, operating profit, net income, and EBITDA compared to prior years. The company saw opportunities for continued growth and success. Key financial data such as income, expenses, earnings per share, cash flow, and assets all increased substantially from 2002 to 2006, demonstrating the company's ongoing financial strength.
This document provides an overview and financial analysis of a corporation. It discusses the corporation's business strategy of focusing on investment management, asset servicing, and banking for institutional and affluent individual clients. It then summarizes the corporation's strong financial performance in 2006, with record net income of $665.4 million and revenue growth of 14%. Key metrics like assets under management and custody also reached record levels. The document analyzes the components of the corporation's revenues and expenses.
1. The document provides background information on Eastboro Machine Tools Corporation, founded in 1923 and initially manufacturing metal presses and dies.
2. It discusses three proposed strategies for growth: shifting production mix, expanding internationally, and expanding through joint ventures and acquisitions.
3. It analyzes choices of action - stock buyback, advertising, and different dividend payout policies (0%, 15%, 20%, 40%, residual) - and their impact on excess cash over seven years based on sales and income projections. It concludes residual dividend policy allows reducing debt and making investments for growth.
Ecolab is a leading global developer and marketer of cleaning, sanitizing, pest elimination, maintenance and repair products and services. It serves the hospitality, foodservice, institutional and industrial markets. In 2003, Ecolab reported net sales of $3.76 billion, net income of $277 million, and diluted net income per share of $1.06. Ecolab is headquartered in St. Paul, Minnesota and employs over 20,000 associates worldwide serving customers in hotels, restaurants, healthcare facilities, grocery stores, and other industries.
1) This document is the 2007 Annual Report, Notice of Annual Meeting, and Proxy Statement for Bed Bath & Beyond.
2) In fiscal 2007, Bed Bath & Beyond saw net sales increase 6.5% to $7.049 billion and net earnings of $2.10 per diluted share, compared to $2.09 per share the previous year.
3) The company continued its expansion, opening 66 new Bed Bath & Beyond stores and its first international store in Canada. It also invested in new distribution centers and systems to support continued growth.
This document is Bed Bath & Beyond's 2005 Annual Report, which includes their Notice of Annual Meeting and Proxy Statement. It discusses Bed Bath & Beyond's financial highlights for fiscal year 2005, including a 16.4% increase in net earnings per share compared to 2004. It encourages shareholders to vote electronically to save the company money. It also provides instructions for electronic delivery of annual reports and proxy statements to further reduce costs.
Infosys has consistently grown revenues and EPS at high double digit rates between 2002 and 2012, with revenues growing at a 32.7% CAGR and EPS growing at 28.2% CAGR. Infosys has also maintained a high return on equity of around 30% with no long term debt. Despite this strong financial performance, Infosys is currently trading at a discount to its peers Wipro and Cognizant based on its price-to-earnings ratio when adjusted for its higher cash balance per share.
Ecolab is a leading global provider of cleaning, sanitizing, maintenance and repair products and services. It serves customers in over 160 countries across various industries such as hospitality, foodservice, healthcare, retail and industrial markets. In 2004, Ecolab reported net sales of $4.2 billion, an 11% increase over 2003. It continues to invest in innovative products and services to help customers improve their operations and protect their reputations.
This document is Coventry Healthcare's 2004 annual report. It discusses Coventry's acquisition of First Health Group Corp in late 2004, which combined Coventry's local health plans with First Health's national provider network. It highlights Coventry's growth between 2000-2004, with revenues increasing from $2.6 billion to $5.3 billion and earnings per share growing from $0.69 to $3.72 over the period. The chairman reflects on Coventry's success in growing from a small regional managed care company into a national leader, driven by operating in the right business with disciplined cost management.
- ALLTEL reported increased revenues and operating income for the third quarter and first nine months of 2004 compared to the same periods in 2003.
- Wireless revenues grew 7% in the quarter and 6% year-to-date, while wireline revenues were flat in the quarter and declined slightly year-to-date.
- Operating income increased 6% in the quarter and was flat year-to-date, with gains in wireless and wireline offset by declines in other segments.
Charter Communications held an earnings call presentation on May 3, 2007 to discuss their quarterly results and outlook. The presentation included the following:
1) Charter reported strong momentum in the first quarter of 2007 with the highest revenue, adjusted EBITDA, and RGU growth in several years driven by increased bundling of services and growth in value-added services.
2) Bundled customers increased to 41% of total customers in the first quarter of 2007 compared to 34% in the prior year. Telephone services passed increased significantly year-over-year and telephone customers more than doubled.
3) Financial results showed 10.7% revenue growth and 13.2% adjusted EBITDA growth year-
Charter Communications held an earnings call presentation on May 3, 2007 to discuss their first quarter 2007 results. The presentation included the following key points:
1) Charter experienced strong momentum in the first quarter of 2007 with the highest revenue, adjusted EBITDA, and RGU growth in over four years driven by increased bundling of services and growth in value-added services.
2) Bundling of video, internet, and telephone services increased customer penetration and ARPU, with bundled customers rising to 41% of total customers in the first quarter of 2007 compared to 34% in the first quarter of 2006.
3) Telephone services continued to show strong growth with homes passed increasing 86% compared to the
Charter Communications reported strong financial results for the second quarter of 2007, with double-digit revenue and adjusted EBITDA growth driven by increases in high-speed internet and telephone customers. Revenue grew 11% year-over-year to $1.498 billion, while adjusted EBITDA rose 11% to $539 million. The company saw strong growth in its bundled customer base and average revenue per user. Charter also continued the expansion of its advanced services such as HD and DVR set-top boxes.
Charter Communications reported financial results for the second quarter of 2007 that showed double-digit revenue and adjusted EBITDA growth compared to the second quarter of 2006. Revenue grew 11% due to increases in high-speed internet, telephone, and commercial business, while adjusted EBITDA rose 11%. The company added 166,300 total RGUs in the quarter, up 47% year-over-year, driven by growth in digital video, high-speed internet, and telephone customers. Bundled customers grew 17.7% and now make up 42% of total customers.
charter communications 4Q2007_Earnings_Presentation_vFINALfinance34
This document is the transcript from Charter Communications' 4th quarter and full year 2007 earnings call. It includes:
1) Charter Communications reported consistent revenue and adjusted EBITDA growth in the 4th quarter and full year 2007, driven by strategies to increase bundling penetration and improve customer experience.
2) The company grew revenue from high-speed internet and telephone services through customer growth and increasing ARPU. Bundling phone with cable services drove faster growth and improved customer retention.
3) Charter reduced its debt maturities through 2012 to $367 million and expects adequate liquidity through 2009 to continue investing in growth opportunities and improving service.
charter communications 4Q2007_Earnings_Presentation_vFINALfinance34
This document summarizes Charter Communications' 4th quarter and full year 2007 earnings call. It discusses the company's consistent revenue and adjusted EBITDA growth over the past five quarters. Key highlights include double-digit annual revenue growth driven by increases in high-speed internet and telephone customers. The company has focused on strategies like bundling multiple services and improving the customer experience to generate sustainable growth.
charter communications 1Q_2008_Earnings_Presentationfinance34
Charter Communications reported first quarter 2008 results. Revenue grew 10.5% to $1.56 billion driven by strong growth in high-speed internet, telephone, and commercial customers. Adjusted EBITDA also increased 10.5% to $545 million. The company added over 302,000 customers during the quarter and nearly doubled telephone customers year-over-year. Charter aims to continue growing revenue and adjusted EBITDA through bundling video, internet, and telephone services and increasing penetration of triple play customers.
charter communications 1Q_2008_Earnings_Presentationfinance34
Charter Communications reported first quarter 2008 results. Revenue grew 10.5% to $1.56 billion driven by increases in high-speed internet, telephone, and commercial customers. Adjusted EBITDA also increased 10.5% to $545 million. The company added over 302,000 customers during the quarter and nearly doubled telephone customers year-over-year to 1.1 million. Charter aims to continue growing revenue and adjusted EBITDA through bundling video, internet, and telephone services and increasing penetration of triple play packages.
charter communications 2Q_2008_Earnings_Presentation_FINALfinance34
Charter Communications reported second quarter 2008 earnings. Revenue grew 8.9% year-over-year to $1.623 billion driven by balance of rate and volume increases. Adjusted EBITDA increased 10.1% year-over-year to $591 million and the margin expanded 40 basis points to 36.4%. Total customer relationships grew 6% year-over-year with a focus on bundling video, internet, and telephone services and increasing penetration of advanced offerings.
charter communications 2Q_2008_Earnings_Presentation_FINALfinance34
Charter Communications held its second quarter 2008 earnings call on August 5, 2008. The presentation included forward-looking statements and discussed Charter's second quarter 2008 financial results. Key highlights included 8.9% revenue growth and 10.1% adjusted EBITDA growth. Charter saw increases in video, high-speed internet, and telephone customers. Bundled customer penetration reached 50% in the second quarter.
charter communications 3Q_2008_Earnings_Presentation_vFINALfinance34
Charter Communications held its third quarter 2008 earnings call on November 6, 2008. The document provides a cautionary statement regarding forward-looking statements made on the call. It notes that while Charter believes its plans, intentions and expectations are reasonable, actual results could differ materially due to risks and uncertainties. It lists some key risk factors that could cause results to differ from forward-looking statements.
charter communications 3Q_2008_Earnings_Presentation_vFINALfinance34
Charter Communications held its third quarter 2008 earnings call on November 6, 2008. The document provides a cautionary statement regarding forward-looking statements made on the call. It notes that while Charter believes its plans, intentions and expectations are reasonable, actual results could differ materially due to risks and uncertainties. The document lists some key risk factors that could cause actual results to differ from forward-looking statements.
This document is a proxy statement from Charter Communications providing information about the company's upcoming annual shareholder meeting. It details that shareholders will vote on the election of one Class A/Class B director and provides information about voting procedures. The sole nominee for the Class A/Class B director position is Ronald L. Nelson. The proxy statement also provides details about the meeting such as the voting eligibility requirements, proxy voting instructions, how to attend the meeting, and who is paying for the solicitation of proxies.
This document is a proxy statement from Charter Communications providing information for its upcoming annual shareholder meeting. It summarizes that shareholders will vote on one director nominee, Ronald L. Nelson, to serve as the Class A/Class B director on the board. It provides details on voting procedures and requirements. The other six board members will be elected solely by the Class B shareholder, Paul Allen.
Charter's broadband network provides the capacity to deliver high-speed internet access, digital video services, and interactive programming to millions of customers. Upgrading systems to broadband allows Charter to offer customers more choices through new digital services while generating new revenue streams. Charter is well-positioned for continued growth and success as the demand for broadband services increases and more applications are developed that utilize the network's massive bandwidth.
Charter Communications is the fourth largest cable television operator in the United States, serving over 6 million customers across 11 regions. The company believes that cable broadband will be the primary means of delivering new services like video, data, and voice to homes and businesses. Charter aims to deliver the full potential of broadband and provide superior customer service. The company has grown through 32 acquisitions since 1994 and successfully integrates new systems by empowering local managers and improving technology and marketing.
This document is a proxy statement from Charter Communications providing information about voting at the company's upcoming annual shareholder meeting. It outlines the items to be voted on including electing one Class A/Class B director, ratifying the 1999 Option Plan, and approving the 2001 Incentive Plan. It provides details on shareholder voting eligibility, the director nomination process, and vote requirements for passing each proposal. Shareholders are asked to vote by proxy in advance of the meeting.
- The document is Charter Communications' 2001 proxy materials and 2000 financial report. It includes information about the upcoming annual shareholder meeting such as voting procedures, director nominees, and proposals to be voted on.
- Shareholders will vote on the election of one Class A/Class B director, ratification of the 1999 Option Plan, and approval of the 2001 Incentive Plan.
- The proxy statement provides details on voting procedures, who is eligible to vote, what votes are required to pass each item, and how to complete and submit proxy cards.
Charter Communications exceeded its ambitious financial goals and customer growth targets for 2000. The company integrated millions of new customers and thousands of employees from acquisitions, while accelerating its rollout of digital cable, high-speed internet, and video on demand services. Charter's aggressive expansion strategy has positioned it as an industry leader, with operating cash flow and customer growth significantly outpacing competitors. Going forward, Charter will continue investing in its broadband network and pursuing new acquisition opportunities to further its vision of delivering advanced interactive services to homes and businesses.
Charter Communications had a very successful year in 2000:
1) They exceeded their ambitious financial goals, achieving significant revenue and cash flow growth through acquisitions and expansion of their broadband network and advanced services.
2) They reached over 1 million digital cable customers, accelerated their broadband network buildout, and were recognized as industry leaders in key performance metrics.
3) Looking ahead, Charter plans to continue growing organically and through acquisitions to attract more customers and capitalize on their technological lead in interactive digital services delivered over their high-speed broadband network.
2. Elemental Economics - Mineral demand.pdfNeal Brewster
After this second you should be able to: Explain the main determinants of demand for any mineral product, and their relative importance; recognise and explain how demand for any product is likely to change with economic activity; recognise and explain the roles of technology and relative prices in influencing demand; be able to explain the differences between the rates of growth of demand for different products.
Solution Manual For Financial Accounting, 8th Canadian Edition 2024, by Libby...Donc Test
Solution Manual For Financial Accounting, 8th Canadian Edition 2024, by Libby, Hodge, Verified Chapters 1 - 13, Complete Newest Version Solution Manual For Financial Accounting, 8th Canadian Edition by Libby, Hodge, Verified Chapters 1 - 13, Complete Newest Version Solution Manual For Financial Accounting 8th Canadian Edition Pdf Chapters Download Stuvia Solution Manual For Financial Accounting 8th Canadian Edition Ebook Download Stuvia Solution Manual For Financial Accounting 8th Canadian Edition Pdf Solution Manual For Financial Accounting 8th Canadian Edition Pdf Download Stuvia Financial Accounting 8th Canadian Edition Pdf Chapters Download Stuvia Financial Accounting 8th Canadian Edition Ebook Download Stuvia Financial Accounting 8th Canadian Edition Pdf Financial Accounting 8th Canadian Edition Pdf Download Stuvia
Independent Study - College of Wooster Research (2023-2024) FDI, Culture, Glo...AntoniaOwensDetwiler
"Does Foreign Direct Investment Negatively Affect Preservation of Culture in the Global South? Case Studies in Thailand and Cambodia."
Do elements of globalization, such as Foreign Direct Investment (FDI), negatively affect the ability of countries in the Global South to preserve their culture? This research aims to answer this question by employing a cross-sectional comparative case study analysis utilizing methods of difference. Thailand and Cambodia are compared as they are in the same region and have a similar culture. The metric of difference between Thailand and Cambodia is their ability to preserve their culture. This ability is operationalized by their respective attitudes towards FDI; Thailand imposes stringent regulations and limitations on FDI while Cambodia does not hesitate to accept most FDI and imposes fewer limitations. The evidence from this study suggests that FDI from globally influential countries with high gross domestic products (GDPs) (e.g. China, U.S.) challenges the ability of countries with lower GDPs (e.g. Cambodia) to protect their culture. Furthermore, the ability, or lack thereof, of the receiving countries to protect their culture is amplified by the existence and implementation of restrictive FDI policies imposed by their governments.
My study abroad in Bali, Indonesia, inspired this research topic as I noticed how globalization is changing the culture of its people. I learned their language and way of life which helped me understand the beauty and importance of cultural preservation. I believe we could all benefit from learning new perspectives as they could help us ideate solutions to contemporary issues and empathize with others.
Vicinity Jobs’ data includes more than three million 2023 OJPs and thousands of skills. Most skills appear in less than 0.02% of job postings, so most postings rely on a small subset of commonly used terms, like teamwork.
Laura Adkins-Hackett, Economist, LMIC, and Sukriti Trehan, Data Scientist, LMIC, presented their research exploring trends in the skills listed in OJPs to develop a deeper understanding of in-demand skills. This research project uses pointwise mutual information and other methods to extract more information about common skills from the relationships between skills, occupations and regions.
Optimizing Net Interest Margin (NIM) in the Financial Sector (With Examples).pdfshruti1menon2
NIM is calculated as the difference between interest income earned and interest expenses paid, divided by interest-earning assets.
Importance: NIM serves as a critical measure of a financial institution's profitability and operational efficiency. It reflects how effectively the institution is utilizing its interest-earning assets to generate income while managing interest costs.
Fabular Frames and the Four Ratio ProblemMajid Iqbal
Digital, interactive art showing the struggle of a society in providing for its present population while also saving planetary resources for future generations. Spread across several frames, the art is actually the rendering of real and speculative data. The stereographic projections change shape in response to prompts and provocations. Visitors interact with the model through speculative statements about how to increase savings across communities, regions, ecosystems and environments. Their fabulations combined with random noise, i.e. factors beyond control, have a dramatic effect on the societal transition. Things get better. Things get worse. The aim is to give visitors a new grasp and feel of the ongoing struggles in democracies around the world.
Stunning art in the small multiples format brings out the spatiotemporal nature of societal transitions, against backdrop issues such as energy, housing, waste, farmland and forest. In each frame we see hopeful and frightful interplays between spending and saving. Problems emerge when one of the two parts of the existential anaglyph rapidly shrinks like Arctic ice, as factors cross thresholds. Ecological wealth and intergenerational equity areFour at stake. Not enough spending could mean economic stress, social unrest and political conflict. Not enough saving and there will be climate breakdown and ‘bankruptcy’. So where does speculative design start and the gambling and betting end? Behind each fabular frame is a four ratio problem. Each ratio reflects the level of sacrifice and self-restraint a society is willing to accept, against promises of prosperity and freedom. Some values seem to stabilise a frame while others cause collapse. Get the ratios right and we can have it all. Get them wrong and things get more desperate.
Abhay Bhutada, the Managing Director of Poonawalla Fincorp Limited, is an accomplished leader with over 15 years of experience in commercial and retail lending. A Qualified Chartered Accountant, he has been pivotal in leveraging technology to enhance financial services. Starting his career at Bank of India, he later founded TAB Capital Limited and co-founded Poonawalla Finance Private Limited, emphasizing digital lending. Under his leadership, Poonawalla Fincorp achieved a 'AAA' credit rating, integrating acquisitions and emphasizing corporate governance. Actively involved in industry forums and CSR initiatives, Abhay has been recognized with awards like "Young Entrepreneur of India 2017" and "40 under 40 Most Influential Leader for 2020-21." Personally, he values mindfulness, enjoys gardening, yoga, and sees every day as an opportunity for growth and improvement.
Falcon stands out as a top-tier P2P Invoice Discounting platform in India, bridging esteemed blue-chip companies and eager investors. Our goal is to transform the investment landscape in India by establishing a comprehensive destination for borrowers and investors with diverse profiles and needs, all while minimizing risk. What sets Falcon apart is the elimination of intermediaries such as commercial banks and depository institutions, allowing investors to enjoy higher yields.
A toxic combination of 15 years of low growth, and four decades of high inequality, has left Britain poorer and falling behind its peers. Productivity growth is weak and public investment is low, while wages today are no higher than they were before the financial crisis. Britain needs a new economic strategy to lift itself out of stagnation.
Scotland is in many ways a microcosm of this challenge. It has become a hub for creative industries, is home to several world-class universities and a thriving community of businesses – strengths that need to be harness and leveraged. But it also has high levels of deprivation, with homelessness reaching a record high and nearly half a million people living in very deep poverty last year. Scotland won’t be truly thriving unless it finds ways to ensure that all its inhabitants benefit from growth and investment. This is the central challenge facing policy makers both in Holyrood and Westminster.
What should a new national economic strategy for Scotland include? What would the pursuit of stronger economic growth mean for local, national and UK-wide policy makers? How will economic change affect the jobs we do, the places we live and the businesses we work for? And what are the prospects for cities like Glasgow, and nations like Scotland, in rising to these challenges?
Discover the Future of Dogecoin with Our Comprehensive Guidance36 Crypto
Learn in-depth about Dogecoin's trajectory and stay informed with 36crypto's essential and up-to-date information about the crypto space.
Our presentation delves into Dogecoin's potential future, exploring whether it's destined to skyrocket to the moon or face a downward spiral. In addition, it highlights invaluable insights. Don't miss out on this opportunity to enhance your crypto understanding!
https://36crypto.com/the-future-of-dogecoin-how-high-can-this-cryptocurrency-reach/
[4:55 p.m.] Bryan Oates
OJPs are becoming a critical resource for policy-makers and researchers who study the labour market. LMIC continues to work with Vicinity Jobs’ data on OJPs, which can be explored in our Canadian Job Trends Dashboard. Valuable insights have been gained through our analysis of OJP data, including LMIC research lead
Suzanne Spiteri’s recent report on improving the quality and accessibility of job postings to reduce employment barriers for neurodivergent people.
Decoding job postings: Improving accessibility for neurodivergent job seekers
Improving the quality and accessibility of job postings is one way to reduce employment barriers for neurodivergent people.
Using Online job postings and survey data to understand labour market trends
AMD annual-1998
1. Financial Highlights
Five Years Ended December 27, 1998
(Dollars in thousands except per share amounts,
1994 1995 1996 1997 1998
ratios and employment figures)
Net sales $2,155,453 $2,468,379 $1,953,019 $2,356,375 $2,542,141
Operating income (loss) 469,035 222,200 (253,310) (90,653) (163,642)
Net income (loss) 270,942 216,326 (68,950) (21,090) (103,960)
Net income (loss) per
common share:
Basic 2.22 1.69 (0.51) (0.15) (0.72)
Diluted 2.03 1.57 (0.51) (0.15) (0.72)
Working capital 441,649 461,509 445,604 448,497 721,308
Total assets 2,525,721 3,078,467 3,145,283 3,515,271 4,252,968
Long-term debt, capital lease
obligations and other,
less current portion 75,752 214,965 444,830 662,689 1,372,416
Stockholders’ equity 1,797,354 2,102,462 2,021,878 2,029,543 2,005,049
Capital additions 586,473 650,322 493,723 729,870 996,170
Depreciation and amortization 224,421 272,527 346,774 394,465 467,521
Research and development 295,326 416,521 400,703 467,877 567,402
Research and development as
a percentage of net sales 13.7% 16.9% 20.5 % 19.9 % 22.3 %
Return on equity 17.2% 11.1% (3.3)% (1.0)% (5.2)%
Debt as a percentage of capital 7.6% 11.9% 19.4 % 26.6 % 43.2 %
Worldwide employment 11,994 12,981 12,181 12,759 13,597
D I LU T ED E A R N I N G S STO C K H O L D E R S '
O P E R AT I N G
N E T I N CO M E ( LO S S ) PER SHARE EQUITY
I N CO M E ( LO S S )
NET SALES
In millions of dollars In dollars In billions of dollars
In millions of dollars
In billions of dollars
600 300 2.25 3.0
3.0
400 200 1.50 2.0
2.0
200 100 .75 1.0
1.0
0 0 0 0
0
-200 -100 -.75 -1.0
-1.0
-400 -200 -1.50 -2.0
-2.0
94 95 96 97 98 94 95 96 97 98 94 95 96 97 98 94 95 96 97 98 94 95 96 97 98
1
2. To My Fellow Shareholders
1998 was the year of the AMD-K6®-2 processor with 3DNow!™ technology.
Our introduction of the AMD-K6-2 processor with 3DNow! technology in May of 1998
was a watershed event. For the first time in our history, we had a new, differentiated processor,
fully compatible with the Microsoft ® Windows ® computing standard, that offered clear, compelling
performance advantages for consumers.
The response of the marketplace has validated our strategy:
• Today nine of the world’s top ten personal computer manufacturers offer systems powered by
AMD-K6 family processors, including the world’s #1 and #2 manufacturers of portable systems.
• Unit shipments of AMD-K6 family processors more than trebled year-to-year, and revenues
from AMD-K6 family processors nearly trebled to $1.25 billion.
• AMD shipped more than 13 million AMD-K6 family processors in 1998 – including more
than 8.5 million AMD-K6-2 processors with 3DNow! technology.
• AMD-K6 family processors captured a 16 percent share of the worldwide market for Windows
compatible processors in the fourth quarter of 1998 – more than double our market share
for the same quarter of 1997!
The success of the AMD-K6-2 processor enabled AMD to achieve record quarterly revenues
of $788,820,000, as well as record annual revenues of $2,542,141,000. In 1998, AMD revenues grew
by 8 percent in a year when worldwide shipments of integrated circuits declined by nearly 10 percent.
Despite the progress we made in microprocessors, enabling a return to profitability in the second
half, AMD incurred a substantial net loss of $103,960,000, or $0.72 per share, in 1998.
Our non-microprocessor product groups – our Communications Group, our Memory Group,
and Vantis, our programmable logic subsidiary – were severely impacted by continuing weak demand
and resultant price pressures due to the lingering recession in the worldwide semiconductor industry.
Revenues from these groups in the aggregate continued to decline throughout the year, in some measure
offsetting the strong revenue growth of our Computation Products Group. I do not expect significant
growth in revenues from these product lines during the first half of 1999. Therefore, for the near term,
any and all revenue growth must come from our Computation Products Group, i.e., processors for
Windows computing.
At AMD, we define “winning” as gaining market share, and “success” as profitable growth.
By these definitions, even though we are winning, we have not been consistently successful. The necessity
of investing heavily and continuously in research and development while bringing up additional production
facilities in order to execute our long-term strategy continues to make it difficult to achieve consistent
profitable growth. I am not satisfied with our performance, and I will not be satisfied until we can
consistently grow profitably.
Our principal challenge in 1999 will be to continue to grow our microprocessor market share
and position ourselves for sustained profitability. All applicable resources at AMD must and will be
focused accordingly as we restructure our activities to address the realities of the marketplace.
The 1,000 Days In 1996 I issued a challenge to our worldwide sales force. At that time, I told them
that we had 1,000 days in which to establish an alternative platform for Microsoft Windows computing.
The 1,000-day window of opportunity began with the introduction of our first independently engineered
alternative to Intel processors. Our overarching goal was and is to capture a 30 percent unit share of the
worldwide market for processors for Windows computing by the end of 2001, creating an opportunity
for us to achieve financial returns superior to the semiconductor industry. Our immediate challenges,
however, were to shed our “clone image” and secure a beachhead with innovative products of our own
concept and design.
2
3. By the end of 1998 – and the expiration of our initial 1,000-day campaign – the beachhead was
ours. The AMD-K6-2 processor with 3DNow! technology and a low-cost infrastructure supported by
independent chipset and motherboard suppliers throughout the world have established AMD and our
AMD-K6 processor family as the only real alternative to the Intel monopoly. With a 16 percent market
share, we are just over halfway toward our long-term goal. Let’s review the progress we have made and
the challenges we must meet to achieve that goal.
Our “P 3 Strategy” Execution of our “P3 Strategy” continues to be the key to success: first, we
must be the nucleating point for platforms based on processor products that offer compelling features
within the Microsoft Windows standard; second, we must have leading-edge process technology that
will enable us to deliver high-performance processors at competitive cost; and finally, we must have
production capacity to manufacture processors using that technology in volume to support our customers
as they come to depend upon AMD for a growing percentage of their requirements.
During the past three years we have made extraordinary progress in creating these wealth-
producing assets.
Process technology. Today all of our microprocessor production is on leading-edge 0.25-micron
(250-nanometer) technology. We have successfully developed 180-nanometer, six-layer, aluminum intercon-
nect technology to remain at the leading edge and have produced advanced processors using this technology
both in our development facility in Sunnyvale, California, and in Fab 25 in Austin, Texas. We are on
schedule to introduce 180-nanometer technology into high-volume production in the third quarter of 1999.
The next step in the continuing evolution of process technology will employ the use of copper
interconnect technology to achieve even higher-performance devices and lower-cost production. During
1998, we entered into a seven-year agreement with Motorola to collaborate on the development of process
technology, including copper interconnect technology. This alliance with another of the world’s premier
semiconductor manufacturers has increased our confidence that we will meet our schedule for introduction
of copper interconnect technology into production at Fab 30 in Dresden, Germany. We have commenced
process integration wafer starts that will utilize copper interconnect technology resulting from this
alliance, and we plan to qualify the process for production by the end of this year in order to generate
revenues from Fab 30 in the first quarter of 2000.
Production Capacity. We have completed the outfitting of Fab 25. This facility is now equipped
to produce 5,000 wafers per week – 250,000 wafers per year – employing technologies with geometries
of 250 nanometers and finer. Fab 25 is currently operating at approximately 80 percent of capacity.
We have completed construction of Fab 30, and are in the process of installing equipment and
qualifying the facility to commence commercial production by the end of this year. When fully equipped,
Fab 30 will also be capable of producing 250,000 wafers per year employing technologies of 180 nanometers
and finer with copper interconnects.
Platforms/Products. The AMD-K6-2 processor with 3DNow! technology enabled AMD to gain a
substantial share of the mainstream PC market, reaching a 37 percent share of the market in December
for desktop systems in the North American retail channel, which is frequently a bellwether for trends
in the PC industry. In January of this year, we were #1 in the channel with a 43.9 percent market share
versus Intel’s 40.3 percent! I believe a growing installed base of PC systems with 3DNow! technology
establishes a strong platform for software developers, which should enhance opportunities for even broader
acceptance of AMD processors going forward. All AMD processors for the PC market incorporate
3DNow! technology, which is supported by Microsoft Windows Direct X.
The AMD-K6-III processor with 3DNow! technology, our latest offering for the mainstream PC
market, features a unique performance-enhancing tri-level cache memory design with more on-system
3
4. cache memory than any other processor currently available for Windows computing. With outstanding
capability and features, the AMD-K6-III processor will enable PC manufacturers to build more affordable
high-performance systems. I expect that an increasing proportion of production for the market segments
served by AMD will be devoted to the AMD-K6-III processor family throughout the remainder of 1999.
The Convergence of Computation and Communications As the convergence
of computation and communications continues to accelerate, driven in large measure by the burgeoning
growth of the Internet, AMD will devote increasing focus on enhancement of the personal computer
as a visual computing platform and information tool. Today, our Computation Products Group (which
now includes our Embedded Processor Division) produces two-thirds of our total revenues. With new
opportunities created by the Internet and electronic commerce, our Communications Group is developing
new products, such as our PCnet™ Home controller, that will enable home PC users to link multiple PCs
together over standard telephone wiring – all sharing access to a single Internet connection. We will also
supply ADSL (Asynchronous Digital Subscriber Line) chipsets capable of delivering high-speed access
to the Internet over existing copper telephone lines.
The AMD-K7 Processor and the Next 1,000 Days Our mission of establishing
the beachhead and putting in place significant wealth-producing assets has been accomplished in the
aforementioned 1,000-day campaign. Our mission for the next 1,000 days is to extract the value for
our shareholders from the substantial investments we have made and continue to make in our P3 strategy.
The forthcoming AMD-K7™ processor family will be central to our success. The AMD-K7 processor will
be the first seventh-generation Microsoft Windows compatible processor in the marketplace.
Prototype AMD-K7 processors were demonstrated at Comdex last fall, and we are currently sampling
versions with clock speeds in excess of 500 megahertz. Simply put, we believe that the AMD-K7 processor
will be the highest-performance processor for Windows computing on the market in 1999. We plan to
aggressively increase clock speeds over the 18-month period following introduction with a goal of achieving
a clock speed of 1 gigahertz by the end of next year!
The AMD-K7 processor family and the infrastructure to support it offer the greatest technical,
logistical and marketing challenges in AMD’s 30-year history. This is the culmination of our corporate
purpose of “empowering people everywhere to lead more productive lives” and our corporate mission
“to grow faster and achieve superior returns to the semiconductor industry” through innovative solutions.
Microprocessors for Microsoft Windows computing represent the largest segment of the worldwide
semiconductor industry. The barriers to entry are high. The scale of investment to compete is enormous.
The rewards of success should be commensurate.
Carpe diem!
W.J. Sanders III
Chairman and Chief Executive Officer
February 26, 1999
THE FORWARD-LOOKING STATEMENTS CONTAINED IN THE ABOVE LETTER ARE SUBJECT TO RISKS AND UNCERTAINTIES, INCLUDING THOSE
DISCUSSED IN THIS ANNUAL REPORT AND THE COMPANY’S FORM 10-K FOR THE FISCAL YEAR ENDED DECEMBER 27, 1998, AS FILED WITH
THE SECURITIES AND EXCHANGE COMMISSION, THAT COULD CAUSE ACTUAL RESULTS TO DIFFER MATERIALLY FROM THOSE PROJECTED.
4
5. Management’s Discussion and Analysis of
Financial Condition and Results of Operations
adverse economic conditions in Asia; our new integrated
Cautionary Statement Regarding Forward-Looking Statements
The statements in this Management’s Discussion and circuit manufacturing and design facility in Dresden,
Analysis of Financial Condition and Results of Operations Germany (Dresden Fab 30); and the Fujitsu AMD
that are forward-looking are based on current expectations Semiconductor Limited (FASL) manufacturing facilities.
and beliefs and involve numerous risks and uncertainties See “Financial Condition” and “Risk Factors” below, as
that could cause actual results to differ materially. The well as such other risks and uncertainties as are detailed
forward-looking statements relate to operating results; in our Securities and Exchange Commission reports and
anticipated cash flows; realization of net deferred tax filings for a discussion of the factors that could cause
assets; capital expenditures; adequacy of resources to actual results to differ materially from the forward-look-
fund operations and capital investments; our ability to ing statements.
access external sources of capital; our ability to transition
The following discussion should be read in conjunction
to new process technologies; our ability to increase unit
with the Consolidated Financial Statements and Notes
shipments of microprocessors at higher speed grades;
thereto at December 27, 1998 and December 28, 1997
anticipated market growth; Year 2000 costs; the effect
and for each of the three years in the period ended
of foreign currency hedging transactions; the effect of
December 27, 1998.
products include Flash memory devices and Erasable
R e s u lt s o f O p e r a t i o n s
Advanced Micro Devices, Inc. (AMD, we or our) participates Programmable Read-Only Memory (EPROM) devices.
in all three technology areas within the digital integrated Communications Group products include telecommunica-
circuit (IC) market – memory circuits, logic circuits and tion products, networking and input/output (I/O) products
microprocessors – through, collectively, (1) our AMD and embedded processors. Vantis products are complex
segment, which consists of our three product groups – and simple, high-performance CMOS (complementary metal
Computation Products Group (CPG), Memory Group oxide semiconductor) programmable logic devices (PLDs).
and Communications Group; and (2) our Vantis segment,
The following is a summary of the net sales of the CPG,
which consists of our programmable logic subsidiary,
the Memory Group, the Communications Group and
Vantis Corporation (Vantis). CPG products include micro-
Vantis for 1998, 1997 and 1996:
processors and core logic products. Memory Group
1997 1996
1998
(Millions)
AMD segment
$ 682 $ 341
CPG $1,257
Memory Group 724 698
561
Communications Group 707 666
519
2,113 1,705
2,337
Vantis segment 243 248
205
Total $2,356 $1,953
$2,542
For the year ended December 27, 1998, we experienced Recent and Anticipated Results of Operations
lower than expected net sales due to the general downturn Net sales were $789 million in the fourth quarter of 1998
in the worldwide semiconductor market and the current compared to $686 million in the third quarter of 1998
economic conditions in Asia, which negatively impacted and $613 million in the fourth quarter of 1997. In the first
our results of operations. To the extent that these factors quarter of 1999, we implemented design enhancements to
continue to deteriorate in 1999, our net sales and results increase the yield of higher-speed versions of AMD-K6®-2
of operations may continue to be negatively affected. microprocessors. However, we will incur a shortfall in
5
6. Management’s Discussion and Analysis of
Financial Condition and Results of Operations
microprocessor units shipped in the first quarter of 1999 Group net sales, have not kept pace with the market shift
as a result of lower than expected yields in the first eight towards higher-performance products. Our sales of tele-
weeks of the quarter on wafers started prior to our imple- communication products, which represented more than
mention of these design enhancements. Additionally, one-third of the decline in Communications Group net
we expect that we will be unable to increase our micro- sales, were particularly impacted by the general economic
processor average selling prices in the first quarter of downturn in Asia.
1999 due to Intel’s announced price reductions. As a
Vantis net sales decreased 16 percent to $205 million
result of these factors, combined with increases in our
from the prior year due to a decrease in unit shipments
planned research and development spending on technology
and lower average selling prices of low-density or simple
development through Dresden Fab 30 and our alliance
PLD (SPLD) products. The total available market for SPLD
with Motorola (described below), we will be unable to
products has been shrinking for the past three years as
increase our microprocessor revenue and expect to incur
older SPLD products are increasingly replaced by complex
a significant operating loss in the first quarter of 1999.
PLD (CPLD) and field programmable gate array (FPGA)
products in new designs. This decline in market demand
Net Sales Comparison of Years Ended
for SPLDs intensified at the beginning of 1998 and led to
December 27, 1998 and December 28, 1997
Total net sales increased by $186 million, or 8 percent, increased competition among SPLD suppliers. In addition,
to $2,542 million in 1998 from $2,356 million in 1997 sales of CPLDs decreased slightly despite a significant
primarily due to an increase in CPG net sales of $575 mil- sales increase in our newer CPLD products.
lion. This increase was partially offset by a combined
Net Sales Comparison of Years Ended
decrease in the other product groups of $389 million.
December 28, 1997 and December 29, 1996
In 1997, net sales of $2,356 million increased $403 million,
CPG net sales increased by 84 percent to $1,257 million
or 21 percent, from 1996 primarily due to an increase
in 1998 compared to $682 million in 1997. This increase
in CPG net sales. Net sales from non-microprocessor
was primarily due to increased shipments of microproces-
products increased nominally in 1997 compared to 1996.
sors at a higher speed grade mix and higher average selling
prices. CPG sales growth in 1999 is dependent on increased
CPG net sales doubled to $682 million in 1997 compared
unit shipments at higher speed grades and higher average
to $341 million in 1996 largely due to sales of AMD-K6
selling prices, as to which we cannot give any assurance.
microprocessors, which became available at the end of
the first quarter of 1997. This sales growth was partially
Memory Group net sales decreased 23 percent to $561 mil-
offset by decreased sales of earlier generations of micro-
lion from the prior year primarily due to a significant
processors, which represented most of our microprocessor
decline in the average selling price of Flash memory devices.
sales in 1996.
This decrease was partially offset by an increase in unit
shipments of Flash memory devices. Oversupply in the
Memory Group net sales increased 4 percent as substan-
Flash market, combined with an increase in competition,
tial Flash memory device unit growth more than offset
has caused downward pressure on the average selling price
declines in the average selling price. EPROM product
of Flash memory devices. We expect continued price pres-
net sales decreased due to a decline in both the average
sure from intense competition in Flash memory devices.
selling price and unit shipments.
In addition, average selling prices and unit shipments of
Communications Group net sales increased 6 percent
EPROMs declined. We expect future EPROM sales to be flat
primarily due to increased unit shipments of telecom-
or down due to a general shift to Flash memory devices.
munication products. This increase was partially offset
Communications Group net sales decreased 27 percent
by a decline in the average selling price of network prod-
to $519 million from the prior year primarily due to a
ucts. Vantis net sales decreased 2 percent due to declines
significant decrease in unit shipments of nearly all prod-
in the average selling price of both SPLD and CPLD prod-
ucts. Our offerings of network products, which represented
ucts. These decreases were partially offset by increases
approximately one-half of the decline in Communications
in unit shipments of both SPLD and CPLD products.
6
7. percentage and interest income and other, net for 1998,
Comparison of Expenses, Gross Margin Percentage and Interest
The following is a summary of expenses, gross margin 1997 and 1996:
1997 1996
1998
(Millions except for gross margin percentage)
Cost of sales $1,578 $1,441
$1 ,719
Gross margin percentage 33% 26%
32%
Research and development $ 468 $ 401
$ 567
Marketing, general and administrative 401 365
420
Litigation settlement – –
12
Interest income and other, net 35 59
34
Interest expense 45 15
66
We operate in an industry characterized by high fixed ment. The agreements provide that we will co-develop
costs due to the capital-intensive manufacturing process, with Motorola future-generation logic process and embed-
particularly due to the state-of-the-art production facilities ded Flash technologies. The licenses to each generation
required for microprocessors. As a result, gross margin is of technology vary in scope relative to the contributions
significantly affected by short-term fluctuations in product to technology development made by both companies.
sales. Gross margin percentage growth is dependent on Subject to certain conditions, the companies will share:
increased sales from microprocessor and other products • ownership of jointly developed technology
as fixed costs continue to rise due to continuing capital and any intellectual property rights relating
investments required to expand production capacity. to such technology;
• development costs for mutually agreed upon
Gross margin percentage decreased to 32 percent in 1998
facilities, tasks and technologies; and
compared to 33 percent in 1997. The decline in gross
• foundry support.
margin percentage was primarily caused by a decline in
net sales of non-microprocessor products. During 1998, In addition, we will gain access to Motorola’s semicon-
we continued to invest in the facilitization of Fab 25, ductor logic process technology, including copper inter-
our submicron integrated circuit manufacturing facility connect technology. In exchange, we will develop and
in Austin, Texas, and in the transition from 0.35-micron license to Motorola a Flash module design to be used in
to 0.25-micron process technology in Fab 25. These Motorola’s future embedded Flash products. The licenses
investments have led to significant increases in our fixed to logic process technologies granted to AMD may be
costs associated with our microprocessor products. Fixed subject to variable royalty rates, which are dependent on
costs will continue to increase as we add equipment to the technology transferred and subject to certain other
Fab 25 and as we introduce equipment for 0.18-micron conditions. Motorola will have additional rights, subject
process technology capacity in our production facilities. to certain conditions, to make stand-alone Flash devices,
Accordingly, absent significant increases in sales, particu- and to make and sell certain data networking devices.
larly with respect to microprocessors, we will continue The rights to data networking devices may be subject
to experience pressure on our gross margin percentage. to variable royalty payment provisions.
Gross margin percentage increased in 1997 compared Research and development expenses increased in 1998 com-
to 1996 primarily due to increased sales of microproces- pared to 1997 due to an increase in spending in Dresden
sors manufactured in Fab 25. Fab 30 for construction, facilitization and pre-production
process development and in Fab 25 for new product and
In 1998, we entered into an alliance with Motorola for
process development. In addition, we incurred research and
the development of Flash memory and logic technology.
development expenses of $11 million in the fourth quarter
The alliance includes a seven-year technology development
of 1998 related to the alliance with Motorola. We expect
and license agreement and a patent cross-license agree-
research and development spending related to this alliance
7
8. Management’s Discussion and Analysis of
Financial Condition and Results of Operations
to be between $15 million and $20 million per quarter Fab 25 and construction of Dresden Fab 30. Interest income
in 1999. We cannot give any assurance that we will benefit and other, net decreased in 1997 compared to 1996 due to
from this additional research and development spending the absence in 1997 of realized gains recorded in 1996 of
through future copper interconnect-based product offer- approximately $41 million from sales of equity securities.
ings, and any such failure could have a material adverse This reduction in 1997 was partially offset by higher interest
effect on our business. income in 1997 as a result of higher cash balances.
Research and development expenses increased in 1997 Income Tax
compared to 1996. In 1996, a significant portion of We recorded tax benefits of $92 million in 1998, $55 million
our Submicron Development Center (SDC) in Sunnyvale, in 1997 and $85 million in 1996, resulting in an effective
California, capacity was devoted to the production of tax benefit rate of approximately 44 percent in 1998,
products for sale. In 1997, a higher percentage of SDC 55 percent in 1997 and 41 percent in 1996. The tax benefit
capacity was devoted to process development. rate is greater than the federal statutory rate due to fixed
tax benefits that increase the benefit rate in a loss year.
Marketing, general and administrative expenses increased
The lower tax benefit rate in 1998 and 1996 compared to
in 1998 compared to 1997 primarily due to depreciation
1997 reflects a lesser impact of these fixed benefits relative
expense and labor costs associated with the installation
to a larger pre-tax loss in 1998 and 1996 compared to 1997.
of new order management and accounts receivable systems
Realization of our net deferred tax assets ($171 million at
and related software upgrades. In 1997, marketing, general
December 27, 1998) is dependent on future taxable income.
and administrative expenses increased compared to 1996
While we believe that it is more likely than not that such
primarily due to higher advertising and marketing expenses
assets will be realized, other factors, including those men-
associated with the introduction of the AMD-K6 micro-
tioned in the discussion of “Risk Factors,” may impact the
processor. Additionally, business systems expenses increased
ultimate realization of such assets.
in 1997 due to new system installation and upgrade expenses.
Other Items
A litigation settlement of approximately $12 million was
International sales as a percent of net sales were 55 percent
recorded in the first quarter of 1998 for the settlement of
in 1998, 57 percent in 1997 and 53 percent in 1996. During
a class action securities lawsuit against AMD and certain
1998, approximately 8 percent of our net sales were
of our current and former officers and directors. We paid
denominated in foreign currencies. We do not have sales
the settlement during the third quarter of 1998.
denominated in local currencies in those countries which
Interest expense increased in 1998 compared to 1997 due have highly inflationary economies (as defined by gener-
to the increase in debt balances including the $517.5 million ally accepted accounting principles). The impact on our
of Convertible Subordinated Notes sold in May 1998 (the operating results from changes in foreign currency rates
Convertible Subordinated Notes). There was no significant individually and in the aggregate has not been material.
change in interest income and other, net in 1998 compared
Comparison of Segment Income (Loss)
to 1997. Interest expense increased in 1997 compared to
We operate in two segments: (1) our AMD segment,
1996 due to the increase in debt balances, including the
which consists of our three product groups – Computation
$400 million of Senior Secured Notes sold in August 1996
Products Group, Memory Group and Communications
(the Senior Secured Notes) and the $250 million four-year
Group; and (2) our Vantis segment, which consists of
secured term loan received under the 1996 syndicated bank
Vantis. For a comparison of segment net sales, refer to
loan agreement, which also provides for a currently unused
the previous discussions on net sales by product group.
$150 million revolving line of credit (the Credit Agreement).
This increase was partially offset by higher capitalized The following is a summary of operating income (loss)
interest related to the second phase of construction of by segment for 1998, 1997 and 1996:
1997 1996
1998
(Millions)
AMD segment $(127) $(270)
$(185)
Vantis segment 37 17
22
Total $(90) $(253)
$(163)
8
9. The AMD segment’s operating loss increased in 1998 The Vantis segment’s operating income decreased in 1998
compared to 1997 primarily due to a significant increase compared to 1997 due to a decrease in unit shipments,
in fixed costs associated with microprocessor products, lower average selling prices of SPLD products and higher
as well as increased costs for research and development spending on software and product development. This
related to Dresden Fab 30 and the Motorola alliance and decrease in net sales was partially offset by a decrease in
depreciation expense and labor costs associated with the costs and expenses as a result of reduced manufacturing
installation of new order management and accounts receiv- activity in response to lower demand for SPLDs coupled
able systems and related software upgrades. These increases with lower per unit wafer fabrication expenses and lower
in expenses were partially offset by higher net sales in the marketing, general and administrative expenses. Despite
AMD segment. The AMD segment’s operating loss decreased a decrease in net sales, the Vantis segment’s operating
in 1997 compared to 1996 primarily due to increased AMD income increased in 1997 compared to 1996 due to the
segment net sales. This increase in net sales was partially transfer of manufacturing activity from the SDC to other
offset by increases in research and development expenses production facilities, where production costs were lower.
as well as advertising and marketing expenses for the In addition, research and development expenses in 1997
introduction of the AMD-K6 microprocessor. decreased from 1996.
Financing sources of cash for 1997 and 1996 consisted
Financial Condition
Cash flow from operating activities was $144 million in primarily of borrowings under the Credit Agreement in
1998 compared to $399 million in 1997 and $89 million 1997 and proceeds from the Senior Secured Notes in
in 1996. Net operating cash flows in 1998 decreased $254 1996. The above sources were offset by debt repayments
million year over year primarily due to an increase in net of $88 million in 1998, $80 million in 1997 and $253
loss of $83 million combined with a decrease in the net million in 1996. Financing activities for all years present-
change in operating assets and liabilities of $153 million ed include proceeds from the issuance of common stock
and a decrease in net non-cash adjustments to net loss of under employee stock plans.
$18 million. The decrease in the net change in operating
We plan to continue to make significant capital invest-
assets and liabilities was primarily due to a lower increase
ments in 1999. These investments include those relating
in payables and accrued liabilities in 1998 compared to
to the continued facilitization of Dresden Fab 30 and
1997. The decrease in net non-cash adjustments to net
Fab 25.
loss was primarily due to a larger increase in deferred
AMD Saxony, an indirect wholly owned German
income taxes in 1998 compared to 1997. This decrease
subsidiary of AMD, has constructed and is installing
was partially offset by an increase in depreciation and
equipment in Dresden Fab 30, a 900,000-square-foot
amortization in 1998.
submicron integrated circuit manufacturing and design
Investing activities consumed $998 million in cash during
facility located in Dresden, in the State of Saxony,
1998 compared to $633 million in 1997 and $276 million
Germany. AMD, the Federal Republic of Germany, the
in 1996. Substantially all of our net investing activities in
State of Saxony and a consortium of banks are supporting
1998 consisted of capital expenditures. Capital expendi-
the project. We currently estimate construction and
tures increased in 1998 compared to 1997 due to continued
facilitization costs of Dresden Fab 30 to be $1.9 billion.
investment in property, plant and equipment primarily for
In March 1997, AMD Saxony entered into a loan agree-
Fab 25 and Dresden Fab 30. Capital expenditures of $485
ment and other related agreements (the Dresden Loan
million in 1996 were offset by net proceeds from the sale
Agreements) with a consortium of banks led by Dresdner
of short-term investments of approximately $207 million.
Bank AG. The Dresden Loan Agreements provide for the
Our financing activities provided cash of $975 million funding of the construction and facilitization of Dresden
in 1998, including proceeds from the Convertible Subordi- Fab 30. The funding consists of:
nated Notes, borrowings from Dresdner Bank AG in the • equity, subordinated loans and loan guarantees
amount of $300 million (denominated in deutsche marks), from AMD;
and capital investment grants from the Federal Republic • loans from a consortium of banks; and
of Germany and the State of Saxony of $197 million. • grants, subsidies and loan guarantees from the Federal
Republic of Germany and the State of Saxony.
9
10. Management’s Discussion and Analysis of
Financial Condition and Results of Operations
The Dresden Loan Agreements, which were amended The Dresden Loan Agreements also require that we:
in February 1998 to reflect upgrades in wafer production • provide interim funding to AMD Saxony if either
technology as well as the decline in the deutsche mark the remaining capital investment allowances or
relative to the U.S. dollar, require that we partially fund the remaining interest subsidies are delayed, which
Dresden Fab 30 project costs in the form of subordinated will be repaid to AMD as AMD Saxony receives
loans to, or equity investments in, AMD Saxony. In accor- the grants or subsidies from the State of Saxony;
dance with the terms of the Dresden Loan Agreements, • fund shortfalls in government subsidies resulting
we have invested $270 million to date in the form of sub- from any default under the subsidy agreements
ordinated loans and equity in AMD Saxony, which includes caused by AMD Saxony or its affiliates;
$100 million in subordinated loans in 1998 ($60 million • guarantee a portion of AMD Saxony’s obligations
of which was paid after fiscal 1998 but before December 31, under the Dresden Loan Agreements up to a
1998). We are required to make additional subordinated maximum of $130 million (denominated in deutsche
loans to, or equity investments in, AMD Saxony totaling marks) until Dresden Fab 30 has been completed;
$170 million in 1999, $70 million of which must be • fund certain contingent obligations including obliga-
funded through the sale of at least $200 million of our tions to fund project cost overruns, if any; and
stock by June 30, 1999. We cannot give any assurance • make funds available to AMD Saxony, after completion
that the requisite external financing will be available of Dresden Fab 30, up to approximately $87 million
on favorable terms, if at all. (denominated in deutsche marks) if AMD Saxony does
not meet its fixed charge coverage ratio covenant.
In addition to support from AMD, the consortium of
banks referred to above has made available $989 million Because our obligations under the Dresden Loan Agreements
in loans (denominated in deutsche marks) to AMD are denominated in deutsche marks, the dollar amounts
Saxony to help fund Dresden Fab 30 project costs. AMD set forth herein are subject to change based on applicable
Saxony had $300 million of such loans outstanding as conversion rates. At the end of the fourth quarter of
of December 27, 1998. 1998, the exchange rate was approximately 1.67 deutsche
marks to 1 U.S. dollar (which we used to calculate our
Finally, the Federal Republic of Germany and the State
obligations denominated in deutsche marks).
of Saxony are supporting the Dresden Fab 30 project,
in accordance with the Dresden Loan Agreements, in The definition of defaults under the Dresden Loan
the form of: Agreements includes the failure of AMD, AMD Saxony
• guarantees of 65 percent of AMD Saxony bank or AMD Holding, the parent company of AMD Saxony
debt up to a maximum amount of $989 million; and the wholly owned subsidiary of AMD, to comply
• capital investment grants and allowances totaling with obligations in connection with the Dresden Loan
$289 million; and Agreements, including:
• interest subsidies totaling $180 million. • material variances from the approved schedule
and budget;
Of these amounts (which are all denominated in deutsche
• our failure to fund equity contributions or share-
marks), AMD Saxony has received $275 million in capital
holder loans or otherwise comply with our obligations
investment grants and $8 million in interest subsidies as
relating to the Dresden Loan Agreements;
of December 27, 1998. The grants and subsidies are subject
• the sale of shares in AMD Saxony or AMD Holding;
to conditions, including meeting specified levels of employ-
• the failure to pay material obligations;
ment in December 2001 and maintaining those levels until
• the occurrence of a material adverse change or filings
June 2007. Noncompliance with the conditions of the
of proceedings in bankruptcy or insolvency with
grants and subsidies could result in the forfeiture of all
respect to us, AMD Saxony or AMD Holding; and
or a portion of the future amounts to be received as well
• the occurrence of default under the indenture pursuant
as the repayment of all or a portion of amounts received
to which the Senior Secured Notes were issued (the
to date. As of December 27, 1998, we were in compliance
Indenture) or the Credit Agreement.
with all of the conditions of the grants and subsidies.
10
11. Generally, any such default which either (1) results from the parties to the Credit Agreement agreed to amend
our noncompliance with the Dresden Loan Agreements certain covenants, including those relating to minimum
and is not cured by AMD or (2) results in recourse to tangible net worth, the modified quick ratio, the leverage
AMD of more than $10 million and is not cured by AMD, ratio and profitability, to facilitate our compliance with
would result in a cross-default under the Dresden Loan all covenants under the Credit Agreement as of the end
Agreements, the Indenture and the Credit Agreement. of the first quarter of 1999.
Under certain circumstances, cross-defaults result under
FASL, a joint venture formed by AMD and Fujitsu Limited
the Convertible Subordinated Notes, the Indenture and
in 1993, is continuing the facilitization of its second
the Dresden Loan Agreements.
Flash memory device wafer fabrication facility, FASL II,
in Aizu-Wakamatsu, Japan. We expect the facility, includ-
In the event we are unable to meet our obligation to
ing equipment, to cost approximately $1 billion when
make loans to, or equity investments in, AMD Saxony
fully equipped. As of December 27, 1998, approximately
as required under the Dresden Loan Agreements, AMD
$368 million of such cost had been funded. Capital expen-
Saxony will be unable to complete Dresden Fab 30 and
ditures for FASL II construction to date have been funded
we will be in default under the Dresden Loan Agreements,
by cash generated from FASL operations and local borrow-
the Indenture and the Credit Agreement, which would
ings by FASL. During 1999, we presently anticipate that
permit acceleration of certain indebtedness, which would
FASL capital expenditures will continue to be funded by
have a material adverse effect on our business. There can
cash generated from FASL operations and local borrowings
be no assurance that we will be able to obtain the funds
by FASL. However, to the extent that FASL is unable to
necessary to fulfill these obligations and any such failure
secure the necessary funds for FASL II, we may be required
would have a material adverse effect on our business.
to contribute cash or guarantee third-party loans in pro-
Beginning in October 1998, the $250 million four-year portion to our 49.992 percent interest in FASL. As of
secured term loan under the Credit Agreement was December 27, 1998, we had loan guarantees of $81 million
repayable in eight equal quarterly installments of approxi- outstanding with respect to these loans. The planned FASL
mately $31 million. As of December 27, 1998, the out- II costs are denominated in yen and are, therefore, subject
standing balance was $219 million. As of December 27, to change due to foreign exchange rate fluctuations.
1998, we also had available unsecured uncommitted bank
As a result of our alliance with Motorola, relating to the
lines of credit in the amount of $69 million, of which
development of Flash memory and logic technology, we
$6 million was outstanding.
expect related research and development spending to be
In February and June 1998, certain of the covenants between $15 million and $20 million per quarter in 1999.
under the Credit Agreement, including those relating to
We believe that cash flows from operations and current
the modified quick ratio, minimum tangible net worth
cash balances, together with external financing activities,
and the fixed charge coverage ratio, were amended. As
will be sufficient to fund operations and capital invest-
of December 27, 1998, we were in compliance with all
ments through 1999.
covenants under the Credit Agreement. In March 1999,
require AMD to recognize all derivatives on the balance
R e c e n t ly I s s u e d F i n a n c i a l A c c o u n t i n g S t a n d a r d s
In June 1998, the Financial Accounting Standards Board sheet at fair value. Derivatives that are not hedges must be
issued Statement of Financial Accounting Standards adjusted to fair value through income. If the derivative is
No.133 (SFAS 133),“Accounting for Derivative Instruments a hedge, depending on the nature of the hedge, changes in
and Hedging Activities.” SFAS 133 is required to be adopted the fair value of derivatives will either be offset against the
in years beginning after June 15, 1999. We expect to adopt change in fair value of the hedged assets, liabilities, or firm
SFAS 133 in 2000. We have not completed our review of commitments through earnings or recognized in other com-
SFAS 133, and accordingly have not evaluated the effect the prehensive income until the hedged item is recognized in
adoption of the Statement may have on our consolidated earnings. The ineffective portion of a derivative’s change
results of operations and financial position. SFAS 133 will in fair value will be immediately recognized in earnings.
11
12. Management’s Discussion and Analysis of
Financial Condition and Results of Operations
securities with active secondary or resale markets to
Q ua n t i tat i ve a n d Q ua l i tat i ve
ensure portfolio liquidity.
Disclosure About Market Risk
Interest Rate Risk Our exposure to market risk for changes
We primarily use proceeds from debt obligations to support
in interest rates relates primarily to our investment
general corporate purposes including capital expenditures
portfolio and long-term debt obligations. We do not
and working capital needs. We have no interest rate expo-
use derivative financial instruments in our investment
sure due to rate changes for the Convertible Subordinated
portfolio. We place our investments with high credit
Notes and the Senior Secured Notes. However, we do have
quality issuers and, by policy, limit the amount of credit
interest rate exposure on our $250 million bank term loan
exposure to any one issuer. As stated in our investment
due to its variable LIBOR pricing. From time to time, we
policy, we are averse to principal loss and ensure the
enter into interest rate swaps, primarily to reduce our
safety and preservation of our invested funds by limiting
interest rate exposure by changing a portion of our interest
default risk, market risk and reinvestment risk.
rate exposure from floating to fixed rate. There were no
We mitigate default risk by investing in only the highest interest rate swaps outstanding at the end of fiscal 1998.
credit quality securities and by constantly positioning
The table below presents principal (or notional) amounts
our portfolio to respond appropriately to a significant
and related weighted-average interest rates by year of
reduction in a credit rating of any investment issuer
maturity for our investment portfolio and debt obligations
or guarantor. The portfolio includes only marketable
as of December 27, 1998 and December 28, 1997.
1998 1997
1999 2000 2001 2002 2003
(Thousands) Thereafter Total Fair value Total
Cash equivalents
Fixed rate amounts $ 22,434 – – – – – $ 22,434 $ 22,394 $ 37,761
Average rate 5.51% – – – – –
Variable rate amounts $136,408 – – – – – $ 136,408 $ 136,408 –
Average rate 5.12% – – – – –
Short-term investments
Fixed rate amounts $219,085 – – – – – $ 219,085 $ 219,617 $164,538
Average rate 5.64% – – – – –
Variable rate amounts $115,500 – – – – – $ 115,500 $ 115,500 $ 61,200
Average rate 5.66% – – – – –
Long-term investments
Equity investments – $ 7,027 – – – – $ 7,027 $ 13,292 $ 6,161
Fixed rate amounts – $ 2,000 – – – – $ 2,000 $ 2,003 $ 1,997
Average rate 5.88% 5.88% – – – –
Total investments
Securities $493,427 $ 9,027 – – – – $ 502,454 $ 509,214 $271,657
Average rate 5.49% 5.88% – – – –
Notes payable
Fixed rate amounts $ 6,017 – – – – – $ 6,017 $ 6,017 $ 6,601
Average rate 1.06% – – – – –
Long-term debt
Fixed rate amounts $ 283 $ 151 $53,611 $178,332 $468,290 $518,169 $1,218,836 $1,266,196 $410,056
Average rate 7.49% 7.49% 7.49% 7.59% 8.00% 6.01%
Variable rate amounts $125,000 $93,750 – – – – $ 218,750 $ 218,750 $250,000
Average rate 8.06% 8.06% – – – –
12
13. We use foreign exchange forward and to, or invest equity in, AMD Saxony, of which $75 million
Foreign Exchange Risk
option contracts to reduce our exposure to currency fluc- were outstanding as of December 27, 1998. In 1998, we
tuations on our net monetary assets position in our foreign entered into a no-cost collar arrangement to hedge Dresden
subsidiaries, liabilities for products purchased from FASL, Fab 30 project costs through which we purchased $300 mil-
fixed asset purchase commitments and obligations for lion of put option contracts and sold $300 million of call
future investments in AMD Saxony. The objective of these option contracts. We had $220 million of no-cost collar
contracts is to minimize the impact of foreign currency option contracts outstanding as of December 27, 1998.
exchange rate movements on our operating results and
Gains and losses related to the foreign currency forward
on the cost of capital asset acquisition. Our accounting
and option contracts for the year ended December 27,
policy for these instruments is based on our designation
1998 were not material. We do not anticipate any material
of such instruments as hedging transactions. We do not
adverse effect on our consolidated financial position, results
use derivative financial instruments for speculative or
of operations or cash flows resulting from the use of these
trading purposes. We had $13 million (notional amount)
instruments in the future. We cannot give any assurance
of short-term foreign currency forward contracts denomi-
that these strategies will be effective or that transaction
nated in the Japanese yen, German mark and British
losses can be minimized or forecasted accurately.
pound outstanding as of December 27, 1998.
The following table provides information about our
We also have entered into various foreign currency option
foreign currency forward and option contracts as of
arrangements. In 1997, we purchased $150 million of call
December 27, 1998 and December 28, 1997.
option contracts to hedge our obligations to provide loans
1997
1998
Notional Average Estimated Notional Average Estimated
(Thousands except contract rates) amount contract rate fair value amount contract rate fair value
Foreign currency forward contracts:
Japanese yen $ 9,688 129.41 $ 76
$ 6,865 117.07 $ (22)
German mark 1,695 1.77 –
5,407 1.66 (7)
British pound 823 1.65 (6)
840 1.68 4
Dutch guilder 24,861 2.01 238
– – –
Italian lira 6,323 1,739.00 2
– – –
French franc 2,110 5.94 (1)
– – –
$ 48,500 $309
$ 13,11 2 $ (25)
Purchased call option contracts:
German mark $150,000 1.45 $ 369
$ 75,000 1.45 $ 45
Purchased put option contracts:
German mark $ – – $ –
$220,000 1.85 $ 1,547
Written call option contracts:
German mark $ – – $ –
$220,000 1.69 $ (13,469)
The purchased call option contracts mature in 1999. mature in 2000. All of our foreign currency forward
The purchased put and written call option contracts both contracts mature within the next 12 months.
and the current economic crisis in Asia. We anticipate
R i s k Fa c t o r s
Our business, results of operations and financial condi- that the economic crisis in Asia may continue to adversely
tion are subject to a number of risk factors, including affect our business. A further decline of the worldwide semi-
the following: conductor market and economic condition in Asia could
decrease the demand for microprocessors and other ICs.
Demand for Our Products Affected by Asian and
A significant decline in economic conditions in any signifi-
Other Domestic and International Economic Conditions
cant geographic area, both domestically and internationally,
The demand for our products has been weak due to the
could decrease the overall demand for our products.
general downturn in the worldwide semiconductor market
13
14. Management’s Discussion and Analysis of
Financial Condition and Results of Operations
To sell the volume of AMD-K6 and AMD-K7 micro-
Microprocessor Products
processors we currently plan to make in 1999 and 2000,
Fluctuations in PC Market. Since most of our micro-
we must increase sales to existing customers and develop
processor products are used in PCs and related peripherals,
new customers. If we lose any current top-tier Original
our future growth is closely tied to the performance of the
Equipment Manufacturer (OEM) customer, or if we fail
PC industry. Industry-wide fluctuations in the PC market-
to attract additional customers through direct sales and
place have in the past, and may in the future, materially
through our distributors, we may not be able to sell the
and adversely affect our business.
volume of units planned. This result could have a material
Investment in and Dependence on K86™ AMD Micro-
adverse effect on our business.
processor Products. Our microprocessor product revenues
Our production and sales plans for the AMD-K6 and
have in the past significantly impacted, and will continue
AMD-K7 microprocessors are subject to other risks
in 1999 and 2000 to significantly impact, our revenues,
and uncertainties, including:
profit margins and operating results. We plan to continue
• the timing of introduction and market acceptance
to make significant capital expenditures to support our
of the AMD-K7 microprocessor;
microprocessor products both in the near and long term.
• whether we can successfully fabricate higher-
These capital expenditures will be a substantial drain on
performance AMD-K6 and AMD-K7
our cash flow and cash balances.
microprocessors in planned volume mixes;
Our ability to increase microprocessor product revenues,
• the effects of Intel new product introductions,
and benefit fully from the substantial financial investments
marketing strategies and pricing;
and commitments we have made and continue to make
• the continued development of worldwide market
related to microprocessors, depends upon the success
acceptance for the AMD-K6 microprocessors and
of the AMD-K6-2 and AMD-K6-III microprocessors with
systems based on them;
3DNow! technology (the AMD-K6 family of micro-
• whether we will have the financial and other
processors or the AMD-K6 microprocessors), the AMD-K7
resources necessary to continue to invest in our
microprocessor, which is our seventh-generation Microsoft
microprocessor products, including leading-edge
Windows compatible microprocessor planned for intro-
wafer fabrication equipment and advanced
duction by the end of the first half of 1999, and future
process technologies;
generations of K86 microprocessors. The microprocessor
• the possibility that our newly introduced products
market is characterized by short product life cycles and
may be defective;
migration to ever higher performance microprocessors.
• adverse market conditions in the PC market
To compete successfully against Intel in this market, we
and consequent diminished demand for our
must transition to new process technologies at a faster
microprocessors; and
pace than before and offer higher performance micro-
• unexpected interruptions in our manufacturing
processors in significantly greater volumes. We must
operations.
achieve acceptable yields while producing microproces-
Because Intel dominates the industry and has brand
sors at higher speeds. In the past, including the last
strength, we price the AMD-K6 microprocessors below
few months, we have experienced significant difficulty
the published price of Intel processors offering com-
in achieving microprocessor yield and volume plans.
parable performance. Thus, Intel’s decisions on processor
Such difficulties have in the past and may in the future
prices can impact and have impacted the average selling
adversely affect our results of operations and liquidity.
prices of the AMD-K6 microprocessors, and consequently
If we fail to offer higher performance microprocessors
can impact and have impacted our margins. Our business
in significant volume on a timely basis in the future,
could be materially and adversely affected if we fail to:
our business could be materially and adversely affected.
• achieve the product performance improvements
We may not achieve the production ramp necessary to
necessary to meet customer needs;
meet our customers’ volume requirements for higher per-
• continue to achieve market acceptance of our
formance AMD-K6 and AMD-K7 microprocessors. It is
AMD-K6 microprocessors and increase market share;
also possible that we may not increase our microprocessor
• substantially increase revenues of the AMD-K6
revenues enough to achieve sustained profitability in the
family of microprocessors; and
AMD segment of our business.
• successfully introduce and ramp production of the
AMD-K7 microprocessor.
14
15. See also discussions below regarding Intel Dominance each new generation of Intel’s microprocessors only if
and Process Technology. Intel makes information about its products available
to them in time to address market opportunities. Delay
Intel Dominance. Intel has dominated the market for
in the availability of such information makes, and will
microprocessors used in PCs for a long time. Because of
continue to make, it increasingly difficult for these third
its dominant market position, Intel can set and control
parties to retain or regain market share.
x86 microprocessor and PC system standards and, thus,
dictate the type of product the market requires of Intel’s To compete with Intel in the microprocessor market in
competitors. In addition, Intel may vary prices on its the future, we intend to continue to form closer relation-
microprocessors and other products at will and thereby ships with third-party designers and manufacturers of
affect the margins and profitability of its competitors due core-logic chipsets, motherboards, BIOS software and
to its financial strength and dominant position. Intel may other components. Similarly, we intend to expand our
exert substantial influence over PC manufacturers through chipset and system design capabilities, and to offer OEMs
the Intel Inside advertising rebate program. Intel may also licensed system designs incorporating our microprocessors
invest hundreds of millions of dollars in, and as a result and companion products. We cannot be certain, however,
exert influence over, many other technology companies. that our efforts will be successful. We expect that, as
We expect Intel to continue to invest heavily in research Intel introduces future generations of microprocessors,
and development, new manufacturing facilities and other chipsets and motherboards, the design of chipsets, memory
technology companies, and to remain dominant: and other semiconductor devices, and higher level board
• through the Intel Inside program; products which support Intel microprocessors, will become
• through other contractual constraints on customers, increasingly dependent on the Intel microprocessor design
industry suppliers and other third parties; and and may become incompatible with non-Intel processor-
• by controlling industry standards. based PC systems.
As an extension of its dominant microprocessor market Intel’s Pentium® II and Celeron™ microprocessors are sold
share, Intel also now dominates the PC platform. As a only in form factors that are not physically or interface pro-
result, it is difficult for PC manufacturers to innovate and tocol compatible with “Socket 7” motherboards currently
differentiate their product offerings. We do not have the used with AMD-K6 microprocessors. Thus, Intel no longer
financial resources to compete with Intel on such a large supports the Socket 7 infrastructure as it has transitioned
scale. As long as Intel remains in this dominant position, away from its Pentium processors. Because the AMD-K6
we may be materially and adversely affected by its: microprocessors are designed to be Socket 7-compatible, and
• product introduction schedule; will not work with motherboards designed for Pentium II
• product pricing strategy; and and Celeron processors, we intend to continue to work with
• customer brand loyalty and control over industry third-party designers and manufacturers of motherboards,
standards, PC manufacturers and other PC industry chipsets and other products to ensure the continued avail-
participants. ability of Socket 7 infrastructure support for the AMD-K6
microprocessors, including support for enhancements and
As Intel has expanded its dominance over the PC system
features we add to our microprocessors. Socket 7 infra-
platform, many PC manufacturers have reduced their system
structure support for the AMD-K6 microprocessors may
development expenditures and have purchased micro-
not endure over time as Intel moves the market to its infra-
processors in conjunction with chipsets or in assembled
structure choices. We do not currently plan to develop
motherboards. PC OEMs have become increasingly depen-
microprocessors that are bus interface protocol compatible
dent on Intel, less innovative on their own and more of
with the Pentium II, Pentium III and Celeron processors
a distribution channel for Intel technology. In marketing
because our patent cross-license agreement with Intel
our microprocessors to these OEMs and dealers, we
does not extend to our microprocessors that are bus inter-
depend on companies other than Intel for the design and
face protocol compatible with Intel’s sixth and subsequent
manufacture of core-logic chipsets, motherboards, basic
generation processors. Similarly, our ability to compete
input/output system (BIOS) software and other compo-
with Intel in the market for seventh-generation and future
nents. In recent years, these third-party designers and
generation microprocessors will depend on our:
manufacturers have lost significant market share to Intel.
• success in designing and developing the micro-
In addition, these companies produce chipsets, mother-
processors; and
boards, BIOS software and other components to support
15