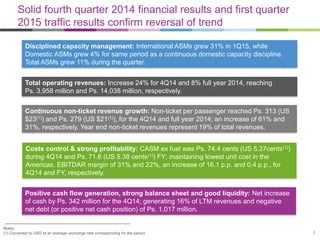
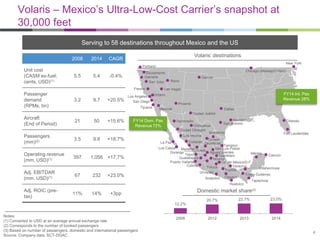
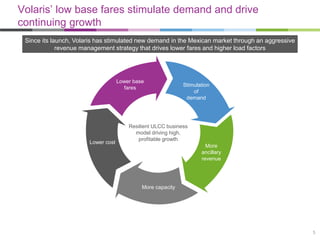
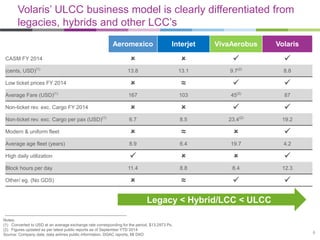
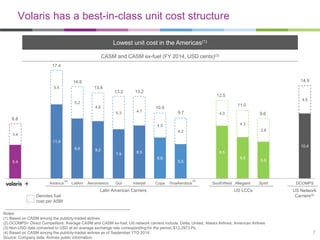
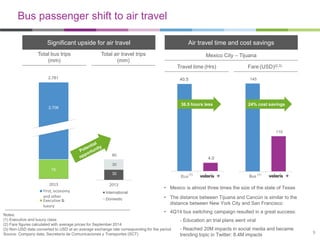
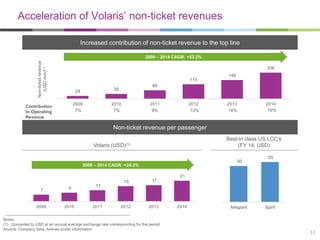
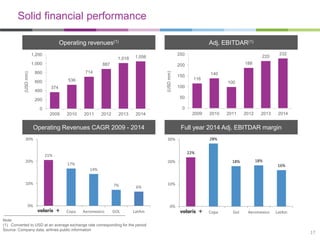
The Leading Ultra-Low-Cost Airline Serving
Mexico and the US
April 2015
Disclaimer
2
The information ("Confidential Information") contained in this presentation is confidential and is provided by Controladora
Vuela Compañía de Aviación, S.A.B. de C.V., (d/b/a Volaris, the "Company") confidentially to you solely for your reference
and may not be retransmitted or distributed to any other persons for any purpose whatsoever. The Confidential Information
is subject to change without notice, its accuracy is not guaranteed, it has not been independently verified and it may not
contain all material information concerning the Company. The Company, nor any of their respective directors makes any
representation or warranty (express or implied) regarding, or assumes any responsibility or liability for, the accuracy or
completeness of, or any errors or omissions in, any information or opinions contained herein. None of the Company or any
of their respective directors, officers, employees, stockholders or affiliates nor any other person accepts any liability (in
negligence, or otherwise) whatsoever for any loss howsoever arising from any use of this presentation or its contents or
otherwise arising in connection therewith. No reliance may be placed for any purposes whatsoever on the information set
forth in this presentation or on its completeness.
This presentation does not constitute or form part of any offer or invitation for sale or subscription of or solicitation or
invitation of any offer to buy or subscribe for any securities, nor shall it or any part of it form the basis of or be relied on in
connection with any contract or commitment whatsoever. Recipients of this presentation are not to construe the contents of
this presentation as legal, tax or investment advice and should consult their own advisers in this regard.
This presentation contains statements that constitute forward-looking statements which involve risks and uncertainties.
These statements include descriptions regarding the intent, belief or current expectations of the Company or its officers with
respect to the consolidated results of operations and financial condition, and future events and plans of the Company. These
statements can be recognized by the use of words such as "expects," "plans," "will," "estimates," "projects," or words of
similar meaning. Such forward-looking statements are not guarantees of future performance and actual results may differ
significantly from those in the forward-looking statements as a result of various factors and assumptions. You are cautioned
not to place undue reliance on these forward looking statements, which are based on the current view of the management of
the Company on future events. The Company does not undertake to revise forward-looking statements to reflect future
events or circumstances.
Solid fourth quarter 2014 financial results and first quarter
2015 traffic results confirm reversal of trend
Positive cash flow generation, strong balance sheet and good liquidity: Net increase
of cash by Ps. 342 million for the 4Q14; generating 16% of LTM revenues and negative
net debt (or positive net cash position) of Ps. 1,017 million.
Total operating revenues: Increase 24% for 4Q14 and 8% full year 2014, reaching
Ps. 3,958 million and Ps. 14,038 million, respectively.
Notes:
(1) Converted to USD at an average exchange rate corresponding for the period. 3
Disciplined capacity management: International ASMs grew 31% in 1Q15, while
Domestic ASMs grew 4% for same period as a continuous domestic capacity discipline.
Total ASMs grew 11% during the quarter.
Continuous non-ticket revenue growth: Non-ticket per passenger reached Ps. 313 (US
$23(1)) and Ps. 279 (US $21(1)), for the 4Q14 and full year 2014; an increase of 61% and
31%, respectively. Year end non-ticket revenues represent 19% of total revenues.
Costs control & strong profitability: CASM ex fuel was Ps. 74.4 cents (US 5.37cents(1))
during 4Q14 and Ps. 71.6 (US 5.38 cents(1)) FY; maintaining lowest unit cost in the
Americas. EBITDAR margin of 31% and 22%, an increase of 16.1 p.p. and 0.4 p.p., for
4Q14 and FY, respectively.
Sacramento
Oakland
Los Angeles
San Diego
Tijuana
San Jose
Fresno
Mexicali
Las Vegas
Chicago (Midway/O’Hare)
Denver
OrlandoHermosillo
Chihuahua
Monterrey
Cancún
La Paz
Los Cabos
Los Mochis
Culiacán
Mérida
Tuxtla Gutiérrez
Acapulco
Puebla
Toluca
Tepic
Zacatecas
Mazatlán
Guadalajara
Aguascalientes
Puerto Vallarta
Uruapan
Colima
Morelia
Oaxaca
León
Querétaro
Cd. de México/D.F.
Ciudad Juárez
Volaris – Mexico’s Ultra-Low-Cost Carrier’s snapshot at
30,000 feet
Notes:
(1) Converted to USD at an average annual exchange rate
(2) Corresponds to the number of booked passengers
(3) Based on number of passengers, domestic and international passengers
Source: Company data, SCT-DGAC
Serving to 58 destinations throughout Mexico and the US
2008 2014 CAGR
Unit cost
(CASM ex-fuel;
cents, USD)(1)
5.5 5.4 -0.4%
Passenger
demand
(RPMs, bn)
3.2 9.7 +20.5%
Aircraft
(End of Period)
21 50 +15.6%
Passengers
(mm)(2) 3.5 9.8 +18.7%
Operating revenue
(mm, USD)(1) 397 1,056 +17.7%
Adj. EBITDAR
(mm. USD)(1) 67 232 +23.0%
Adj. ROIC (pre-
tax)
11% 14% +3pp
Volaris’ destinations
Phoenix
San Luis Potosí
Ciudad Obregón
Veracruz
San Antonio
Ontario
Villahermosa
Tampico
Portland
Domestic market share(3)
FY14 Int. Pax
Revenue 28%
Tapachula
Huatulco
FY14 Dom. Pax
Revenue 72%
Fort Lauderdale
Reno
Houston
4
12.2%
20.7% 22.7% 23.0%
2008 2012 2013 2014
Dallas
Torreón
Durango
New York
Volaris’ low base fares stimulate demand and drive
continuing growth
Stimulation
of
demand
More
ancillary
revenue
More capacity
Lower base
fares
Resilient ULCC business
model driving high,
profitable growth
Lower cost
Since its launch, Volaris has stimulated new demand in the Mexican market through an aggressive
revenue management strategy that drives lower fares and higher load factors
5
Notes;
(1) Converted to USD at an average exchange rate corresponding for the period, $13.2973 Ps.
(2) Figures updated as per latest public reports as of September YTD 2014
Source: Company data, data airlines public information, DGAC reports, MI DIIO
Aeromexico Interjet VivaAerobus Volaris
CASM FY 2014    
(cents, USD)(1)
13.8 13.1 9.7(2)
8.8
Low ticket prices FY 2014  ≈  
Average Fare (USD)(1)
167 103 45(2)
87
Non-ticket rev. exc. Cargo FY 2014    
Non-ticket rev. exc. Cargo per pax (USD)(1)
6.7 8.5 23.4(2)
19.2
Modern & uniform fleet  ≈  
Average age fleet (years) 8.9 6.4 19.7 4.2
High daily utilization    
Block hours per day 11.4 8.8 8.4 12.3
Other/ eg. (No GDS)  ≈  
Legacy < Hybrid/LCC < ULCC
6
Volaris’ ULCC business model is clearly differentiated from
legacies, hybrids and other LCC’s
5.4
11.9
9.6 9.2
7.9 8.5
6.6
5.5
8.5
6.6
5.9
10.4
3.4
5.5
5.2
4.6
5.3 4.7
4.0
4.2
4.0
4.3
3.8
4.5
Avianca LatAm Aeromexico Gol Interjet Copa VivaAerobus SouthWest Allegiant Spirit DCOMPS
Volaris has a best-in-class unit cost structure
Denotes fuel
cost per ASM
Lowest unit cost in the Americas(1)
CASM and CASM ex-fuel (FY 2014, USD cents)(3)
Latin American Carriers US Network
Carriers(2)
US LCCs
Notes:
(1) Based on CASM among the publicly-traded airlines
(2) DCOMPS= Direct Competitors: Average CASM and CASM ex-fuel; US network carriers include: Delta, United, Alaska Airlines, American Airlines
(3) Non-USD data converted to USD at an average exchange rate corresponding for the period, $13.2973 Ps.
(4) Based on CASM among the publicly-traded airlines as of September YTD 2014
Source: Company data, Airlines public information
7
8.8
17.4
14.8
13.8
13.2
10.5
9.7
11.0
9.6
14.9
13.2
12.5
(4)(4)
12.3
11.4
8.8 8.4 8.8
8.1
Aeromexico Interjet VivaAerobus Global
A320
Global
A319
Young, fuel efficient fleet
Interjet
Focus on fleet utilization and efficiency drives higher revenue
and lower cost: A320 retrofit and A321 arrival(1)
Notes:
(1) A320 retrofit and factory fit to 179 seats/A321 arrival with 220 seats
(2) Implied passengers per aircraft is calculated as available seats per aircraft multiplied by the load factor
(3) Figures updated as per latest public reports as of September YTD 2014.
(4) Block hours per day calculated as ((Total block hours for the period / Monthly average number of aircraft) / Number of days for the period)
(5) Aeromexico, Interjet and VivaAerobus represent domestic competitors of Volaris
Source: Company data, airlines public information, DGAC, Airbus, miDiio
Load factor
(FY 2014)
Implied passengers
per aircraft(2)
82%
72%
79%
147
109
127Interjet A320
150 seats per aircraft
Aeromexico 737-800
160 seats per aircraft
High daily utilization
Volaris A320
179 seats per aircraft
High density configuration(5)
Aeromexico
Block hours per day (FY 2014)(4) Average age (Yrs, FY 2014)
8
VivaAerobus 737-300
148 seats per aircraft
VivaAerobus (3) 81% 120
19.7
10.5
8.9
6.4
4.2
VivaAerobus Mexican
Average
Aeromexico Interjet
2013
First, economy
and other
Executive &
luxury
145
110
Bus
Bus passenger shift to air travel
Notes:
(1) Executive and luxury class
(2) Fare figures calculated with average prices for September 2014
(3) Non-USD data converted to USD at an average exchange rate corresponding for the period
Source: Company data, Secretaría de Comunicaciones y Transportes (SCT)
Air travel time and cost savingsSignificant upside for air travel
Fare (USD)(2,3)Travel time (Hrs)
Mexico City – Tijuana
(1)
Total air travel trips
(mm)
Total bus trips
(mm)
40.5
4.0
Bus Air
36.5 hours less
• Mexico is almost three times the size of the state of Texas
• The distance between Tijuana and Cancún is similar to the
distance between New York City and San Francisco
• 4Q14 bus switching campaign resulted in a great success:
- Education an trial plans went viral
- Reached 20M impacts in social media and became
trending topic in Twitter: 8.4M impacts
24% cost savings
30
30
60
2013
International
Domestic
2,781
2,706
75
(1)
9
• Excess
baggage
• Checked
bag limited
to 1 piece
(25kgs.)
• Carry-on
(oversized)
• Strollers
• Priority
boarding
• Check-in
Unbundled strategy: “Tú decides” – You decide
• V-Club subscription
(113k active)
suscriptions)
• Co-branded credit
cards (106k active
cardholders)
• Manage my
booking
• Vempresa
• Travel
Commerce
•IOS mobile app
• Advertising
• Food and
beverage
• Hotel
rooms
• Car rentals
• Airport
shuttle
Pre-flight(1) Flight
planning
At the
airport
Onboard
aircraft
Post-flight
• Seat
assignment
• Change /
booking fees
• Insurance
• Packages
•Additional forms
of payment
Notes:
(1) V-Club & Co-branded credit cards figures as of January 31th,2015 10
7 9
11
15 17
21
2009 2010 2011 2012 2013 2014
Acceleration of Volaris’ non-ticket revenues
Notes:
(1) Converted to USD at an annual average exchange rate corresponding for the period
Source: Company data, Airlines public information
Increased contribution of non-ticket revenue to the top line
Non-ticket revenue per passenger
Volaris (USD)(1)
Best-in class US LCC’s
(FY 14, USD)
Contribution
to Operating
Revenue
7% 7% 9% 13% 14%
2009 – 2014 CAGR: +53.2%
2009 – 2014 CAGR: +24.5%
Non-ticketrevenue
(USDmm)(1)
19%
11
24 39
68
115
148
206
2009 2010 2011 2012 2013 2014
50
55
Allegiant Spirit
Notes:
(1) Minimum stage length of 170 miles
(2) Minimum stage length of 200 miles; CAM stands for Central America; SAM stands for South America
(3) South and northbound leisure routes
(4) Figures calculated as of December 2014.
Source: Company data and DIIO MI Market Intelligence for the Aviation Industry
48 48
41 40
38
13
0
10
20
30
40
50 99
48
32
0
25
50
75
100
USA (Leisure) USA (VFR) CAM, SAM,
Canada,…
Attractive growth opportunities in Mexico and
throughout the Americas
Domestic – growth potential of nearly 122
routes (4)
International – growth potential of about 139
routes (4)
(3)
Number of routes(1)
Number of routes(2)
Routes served Growth potential
12
Capacity – ASMs
(Year-over-year change) 4Q14 FY14 1Q15 FY15E
Total 3% 9% 11% 10% - 12%
Domestic -1% 6% 4% 2% - 4%
International 14% 17% 31% 33% - 36%
Substantial growth opportunity in the US-Mexico VFR /
leisure travel market
Notes:
(1) Represents Mexican origin population figures as per population data released on May 26, 2011
(2) Mexican origin is based on self-described ancestry, lineage, heritage, nationality group or country of birth.
Source: Pew Research Hispanic Center
Denotes Volaris
presence(1)
Denotes other cities with large
Mexican origin populations(1,2)
Significant Mexican origin
population(2) of 33.7 million
in the US
Orlando
0.1mm
San
Francisco
0.7mm
San Jose
0.4mm
San
Diego
0.9mm
Denver
0.5mmSacramento
0.3mm
Chicago
1.5mm
Fresno
0.5mm
Los Angeles
4.6mm
Las Vegas
0.4mm
San
Bernardino
1.7mm
Phoenix
1.2mm
Tucson
0.3mm
Albuquerque
0.2mm
El Paso
0.6mm
San Antonio
0.9mm
Bakersfield
0.4mm
Austin
0.4mm
Dallas
1.5mm
Houston
1.5mm
Atlanta
0.3mm
Washington
0.1mm
New York
0.5mm
Philadelphia
0.1mm
San Benito
0.3mm
Mission
0.6mm
Tampa
0.1mm
Portland
0.2mm
Miami
0.1mm
13
17
23 26
36
Dec' 11 Dec' 12 Dec' 13 Dec' 14
Positive expansion, managing capacity and diversification of
routes
Notes:
(1) Capacity measured by ASM’s
Source: Data company, SCT-DGAC, DIIO MI
Percentage of Volaris’ 1Q15 domestic capacity competing with:
Volaris offers more domestic routes than any other Mexican carrier
A significant portion of our capacity faces no competition(1)
Volaris flown domestic routes Volaris flown international routes
More than 2x More than 2x
14
67% 66%
30%
20%
Aeromexico Interjet Vivaaerobus Non-competed
39
50
78
93
Dec' 11 Dec' 12 Dec' 13 Dec' 14
Fleet and financials
15
20 18 17
12
24
23 22
19
9 14
23
22
3
FY13 FY14 FY15 FY16
A319 A320 A320 w/Sharklets A320 NEO w/Sharklets A321 w/Sharklets
A higher density fleet generates more incremental capacity
with fewer additional aircraft
Projected fleet under current contracts (number of aircraft)(1)
Notes:
(1) Net fleet after additions and returns
(2) Figure calculated as of February 2015
(3) Percentage of year-end fleet with sharklets
Source: Company data
Backlog of 60 Aircraft to support growth(2)
Seat growth
% fleet w/Sharklets(3)
7%
18%
13%
29%
14%
47%
50
55
59
44
16
22%
28%
18% 18%
16%
0%
10%
20%
30%
Copa Gol Aeromexico LatAm
21%
17%
14%
7% 6%
0%
10%
20%
30%
Copa Aeromexico GOL LatAm
Solid financial performance
Note:
(1) Converted to USD at an average exchange rate corresponding for the period
Source: Company data, airlines public information
Operating revenues(1) Adj. EBITDAR(1)
Operating Revenues CAGR 2009 - 2014 Full year 2014 Adj. EBITDAR margin
17
374
536
714
887
1,018 1,056
0
200
400
600
800
1,000
1,200
2009 2010 2011 2012 2013 2014
(USDmm)
116
140
100
188
220
232
0
50
100
150
200
250
2009 2010 2011 2012 2013 2014
(USDmm)
16.1%
28.1%
22.2%
7.9% 7.4%
Copa GOL LatAm Aeromexico
LTM Liquidity – Cash and Equivalents / Op.
Revenue
Solid balance sheet and liquidity, well funded for growth
Note:
(1) Principal + interest debt
(2) Includes IPO Smiles program proceeds
(3) Figures updated as per latest annual public reports as of December 2014
(4) Figures converted to USD December end of the period spot exchange rate $14.7180, for convenience purposes only
Source: Company data, Airlines public information
(2)
18
• IPO provided sufficient liquidity / capital
for growth over the next years
• Fully financed pre-delivery payments and
executed sale-leasebacks for all
deliveries in 2015 and 2016
• A good liquidity position to strengthen our
balance sheet
• Unrestricted cash of $2.3 billion pesos
(US$ 154 million (4)) as of December 31st
2014
• Negative net debt of $1,017 million pesos
as of December 31st 2014
Active in jet fuel hedging, reaching up to 45% of projected
consumption for 2015 and 2016
19
Period Total % hedged Avg. price (gal/USD$) Instrument
1Q15 29% $2.53 Swap/Call
2Q15 45% $2.15 Swap/Call
3Q-4Q15 45% $2.07 Call
1Q16 45% $1.95 Call
2Q16 40% $1.95 Call
3Q-4Q16 35% $1.99 Call
Appendix
20
Non-IFRS Terms Glossary
• Available seat miles (ASMs): Number of seats available for passengers multiplied by the number of miles the seats are flown.
• Block hours: Number of hours during which the aircraft is in revenue service, measured from the time it leaves the gate until the
time it arrives to the gate at destination.
• Revenue passenger miles (RPMs): Means the number of miles flown by passengers.
• TRASM: Total revenue divided by ASMs.
• RASM: Passenger revenue divided by ASMs.
• CASM: Total operating expenses, net divided by ASMs.
• CASM ex fuel: Total operating expenses, net excluding fuel expense divided by ASMs.
• Load factor: RPMs divided by ASMs and expressed as a percentage.
• EBITDA: Earnings before interest, taxes, depreciation and amortization.
• EBITDAR: Earnings before interest, taxes, depreciation, amortization and aircraft rent expense.
• Adj. EBITDAR: EBITDAR adjusted by non-cash and non-recurring items.
• Adj. Debt: Financial debt plus seven times the aircraft rent expense.
• Adj. Net debt: Adj. Debt minus cash and cash equivalents.
• VFR: Passengers who are visiting friends and relatives.
21
MXN millions unless otherwise stated (2) 2012A 2013A 2014A 2014A (1) 4Q 2014A 4Q 2014A (1)
% of total
operating
revenues
(USD
millions)
(USD
millions)
Passenger 10,177 11,117 11,303 768 3,140 213 79.3
Non-ticket 1,510 1,885 2,733 186 818 56 20.7
Total operating revenues 11,686 13,002 14,037 954 3,958 269 100
Fuel 4,730 5,086 5,364 364 1,276 87 32.2
Aircraft and engines rent expense 1,886 2,187 2,535 172 675 46 17.1
Salaries and benefits 1,303 1,563 1,577 107 402 27 10.2
Landing, take off and navigation expenses 1,640 1,924 2,066 140 488 33 12.3
Sales, marketing and distribution expenses 752 704 817 56 227 15 5.7
Maintenance expenses 499 572 665 45 192 13 4.8
Other operating expense 288 347 468 32 134 9 3.4
Depreciation and amortization 211 302 343 23 138 9 3.5
Total operating expenses 11,308 12,685 13,833 940 3,532 240 89.26
EBIT 378 317 204 14 426 29 10.8
Operating margin (%) 3.2 2.4 1.5 1.5 10.8 10.8
Finance income 14 25 23 2 6 - 0.2
Finance cost (90) (126) (32) (2) (9) (1) (0.2)
Exchange (loss) gain, net (95) 66 449 30 336 23 8.5
Income tax expense (3) (18) (39) (3) (57) (4) (1.4)
Net income 203 265 605 41 703 48 17.8
Net margin (%) 1.7 2.0 4.3 4.3 17.8 17.8
Net income excluding special items (3)
203 379 605 41 703 48 17.8
Adjusted EBITDAR 2,475 2,806 3,081 209 1,239 84 31.3
Adj. EBITDAR margin (%) 21.2 21.6 22.0 22.0 31.3 31.3
EPS Basic and Diluted 0.29 0.31 0.60 0.04 0.69 0.05
EPADS Basic and Diluted 2.94 3.10 5.98 0.41 6.95 0.47
Consolidated statements of operations summary
Notes:
(1) Figures converted to USD December end of the period spot exchange rate $14.7180, for convenience purposes only
(2) Audited financial information 2012A – 2013A
(3) Excludes debt prepayment of Ps.65 million, and reservation system migration costs and other non-recurring items of Ps.48 million.
Source: Company data
22
Consolidated statements of financial position summary
Nota:
(1) Figures converted to USD December end of the period spot exchange rate $14.7180, for convenience purposes only
(2) Net debt = financial debt - cash and cash equivalents
(3) Adjusted debt = (LTM aircraft rent expense x 7) + financial debt
(4) Adjusted net debt = adjusted debt - cash and cash equivalents
(5) Audited financial information 2012A – 2013A
Source: Company data
MXN millions unless otherwise stated (5) 2012A 2013A 2014A 2014A (1)
(USD millions)
Cash and cash equivalents 822 2,451 2,265 154
Current guarantee deposits 238 499 545 37
Other current assets 755 1,050 879 60
Total current assets 1,815 4,000 3,689 251
Rotable spare parts, furniture and
equipment, net 1,195 1,341 2,223 151
Non-current guarantee deposits 2,245 2,603 3,541 241
Other non-current assets 447 434 452 31
Total assets 5,702 8,378 9,905 673
Unearned transportation revenue 1,259 1,393 1,421 97
Short-term financial debt 527 268 823 56
Other short-term liabilities 1,936 2,211 2,524 172
Total short-term liabilities 3,722 3,872 4,768 324
Long-term financial debt 633 294 425 29
Other long-term liabilities 272 250 242 16
Total liabilities 4,627 4,416 5,435 369
Total equity 1,075 3,962 4,470 304
Total liabilities and equity 5,702 8,378 9,905 673
Net debt (2) 338 (1,889) (1,017) (69)
Adjusted debt (3) 14,360 15,874 18,990 1,290
Adjusted net debt (4) 13,538 13,423 16,725 1,136
23
Consolidated statements of cash flows summary
Notes:
(1) Figures converted to USD December end of the period spot exchange rate $14.7180, for convenience purposes only
(2) Audited financial information 2012A - 2013A
Source: Company data
MXN millions unless otherwise stated (2) 2012A 2013A 4Q 2014A 4Q 2014A (1)2014A 2014A (1)
(USD millions) (USD millions)
Cash flow from operating activities
Income before income tax 207 283 644 44 760 52
Depreciation and amortization 211 302 343 23 138 9
Guarantee deposits (311) (620) (695) (47) (265) (18)
Unearned transportation revenue 433 135 27 2 (74) (5)
Changes in working capital and provisions (43) (61) 14 1 (90) (6)
Net cash flows provided by operating activities 497 39 334 23 470 32
Cash flow from investing activities
Acquisitions of rotable spare parts, furniture, equipment and
intangible assets (856) (1,161) (1,603) (109) (513) (35)
Proceeds from disposals of rotable spare parts, furniture and
equipment 1,043 849 418 28 141 10
Net cash flows provided by (used in) investing activities 187 (312) (1,185) (81) (372) (25)
Cash flow from financing activities
Payments of Treasury Shares - - (7) - (7) -
Net proceeds from initial public offering - 2,578 - - - -
Transaction costs on issue of shares - (38) - - - -
Proceeds from exercised treasury shares - 26 - - - -
Interest paid (127) (65) (23) (2) (7) -
Other financing costs - - (11) (1) (4) -
Payments of financial debt (694) (1,084) (400) (27) (132) (9)
Proceeds from financial debt 550 444 966 66 395 27
Net cash flows (used in) provided by financing activities (272) 1,861 525 36 245 17
Increase (decrease) in cash and cash equivalents 412 1,588 (326) (22) 342 23
Net foreign exchange differences (31) 41 141 10 108 7
Cash and cash equivalents at beginning of period 441 822 2,451 167 1,814 123
Cash and cash equivalents at end of period 822 2,451 2,265 154 2,265 154
24
Adj. EBITDA and Adj. EBITDAR reconciliation
Notes:
(1) Figures converted to USD December end of the period spot exchange rate $14.7180, for convenience purposes only
(2) Audited financial information 2012A - 2013A
Source: Company data
MXN millions unless otherwise stated (2) 2012A 2013A 2014A 2014A (1) 4Q 2014A 4Q 2014A (1)
(USD
millions)
(USD
millions)
Net income 203 265 605 41 703 48
Plus (minus):
Finance costs 90 126 32 2 9 1
Finance income (14) (25) (23) (2) (6) -
(Benefit)/provision for income taxes 3 18 39 3 57 4
Depreciation and amortization 211 302 343 23 138 9
Business alliance amortization - - - - - -
EBITDA 494 685 996 68 900 61
Exchange (gain) loss, net 95 (66) (449) (30) (336) (23)
Other financing cost (income), net - - - - - -
Adjusted EBITDA 589 619 547 37 564 38
Aircraft and engine rent expense 1,886 2,187 2,535 172 675 46
Adjusted EBITDAR 2,475 2,806 3,081 209 1,239 84
25

Volaris corporate presentation april

  • 1.
    The Leading Ultra-Low-CostAirline Serving Mexico and the US April 2015
  • 2.
    Disclaimer 2 The information ("ConfidentialInformation") contained in this presentation is confidential and is provided by Controladora Vuela Compañía de Aviación, S.A.B. de C.V., (d/b/a Volaris, the "Company") confidentially to you solely for your reference and may not be retransmitted or distributed to any other persons for any purpose whatsoever. The Confidential Information is subject to change without notice, its accuracy is not guaranteed, it has not been independently verified and it may not contain all material information concerning the Company. The Company, nor any of their respective directors makes any representation or warranty (express or implied) regarding, or assumes any responsibility or liability for, the accuracy or completeness of, or any errors or omissions in, any information or opinions contained herein. None of the Company or any of their respective directors, officers, employees, stockholders or affiliates nor any other person accepts any liability (in negligence, or otherwise) whatsoever for any loss howsoever arising from any use of this presentation or its contents or otherwise arising in connection therewith. No reliance may be placed for any purposes whatsoever on the information set forth in this presentation or on its completeness. This presentation does not constitute or form part of any offer or invitation for sale or subscription of or solicitation or invitation of any offer to buy or subscribe for any securities, nor shall it or any part of it form the basis of or be relied on in connection with any contract or commitment whatsoever. Recipients of this presentation are not to construe the contents of this presentation as legal, tax or investment advice and should consult their own advisers in this regard. This presentation contains statements that constitute forward-looking statements which involve risks and uncertainties. These statements include descriptions regarding the intent, belief or current expectations of the Company or its officers with respect to the consolidated results of operations and financial condition, and future events and plans of the Company. These statements can be recognized by the use of words such as "expects," "plans," "will," "estimates," "projects," or words of similar meaning. Such forward-looking statements are not guarantees of future performance and actual results may differ significantly from those in the forward-looking statements as a result of various factors and assumptions. You are cautioned not to place undue reliance on these forward looking statements, which are based on the current view of the management of the Company on future events. The Company does not undertake to revise forward-looking statements to reflect future events or circumstances.
  • 3.
    Solid fourth quarter2014 financial results and first quarter 2015 traffic results confirm reversal of trend Positive cash flow generation, strong balance sheet and good liquidity: Net increase of cash by Ps. 342 million for the 4Q14; generating 16% of LTM revenues and negative net debt (or positive net cash position) of Ps. 1,017 million. Total operating revenues: Increase 24% for 4Q14 and 8% full year 2014, reaching Ps. 3,958 million and Ps. 14,038 million, respectively. Notes: (1) Converted to USD at an average exchange rate corresponding for the period. 3 Disciplined capacity management: International ASMs grew 31% in 1Q15, while Domestic ASMs grew 4% for same period as a continuous domestic capacity discipline. Total ASMs grew 11% during the quarter. Continuous non-ticket revenue growth: Non-ticket per passenger reached Ps. 313 (US $23(1)) and Ps. 279 (US $21(1)), for the 4Q14 and full year 2014; an increase of 61% and 31%, respectively. Year end non-ticket revenues represent 19% of total revenues. Costs control & strong profitability: CASM ex fuel was Ps. 74.4 cents (US 5.37cents(1)) during 4Q14 and Ps. 71.6 (US 5.38 cents(1)) FY; maintaining lowest unit cost in the Americas. EBITDAR margin of 31% and 22%, an increase of 16.1 p.p. and 0.4 p.p., for 4Q14 and FY, respectively.
  • 4.
    Sacramento Oakland Los Angeles San Diego Tijuana SanJose Fresno Mexicali Las Vegas Chicago (Midway/O’Hare) Denver OrlandoHermosillo Chihuahua Monterrey Cancún La Paz Los Cabos Los Mochis Culiacán Mérida Tuxtla Gutiérrez Acapulco Puebla Toluca Tepic Zacatecas Mazatlán Guadalajara Aguascalientes Puerto Vallarta Uruapan Colima Morelia Oaxaca León Querétaro Cd. de México/D.F. Ciudad Juárez Volaris – Mexico’s Ultra-Low-Cost Carrier’s snapshot at 30,000 feet Notes: (1) Converted to USD at an average annual exchange rate (2) Corresponds to the number of booked passengers (3) Based on number of passengers, domestic and international passengers Source: Company data, SCT-DGAC Serving to 58 destinations throughout Mexico and the US 2008 2014 CAGR Unit cost (CASM ex-fuel; cents, USD)(1) 5.5 5.4 -0.4% Passenger demand (RPMs, bn) 3.2 9.7 +20.5% Aircraft (End of Period) 21 50 +15.6% Passengers (mm)(2) 3.5 9.8 +18.7% Operating revenue (mm, USD)(1) 397 1,056 +17.7% Adj. EBITDAR (mm. USD)(1) 67 232 +23.0% Adj. ROIC (pre- tax) 11% 14% +3pp Volaris’ destinations Phoenix San Luis Potosí Ciudad Obregón Veracruz San Antonio Ontario Villahermosa Tampico Portland Domestic market share(3) FY14 Int. Pax Revenue 28% Tapachula Huatulco FY14 Dom. Pax Revenue 72% Fort Lauderdale Reno Houston 4 12.2% 20.7% 22.7% 23.0% 2008 2012 2013 2014 Dallas Torreón Durango New York
  • 5.
    Volaris’ low basefares stimulate demand and drive continuing growth Stimulation of demand More ancillary revenue More capacity Lower base fares Resilient ULCC business model driving high, profitable growth Lower cost Since its launch, Volaris has stimulated new demand in the Mexican market through an aggressive revenue management strategy that drives lower fares and higher load factors 5
  • 6.
    Notes; (1) Converted toUSD at an average exchange rate corresponding for the period, $13.2973 Ps. (2) Figures updated as per latest public reports as of September YTD 2014 Source: Company data, data airlines public information, DGAC reports, MI DIIO Aeromexico Interjet VivaAerobus Volaris CASM FY 2014     (cents, USD)(1) 13.8 13.1 9.7(2) 8.8 Low ticket prices FY 2014  ≈   Average Fare (USD)(1) 167 103 45(2) 87 Non-ticket rev. exc. Cargo FY 2014     Non-ticket rev. exc. Cargo per pax (USD)(1) 6.7 8.5 23.4(2) 19.2 Modern & uniform fleet  ≈   Average age fleet (years) 8.9 6.4 19.7 4.2 High daily utilization     Block hours per day 11.4 8.8 8.4 12.3 Other/ eg. (No GDS)  ≈   Legacy < Hybrid/LCC < ULCC 6 Volaris’ ULCC business model is clearly differentiated from legacies, hybrids and other LCC’s
  • 7.
    5.4 11.9 9.6 9.2 7.9 8.5 6.6 5.5 8.5 6.6 5.9 10.4 3.4 5.5 5.2 4.6 5.34.7 4.0 4.2 4.0 4.3 3.8 4.5 Avianca LatAm Aeromexico Gol Interjet Copa VivaAerobus SouthWest Allegiant Spirit DCOMPS Volaris has a best-in-class unit cost structure Denotes fuel cost per ASM Lowest unit cost in the Americas(1) CASM and CASM ex-fuel (FY 2014, USD cents)(3) Latin American Carriers US Network Carriers(2) US LCCs Notes: (1) Based on CASM among the publicly-traded airlines (2) DCOMPS= Direct Competitors: Average CASM and CASM ex-fuel; US network carriers include: Delta, United, Alaska Airlines, American Airlines (3) Non-USD data converted to USD at an average exchange rate corresponding for the period, $13.2973 Ps. (4) Based on CASM among the publicly-traded airlines as of September YTD 2014 Source: Company data, Airlines public information 7 8.8 17.4 14.8 13.8 13.2 10.5 9.7 11.0 9.6 14.9 13.2 12.5 (4)(4)
  • 8.
    12.3 11.4 8.8 8.4 8.8 8.1 AeromexicoInterjet VivaAerobus Global A320 Global A319 Young, fuel efficient fleet Interjet Focus on fleet utilization and efficiency drives higher revenue and lower cost: A320 retrofit and A321 arrival(1) Notes: (1) A320 retrofit and factory fit to 179 seats/A321 arrival with 220 seats (2) Implied passengers per aircraft is calculated as available seats per aircraft multiplied by the load factor (3) Figures updated as per latest public reports as of September YTD 2014. (4) Block hours per day calculated as ((Total block hours for the period / Monthly average number of aircraft) / Number of days for the period) (5) Aeromexico, Interjet and VivaAerobus represent domestic competitors of Volaris Source: Company data, airlines public information, DGAC, Airbus, miDiio Load factor (FY 2014) Implied passengers per aircraft(2) 82% 72% 79% 147 109 127Interjet A320 150 seats per aircraft Aeromexico 737-800 160 seats per aircraft High daily utilization Volaris A320 179 seats per aircraft High density configuration(5) Aeromexico Block hours per day (FY 2014)(4) Average age (Yrs, FY 2014) 8 VivaAerobus 737-300 148 seats per aircraft VivaAerobus (3) 81% 120 19.7 10.5 8.9 6.4 4.2 VivaAerobus Mexican Average Aeromexico Interjet
  • 9.
    2013 First, economy and other Executive& luxury 145 110 Bus Bus passenger shift to air travel Notes: (1) Executive and luxury class (2) Fare figures calculated with average prices for September 2014 (3) Non-USD data converted to USD at an average exchange rate corresponding for the period Source: Company data, Secretaría de Comunicaciones y Transportes (SCT) Air travel time and cost savingsSignificant upside for air travel Fare (USD)(2,3)Travel time (Hrs) Mexico City – Tijuana (1) Total air travel trips (mm) Total bus trips (mm) 40.5 4.0 Bus Air 36.5 hours less • Mexico is almost three times the size of the state of Texas • The distance between Tijuana and Cancún is similar to the distance between New York City and San Francisco • 4Q14 bus switching campaign resulted in a great success: - Education an trial plans went viral - Reached 20M impacts in social media and became trending topic in Twitter: 8.4M impacts 24% cost savings 30 30 60 2013 International Domestic 2,781 2,706 75 (1) 9
  • 10.
    • Excess baggage • Checked baglimited to 1 piece (25kgs.) • Carry-on (oversized) • Strollers • Priority boarding • Check-in Unbundled strategy: “Tú decides” – You decide • V-Club subscription (113k active) suscriptions) • Co-branded credit cards (106k active cardholders) • Manage my booking • Vempresa • Travel Commerce •IOS mobile app • Advertising • Food and beverage • Hotel rooms • Car rentals • Airport shuttle Pre-flight(1) Flight planning At the airport Onboard aircraft Post-flight • Seat assignment • Change / booking fees • Insurance • Packages •Additional forms of payment Notes: (1) V-Club & Co-branded credit cards figures as of January 31th,2015 10
  • 11.
    7 9 11 15 17 21 20092010 2011 2012 2013 2014 Acceleration of Volaris’ non-ticket revenues Notes: (1) Converted to USD at an annual average exchange rate corresponding for the period Source: Company data, Airlines public information Increased contribution of non-ticket revenue to the top line Non-ticket revenue per passenger Volaris (USD)(1) Best-in class US LCC’s (FY 14, USD) Contribution to Operating Revenue 7% 7% 9% 13% 14% 2009 – 2014 CAGR: +53.2% 2009 – 2014 CAGR: +24.5% Non-ticketrevenue (USDmm)(1) 19% 11 24 39 68 115 148 206 2009 2010 2011 2012 2013 2014 50 55 Allegiant Spirit
  • 12.
    Notes: (1) Minimum stagelength of 170 miles (2) Minimum stage length of 200 miles; CAM stands for Central America; SAM stands for South America (3) South and northbound leisure routes (4) Figures calculated as of December 2014. Source: Company data and DIIO MI Market Intelligence for the Aviation Industry 48 48 41 40 38 13 0 10 20 30 40 50 99 48 32 0 25 50 75 100 USA (Leisure) USA (VFR) CAM, SAM, Canada,… Attractive growth opportunities in Mexico and throughout the Americas Domestic – growth potential of nearly 122 routes (4) International – growth potential of about 139 routes (4) (3) Number of routes(1) Number of routes(2) Routes served Growth potential 12 Capacity – ASMs (Year-over-year change) 4Q14 FY14 1Q15 FY15E Total 3% 9% 11% 10% - 12% Domestic -1% 6% 4% 2% - 4% International 14% 17% 31% 33% - 36%
  • 13.
    Substantial growth opportunityin the US-Mexico VFR / leisure travel market Notes: (1) Represents Mexican origin population figures as per population data released on May 26, 2011 (2) Mexican origin is based on self-described ancestry, lineage, heritage, nationality group or country of birth. Source: Pew Research Hispanic Center Denotes Volaris presence(1) Denotes other cities with large Mexican origin populations(1,2) Significant Mexican origin population(2) of 33.7 million in the US Orlando 0.1mm San Francisco 0.7mm San Jose 0.4mm San Diego 0.9mm Denver 0.5mmSacramento 0.3mm Chicago 1.5mm Fresno 0.5mm Los Angeles 4.6mm Las Vegas 0.4mm San Bernardino 1.7mm Phoenix 1.2mm Tucson 0.3mm Albuquerque 0.2mm El Paso 0.6mm San Antonio 0.9mm Bakersfield 0.4mm Austin 0.4mm Dallas 1.5mm Houston 1.5mm Atlanta 0.3mm Washington 0.1mm New York 0.5mm Philadelphia 0.1mm San Benito 0.3mm Mission 0.6mm Tampa 0.1mm Portland 0.2mm Miami 0.1mm 13
  • 14.
    17 23 26 36 Dec' 11Dec' 12 Dec' 13 Dec' 14 Positive expansion, managing capacity and diversification of routes Notes: (1) Capacity measured by ASM’s Source: Data company, SCT-DGAC, DIIO MI Percentage of Volaris’ 1Q15 domestic capacity competing with: Volaris offers more domestic routes than any other Mexican carrier A significant portion of our capacity faces no competition(1) Volaris flown domestic routes Volaris flown international routes More than 2x More than 2x 14 67% 66% 30% 20% Aeromexico Interjet Vivaaerobus Non-competed 39 50 78 93 Dec' 11 Dec' 12 Dec' 13 Dec' 14
  • 15.
  • 16.
    20 18 17 12 24 2322 19 9 14 23 22 3 FY13 FY14 FY15 FY16 A319 A320 A320 w/Sharklets A320 NEO w/Sharklets A321 w/Sharklets A higher density fleet generates more incremental capacity with fewer additional aircraft Projected fleet under current contracts (number of aircraft)(1) Notes: (1) Net fleet after additions and returns (2) Figure calculated as of February 2015 (3) Percentage of year-end fleet with sharklets Source: Company data Backlog of 60 Aircraft to support growth(2) Seat growth % fleet w/Sharklets(3) 7% 18% 13% 29% 14% 47% 50 55 59 44 16
  • 17.
    22% 28% 18% 18% 16% 0% 10% 20% 30% Copa GolAeromexico LatAm 21% 17% 14% 7% 6% 0% 10% 20% 30% Copa Aeromexico GOL LatAm Solid financial performance Note: (1) Converted to USD at an average exchange rate corresponding for the period Source: Company data, airlines public information Operating revenues(1) Adj. EBITDAR(1) Operating Revenues CAGR 2009 - 2014 Full year 2014 Adj. EBITDAR margin 17 374 536 714 887 1,018 1,056 0 200 400 600 800 1,000 1,200 2009 2010 2011 2012 2013 2014 (USDmm) 116 140 100 188 220 232 0 50 100 150 200 250 2009 2010 2011 2012 2013 2014 (USDmm)
  • 18.
    16.1% 28.1% 22.2% 7.9% 7.4% Copa GOLLatAm Aeromexico LTM Liquidity – Cash and Equivalents / Op. Revenue Solid balance sheet and liquidity, well funded for growth Note: (1) Principal + interest debt (2) Includes IPO Smiles program proceeds (3) Figures updated as per latest annual public reports as of December 2014 (4) Figures converted to USD December end of the period spot exchange rate $14.7180, for convenience purposes only Source: Company data, Airlines public information (2) 18 • IPO provided sufficient liquidity / capital for growth over the next years • Fully financed pre-delivery payments and executed sale-leasebacks for all deliveries in 2015 and 2016 • A good liquidity position to strengthen our balance sheet • Unrestricted cash of $2.3 billion pesos (US$ 154 million (4)) as of December 31st 2014 • Negative net debt of $1,017 million pesos as of December 31st 2014
  • 19.
    Active in jetfuel hedging, reaching up to 45% of projected consumption for 2015 and 2016 19 Period Total % hedged Avg. price (gal/USD$) Instrument 1Q15 29% $2.53 Swap/Call 2Q15 45% $2.15 Swap/Call 3Q-4Q15 45% $2.07 Call 1Q16 45% $1.95 Call 2Q16 40% $1.95 Call 3Q-4Q16 35% $1.99 Call
  • 20.
  • 21.
    Non-IFRS Terms Glossary •Available seat miles (ASMs): Number of seats available for passengers multiplied by the number of miles the seats are flown. • Block hours: Number of hours during which the aircraft is in revenue service, measured from the time it leaves the gate until the time it arrives to the gate at destination. • Revenue passenger miles (RPMs): Means the number of miles flown by passengers. • TRASM: Total revenue divided by ASMs. • RASM: Passenger revenue divided by ASMs. • CASM: Total operating expenses, net divided by ASMs. • CASM ex fuel: Total operating expenses, net excluding fuel expense divided by ASMs. • Load factor: RPMs divided by ASMs and expressed as a percentage. • EBITDA: Earnings before interest, taxes, depreciation and amortization. • EBITDAR: Earnings before interest, taxes, depreciation, amortization and aircraft rent expense. • Adj. EBITDAR: EBITDAR adjusted by non-cash and non-recurring items. • Adj. Debt: Financial debt plus seven times the aircraft rent expense. • Adj. Net debt: Adj. Debt minus cash and cash equivalents. • VFR: Passengers who are visiting friends and relatives. 21
  • 22.
    MXN millions unlessotherwise stated (2) 2012A 2013A 2014A 2014A (1) 4Q 2014A 4Q 2014A (1) % of total operating revenues (USD millions) (USD millions) Passenger 10,177 11,117 11,303 768 3,140 213 79.3 Non-ticket 1,510 1,885 2,733 186 818 56 20.7 Total operating revenues 11,686 13,002 14,037 954 3,958 269 100 Fuel 4,730 5,086 5,364 364 1,276 87 32.2 Aircraft and engines rent expense 1,886 2,187 2,535 172 675 46 17.1 Salaries and benefits 1,303 1,563 1,577 107 402 27 10.2 Landing, take off and navigation expenses 1,640 1,924 2,066 140 488 33 12.3 Sales, marketing and distribution expenses 752 704 817 56 227 15 5.7 Maintenance expenses 499 572 665 45 192 13 4.8 Other operating expense 288 347 468 32 134 9 3.4 Depreciation and amortization 211 302 343 23 138 9 3.5 Total operating expenses 11,308 12,685 13,833 940 3,532 240 89.26 EBIT 378 317 204 14 426 29 10.8 Operating margin (%) 3.2 2.4 1.5 1.5 10.8 10.8 Finance income 14 25 23 2 6 - 0.2 Finance cost (90) (126) (32) (2) (9) (1) (0.2) Exchange (loss) gain, net (95) 66 449 30 336 23 8.5 Income tax expense (3) (18) (39) (3) (57) (4) (1.4) Net income 203 265 605 41 703 48 17.8 Net margin (%) 1.7 2.0 4.3 4.3 17.8 17.8 Net income excluding special items (3) 203 379 605 41 703 48 17.8 Adjusted EBITDAR 2,475 2,806 3,081 209 1,239 84 31.3 Adj. EBITDAR margin (%) 21.2 21.6 22.0 22.0 31.3 31.3 EPS Basic and Diluted 0.29 0.31 0.60 0.04 0.69 0.05 EPADS Basic and Diluted 2.94 3.10 5.98 0.41 6.95 0.47 Consolidated statements of operations summary Notes: (1) Figures converted to USD December end of the period spot exchange rate $14.7180, for convenience purposes only (2) Audited financial information 2012A – 2013A (3) Excludes debt prepayment of Ps.65 million, and reservation system migration costs and other non-recurring items of Ps.48 million. Source: Company data 22
  • 23.
    Consolidated statements offinancial position summary Nota: (1) Figures converted to USD December end of the period spot exchange rate $14.7180, for convenience purposes only (2) Net debt = financial debt - cash and cash equivalents (3) Adjusted debt = (LTM aircraft rent expense x 7) + financial debt (4) Adjusted net debt = adjusted debt - cash and cash equivalents (5) Audited financial information 2012A – 2013A Source: Company data MXN millions unless otherwise stated (5) 2012A 2013A 2014A 2014A (1) (USD millions) Cash and cash equivalents 822 2,451 2,265 154 Current guarantee deposits 238 499 545 37 Other current assets 755 1,050 879 60 Total current assets 1,815 4,000 3,689 251 Rotable spare parts, furniture and equipment, net 1,195 1,341 2,223 151 Non-current guarantee deposits 2,245 2,603 3,541 241 Other non-current assets 447 434 452 31 Total assets 5,702 8,378 9,905 673 Unearned transportation revenue 1,259 1,393 1,421 97 Short-term financial debt 527 268 823 56 Other short-term liabilities 1,936 2,211 2,524 172 Total short-term liabilities 3,722 3,872 4,768 324 Long-term financial debt 633 294 425 29 Other long-term liabilities 272 250 242 16 Total liabilities 4,627 4,416 5,435 369 Total equity 1,075 3,962 4,470 304 Total liabilities and equity 5,702 8,378 9,905 673 Net debt (2) 338 (1,889) (1,017) (69) Adjusted debt (3) 14,360 15,874 18,990 1,290 Adjusted net debt (4) 13,538 13,423 16,725 1,136 23
  • 24.
    Consolidated statements ofcash flows summary Notes: (1) Figures converted to USD December end of the period spot exchange rate $14.7180, for convenience purposes only (2) Audited financial information 2012A - 2013A Source: Company data MXN millions unless otherwise stated (2) 2012A 2013A 4Q 2014A 4Q 2014A (1)2014A 2014A (1) (USD millions) (USD millions) Cash flow from operating activities Income before income tax 207 283 644 44 760 52 Depreciation and amortization 211 302 343 23 138 9 Guarantee deposits (311) (620) (695) (47) (265) (18) Unearned transportation revenue 433 135 27 2 (74) (5) Changes in working capital and provisions (43) (61) 14 1 (90) (6) Net cash flows provided by operating activities 497 39 334 23 470 32 Cash flow from investing activities Acquisitions of rotable spare parts, furniture, equipment and intangible assets (856) (1,161) (1,603) (109) (513) (35) Proceeds from disposals of rotable spare parts, furniture and equipment 1,043 849 418 28 141 10 Net cash flows provided by (used in) investing activities 187 (312) (1,185) (81) (372) (25) Cash flow from financing activities Payments of Treasury Shares - - (7) - (7) - Net proceeds from initial public offering - 2,578 - - - - Transaction costs on issue of shares - (38) - - - - Proceeds from exercised treasury shares - 26 - - - - Interest paid (127) (65) (23) (2) (7) - Other financing costs - - (11) (1) (4) - Payments of financial debt (694) (1,084) (400) (27) (132) (9) Proceeds from financial debt 550 444 966 66 395 27 Net cash flows (used in) provided by financing activities (272) 1,861 525 36 245 17 Increase (decrease) in cash and cash equivalents 412 1,588 (326) (22) 342 23 Net foreign exchange differences (31) 41 141 10 108 7 Cash and cash equivalents at beginning of period 441 822 2,451 167 1,814 123 Cash and cash equivalents at end of period 822 2,451 2,265 154 2,265 154 24
  • 25.
    Adj. EBITDA andAdj. EBITDAR reconciliation Notes: (1) Figures converted to USD December end of the period spot exchange rate $14.7180, for convenience purposes only (2) Audited financial information 2012A - 2013A Source: Company data MXN millions unless otherwise stated (2) 2012A 2013A 2014A 2014A (1) 4Q 2014A 4Q 2014A (1) (USD millions) (USD millions) Net income 203 265 605 41 703 48 Plus (minus): Finance costs 90 126 32 2 9 1 Finance income (14) (25) (23) (2) (6) - (Benefit)/provision for income taxes 3 18 39 3 57 4 Depreciation and amortization 211 302 343 23 138 9 Business alliance amortization - - - - - - EBITDA 494 685 996 68 900 61 Exchange (gain) loss, net 95 (66) (449) (30) (336) (23) Other financing cost (income), net - - - - - - Adjusted EBITDA 589 619 547 37 564 38 Aircraft and engine rent expense 1,886 2,187 2,535 172 675 46 Adjusted EBITDAR 2,475 2,806 3,081 209 1,239 84 25