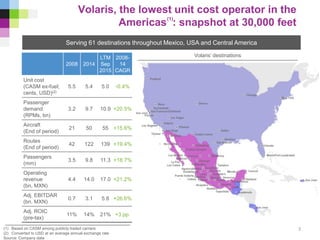
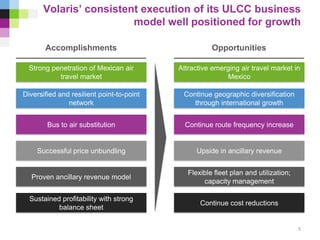
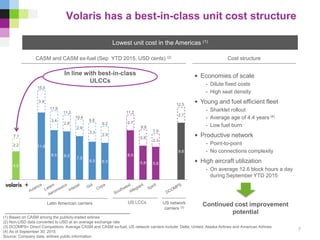
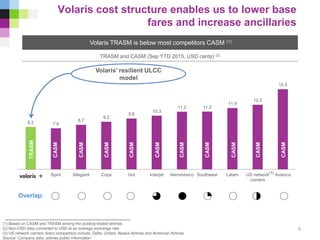
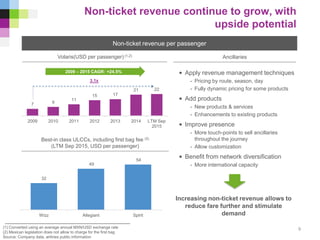
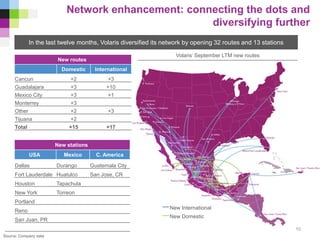
SlideShare a Scribd company logo
Volaris: the leading ultra-low-cost airline
serving Mexico, USA and Central America
December 2015
The information ("Confidential Information") contained in this presentation is confidential and is provided by
Controladora Vuela Compañía de Aviación, S.A.B. de C.V., (d/b/a Volaris, the "Company") confidentially to you solely
for your reference and may not be retransmitted or distributed to any other persons for any purpose whatsoever.
The Confidential Information is subject to change without notice, its accuracy is not guaranteed, it has not been
independently verified and it may not contain all material information concerning the Company. Neither the Company,
nor any of their respective directors makes any representation or warranty (express or implied) regarding, or
assumes any responsibility or liability for, the accuracy or completeness of, or any errors or omissions in, any
information or opinions contained herein. None of the Company nor any of their respective directors, officers,
employees, stockholders or affiliates nor any other person accepts any liability (in negligence, or otherwise)
whatsoever for any loss howsoever arising from any use of this presentation or its contents or otherwise arising in
connection therewith. No reliance may be placed for any purposes whatsoever on the information set forth in this
presentation or on its completeness.
This presentation does not constitute or form part of any offer or invitation for sale or subscription of or solicitation or
invitation of any offer to buy or subscribe for any securities, nor shall it or any part of it form the basis of or be relied
on in connection with any contract or commitment whatsoever. Recipients of this presentation are not to construe the
contents of this presentation as legal, tax or investment advice and should consult their own advisers in this regard.
This presentation contains statements that constitute forward-looking statements which involve risks and
uncertainties. These statements include descriptions regarding the intent, belief or current expectations of the
Company or its officers with respect to the consolidated results of operations and financial condition, and future
events and plans of the Company. These statements can be recognized by the use of words such as "expects,"
"plans," "will," "estimates," "projects," or words of similar meaning. Such forward-looking statements are not
guarantees of future performance and actual results may differ significantly from those in the forward-looking
statements as a result of various factors and assumptions. You are cautioned not to place undue reliance on these
forward looking statements, which are based on the current view of the management of the Company on future
events. The Company does not undertake to revise forward-looking statements to reflect future events or
circumstances.
Disclaimer
2
Volaris, the lowest unit cost operator in the
Americas : snapshot at 30,000 feet
Serving 61 destinations throughout Mexico, USA and Central America
Volaris’ destinations
(1) Based on CASM among publicly traded carriers
(2) Converted to USD at an average annual exchange rate
Source: Company data
2008 2014
LTM
Sep
2015
2008-
14
CAGR
Unit cost
(CASM ex-fuel;
cents, USD)(2)
5.5 5.4 5.0 -0.4%
Passenger
demand
(RPMs, bn)
3.2 9.7 10.9 +20.5%
Aircraft
(End of period)
21 50 55 +15.6%
Routes
(End of period)
42 122 139 +19.4%
Passengers
(mm)
3.5 9.8 11.3 +18.7%
Operating
revenue
(bn, MXN)
4.4 14.0 17.0 +21.2%
Adj. EBITDAR
(bn. MXN)
0.7 3.1 5.8 +26.6%
Adj. ROIC
(pre-tax)
11% 14% 21% +3 pp.
(1)
3
Volaris’ flight path for demand stimulation and
continued growth
Capacity
increase
Cost
reduction
“Clean”,
low
base
fares
More
customers
More
ancillaries
(“You decide”)
Resilient ULCC
business model
driving high,
profitable growth
4
Volaris’ consistent execution of its ULCC business
model well positioned for growth
Diversified and resilient point-to-point
network
Successful price unbundling
Strong penetration of Mexican air
travel market
Proven ancillary revenue model
Bus to air substitution
Upside in ancillary revenue
Continue geographic diversification
through international growth
Attractive emerging air travel market in
Mexico
Flexible fleet plan and utilization;
capacity management
Sustained profitability with strong
balance sheet
Continue cost reductions
Continue route frequency increase
OpportunitiesAccomplishments
5
Accomplishments
4.9
11.6
8.5 8.3
7.5
6.5 6.3
8.5
5.8 5.6
9.8
2.2
3.9
3.4
2.8
2.9
3.3
2.9
2.7
2.8
2.3
2.7
• Economies of scale
- Dilute fixed costs
- High seat density
• Young and fuel efficient fleet
- Sharklet rollout
- Average age of 4.4 years (4)
- Low fuel burn
• Productive network
- Point-to-point
- No connections complexity
• High aircraft utilization
- On average 12.6 block hours a day
during September YTD 2015
Volaris has a best-in-class unit cost structure
Lowest unit cost in the Americas (1)
CASM and CASM ex-fuel (Sep YTD 2015, USD cents) (2)
(1) Based on CASM among the publicly-traded airlines
(2) Non-USD data converted to USD at an average exchange rate
(3) DCOMPS= Direct Competitors: Average CASM and CASM ex-fuel; US network carriers include: Delta, United, Alaska Airlines and American Airlines
(4) As of September 30, 2015
Source: Company data, airlines public information
In line with best-in-class
ULCCs
Latin American carriers US LCCs US network
carriers (3)
7.1
15.5
11.9
11.2
10.4
9.8
9.2
11.2
8.6
7.9
12.5
Continued cost improvement
potential
Cost structure
7
8.2 7.9
8.7
9.2
9.8
10.3
11.2 11.2
11.9
12.5
15.5
. Spirit Allegiant Copa Gol Interjet Aeromexico Southwest Latam US network
carriers
Avianca
Volaris cost structure enables us to lower base
fares and increase ancillaries
Volaris TRASM is below most competitors CASM (1)
TRASM and CASM (Sep YTD 2015, USD cents) (2)
(1) Based on CASM and TRASM among the publicly-traded airlines
(2) Non-USD data converted to USD at an average exchange rate
(3) US network carriers direct competitors include: Delta, United, Alaska Airlines and American Airlines
Source: Company data, airlines public information
Overlap:
Volaris’ resilient ULCC
model
8
2
5
%
TRASM
CASM
CASM
CASM
CASM
CASM
CASM
CASM
CASM
CASM
CASM
(3)
7 9
11
15 17
21 22
2009 2010 2011 2012 2013 2014 LTM Sep
2015
Non-ticket revenue continue to grow, with
upside potential
(1) Converted using an average annual MXN/USD exchange rate
(2) Mexican legislation does not allow to charge for the first bag
Source: Company data, airlines public information
Non-ticket revenue per passenger
Volaris(USD per passenger) (1,2)
Best-in class ULCCs, including first bag fee (2)
(LTM Sep 2015, USD per passenger)
2009 – 2015 CAGR: +24.5%
3.1x
Ancillaries
• Apply revenue management techniques
- Pricing by route, season, day
- Fully dynamic pricing for some products
• Add products
- New products & services
- Enhancements to existing products
• Improve presence
- More touch-points to sell ancillaries
throughout the journey
- Allow customization
• Benefit from network diversification
- More international capacity
Increasing non-ticket revenue allows to
reduce fare further and stimulate
demand
32
49
54
Wizz Allegiant Spirit
9
Network enhancement: connecting the dots and
diversifying further
Source: Company data
New routes
Domestic International
Cancun +2 +3
Guadalajara +3 +10
Mexico City +3 +1
Monterrey +3
Other +2 +3
Tijuana +2
Total +15 +17
New stations
USA Mexico C. America
Dallas Durango Guatemala City
Fort Lauderdale Huatulco San Jose, CR
Houston Tapachula
New York Torreon
Portland
Reno
San Juan, PR
In the last twelve months, Volaris diversified its network by opening 32 routes and 13 stations
Volaris’ September LTM new routes
New International
New Domestic
10
…supporting strong capacity growth
New countries
Joining existing airports
Additional frequencies
New airports
7.8%
3.9%
4.6%
0.3%
Total ASM growth
September YTD capacity growth contribution (yoy)
16.6%
Our network is well positioned for diversified growth
=
+
+
+
+
11
Source: Company data
Growth opportunities
24
36
18
258
12
2010 2011 2012 2013 2014 LTM Sep 2015
Domestic USA Other international
Yoy growth 3.3% 4.0% 8.3% 8.3% 8.3% 10.6%(1)
GDP growth 5.1% 4.0% 3.8% 1.7% 2.1% 1.8%(2)
GDP multiplier 0.6 1.0 2.2 5.0 3.9 5.9
In recent years, volume growth has been robust
despite challenging economic environment
Note
(1) LTM September 2015 vs. LTM September LTM 2014
(2) Banco de México GDP 2015 estimate
Source: DGAC-SCT; INEGI; Banco de México
Mexico passenger market volume has increased since 2010
50 52
57
61
67
72
Passenger volume (millions)
CAGR:
6.4%
13
3.3%
7.2%
10.0%
0%
2%
4%
6%
8%
10%
12%
GDP Passengers RPMs
…and supply has met the strong market demand
DemandSupply (WB + NB + RJ) (1)
2.2x GDP
2.5%
5.1%
7.1%
0%
2%
4%
6%
8%
10%
12%
Aircraft Fleet seats ASMs
2010-2014 Capacity growth (CAGR) 2010-2014 Demand growth (CAGR)
(1) WB= wide body, NB= narrow body and RJ= regional jet
(2) Only domestic market
Source: DGAC, Diio Mi, Banco de México
(2) (2)
14
(1) Minimum stage length of 170 miles
(2) Minimum stage length of 200 miles; CAM stands for Central America; SAM stands for South America
(3) South and northbound leisure routes
(4) Figures calculated as of September 2015
(5) Data from ALTA Yearbook 2014
Source: Company data, SCT-DGAC and DIIO MI Market Intelligence for the Aviation Industry; ALTA
0
10
20
30
40
50
0
25
50
75
100
USA (Leisure) USA (VFR) CAM, SAM,
Canada,
Caribbean
Significant untapped opportunities
Domestic – growth potential of approx. 120
routes (4)
International – growth potential of approx.130
routes (4)
(3)
Number of routes (1)
Number of routes (2)
Routes served Growth potential
15
In terms of air trips per capita Mexico has plenty potential to grow
2014 air trips per capita(5)
2.05
0.55 0.45 0.42
0.27 0.25 0.21
0.04 0.01
USA Chile Brazil Colombia Peru Mexico Argentina Costa Rica Paraguay
ULCC model
First sell
Trial
Ticket giveaway
#Nomáscamión
Strong conversion
rate
2014
Domestic International
2014
Executive & luxury
First, economy and
other
Volaris contributed by stimulating demand from
bus to air substitution
Source: Company data, Secretaría de Comunicaciones y Transportes (SCT), Dec. 2014
Bus switching programSignificant upside for air travel
Total air travel trips in
Mexico (mm)
Total bus trips in
Mexico (mm)
2,837
2,706
77
34
33
67
Mass media campaigns
Digital capabilities
Attracting 1st
time flyers
16
Education
Drivers of continued profitable growth
Uniquely positioned to capture growth in underpenetrated Mexican aviation market
Reduce
unit costs
Fleet
growth
Expand
network
Increase
total
revenues
• Deepen footprint in
markets with high
demand stimulation
• Grow ancillary revenue to
world class ULCC
benchmarks
• 60 additional aircraft to be
delivered
• Up-gauge fleet from
A319 to A320/A321
• Higher seat density
configuration
• Expand network
geographically
Source: Company data
• Neo incorporation
- Fuel efficiency
17
• Price, product,
presence
Fleet and financials
18 18 15 12
17 16
13
13
15 20 28
28
0 0
2 80 2
10 10
0
0
0 2
FY14 FY15 FY16 FY17
A319 A320 A320 w/sharklets A320 NEO w/sharklets A321 w/sharklets A321 NEO w/sharklets
Fleet plan with flexibility that enables capacity
management
Projected fleet under current contracts (number of aircraft) (1)
(1) Net fleet after additions and returns
(2) Figure calculated as of November 2015
(3) Percentage of year-end fleet with sharklets
Source: Company data
Backlog of 63 Aircraft to support growth (2)
Seat growth
% fleet w/Sharklets (3)
18%
39%
18%
59%
19%
66%
56
68
73
50
2016-2018 PDPs
fully financedFirst two A320neo
First two A321ceo
19
34%
25%
23% 23%
19%
18%
14%
0%
10%
20%
30%
40%
Copa Aeromexico Interjet Latam Avianca Gol
Revenue CAGR 2009 - 2014 LTM Sep. 2015 Adj. EBITDAR margin
High growth and solid financial performance
(1) Converted using an average MXN/USD exchange rate for the corresponding period
Source: Company data, airlines public information
Revenue (1) Adj. EBITDAR (1)
374
536
714
887
1,018 1,056
1,127
0
400
800
1,200
2009 2010 2011 2012 2013 2014 LTM
Sep '15
(USDmm)
116
140
100
188
220 232
387
0
150
300
450
2009 2010 2011 2012 2013 2014 LTM
Sep '15
(USDmm)
23%
17% 16%
14%
7% 6% 6%
0%
10%
20%
30%
Copa Interjet Aeromexico Gol Latam Avianca
20
Strong continued performance during Sep YTD 2015
(1) Converted using an MXN/USD exchange rate of Ps.17.0073
(2) Converted using an MXN/USD exchange rate of Ps.13.4541
Source: Company data
Sep YTD 2015 Sep YTD 2014 Yoy growth
Unit cost
(CASM ex-fuel; cents, USD)
4.4(1) 5.2(2) -15.4%
Passenger demand
(RPMs, bn)
8.4 7.2 +21.4%
Aircraft
(End of period)
55 48 +14.6%
Passengers (mm) 8.7 7.2 +21.4%
Operating revenue
(mm, MXN)
13,087 10,078 +29.9%
Adj. EBITDAR
(mm. MXN)
4,606 1,842 >100%
LTM Adj. ROIC (pre-tax) 21% 11% +10 pp.
21
25.9%
31.2%
27.4%
19.6%
14.2% 13.9%
10.2%
Strong balance sheet and liquidity, well funded
for continued growth
• Positive cash flow from operating
activities in the last four quarters.
• Fully financed pre-delivery payments
through 2018 and executed sale-
leasebacks for 2016 deliveries.
• Unrestricted cash of $4.4 billion pesos
(US$ 259 million(2)) as of September 30th
2015.
• Net cash position of $3.0 billion pesos
(US$ 173 million(2)) as of September 30th
2015.
• Adjusted long term net debt to EBITDAR
of 3.3x as of September 2015 LTM.
(1) Includes capital increase of Delta and the issuance of a long term third party loan for. The figure also includes IPO Smiles program proceeds.
(2) Figures converted to USD at September end of the period spot exchange rate $17.0073 for convenience purposes only
Source: Company data, airlines public information
LTM liquidity-cash and equivalents as a % of LTM Op. Revenue
22
Appendix
Fuel hedging position
Period Total % hedged Avg. price (gal/USD$) Instrument
4Q15 50% $2.07 Call
1Q16 60% $1.94 Call
2Q16 60% $1.95 Call
3Q16 60% $1.99 Call
4Q16 60% $1.99 Call
1Q17 45% $1.75 Call
2Q17 40% $1.73 Call
3Q17 15% $1.65 Call
24
(1) Full year 2014 and September YTD 2015 figures converted to USD at December end of the period spot exchange rate $14.7180 and $17.0073, respectively, for convenience
purposes only
(2) Audited financial information 2012A – 2014A
(3) Includes debt prepayment of Ps.65 million
Source: Company data
Consolidated statements of operations summary
MXN millions unless otherwise stated (2) 2012A 2013A 2014A 2014A (1)
September
YTD 2015
September
YTD 2015(1)
% of total
operating
revenues
(USD
millions)
(USD
millions)
Passenger 10,177 11,117 11,303 768 10,201 600 77.9
Non-ticket 1,510 1,885 2,733 186 2,887 170 22.1
Total operating revenues 11,686 13,002 14,037 954 13,087 770 100
Fuel 4,730 5,086 5,364 364 3,563 209 27.2
Aircraft and engines rent expense 1,886 2,187 2,535 172 2,483 146 19.0
Landing, take off and navigation expenses 1,640 1,924 2,066 140 1,884 111 14.4
Salaries and benefits 1,303 1,563 1,577 107 1,364 80 10.4
Sales, marketing and distribution expenses 752 704 817 56 750 44 5.7
Maintenance expenses 499 572 665 45 587 35 4.5
Other operating expense, net 288 347 468 32 333 20 2.5
Depreciation and amortization 211 302 343 23 349 21 2.7
Total operating expenses 11,308 12,685 13,833 940 11,312 665 86.46
EBIT 378 317 204 14 1,775 104 13.6
Operating margin (%) 3.2 2.4 1.5 1.5 13.6 13.6
Finance income 14 25 23 2 37 2 0.3
Finance cost (90) (126) (32) (2) (15) (1) (0.1)
Exchange (loss) gain, net (95) 66 449 30 789 46 6.0
Income tax expense (3) (18) (39) (3) (776) (46) (5.9)
Net income 203 265 (3) 605 41 1,810 106 13.8
Net margin (%) 1.7 2.0 4.3 4.3 13.8 13.8
Adjusted EBITDAR 2,475 2,806 3,081 209 4,606 271 35.2
Adj. EBITDAR margin (%) 21.2 21.6 22.0 22.0 35.2 35.2
EPS Basic and Diluted (Pesos) 0.29 0.31 0.60 0.04 1.79 0.11
EPADS Basic and Diluted (Pesos) 2.94 3.10 6.00 0.40 17.89 1.05
25
Consolidated statements of financial position
summary
(1) Full year 2014 and September 2015 figures converted to USD at December end of the period spot exchange rate $14.7180 and $17.0073, respectively, for convenience purposes
only
(2) Net debt = financial debt - cash and cash equivalents
(3) Adjusted debt = (LTM aircraft rent expense x 7) + financial debt
(4) Adjusted net debt = adjusted debt - cash and cash equivalents
(5) Audited financial information 2012A – 2014A
Source: Company data
MXN millions unless otherwise stated (5) 2012A 2013A 2014A 2014A (1)
As of
September
30, 2015
As of
September
30, 2015(1)
(USD
millions)
(USD
millions)
Cash and cash equivalents 822 2,451 2,265 154 4,408 259
Current guarantee deposits 238 499 545 37 680 40
Other current assets 755 1,050 879 60 833 49
Total current assets 1,815 4,000 3,689 251 5,921 348
Rotable spare parts, furniture and equipment,
net
1,195 1,341 2,223 151 2,273 134
Non-current guarantee deposits 2,245 2,603 3,541 241 4,680 275
Other non-current assets 447 434 452 31 869 51
Total assets 5,702 8,378 9,905 673 13,743 808
Unearned transportation revenue 1,259 1,393 1,421 97 1,898 112
Short-term financial debt 527 268 823 56 1,145 67
Other short-term liabilities 1,936 2,211 2,524 172 3,745 220
Total short-term liabilities 3,722 3,872 4,768 324 6,789 399
Long-term financial debt 633 294 425 29 309 18
Other long-term liabilities 272 250 242 16 449 26
Total liabilities 4,627 4,415 5,435 369 7,546 444
Total equity 1,075 3,962 4,470 304 6,196 364
Total liabilities and equity 5,702 8,378 9,905 673 13,743 808
Net debt (2) 338 (1,888) (1,017) (69) (2,954) (174)
Adjusted debt (3) 14,360 15,874 18,990 1,290 23,558 1,385
Adjusted net debt (4) 13,538 13,423 16,725 1,136 19,150 1,126
26
Consolidated statements of cash flows summary
(1) Full year 2014 and September YTD 2015 figures converted to USD at December end of the period spot exchange rate $14.7180 and $17.0073, respectively,
for convenience purposes only
(2) Audited financial information 2012A - 2014A.
(3) Includes debt prepayment premium
Source: Company data
MXN millions unless otherwise stated (2) 2012A 2013A
September
YTD 2015
September
YTD 2015 (1)2014A 2014A (1)
(USD
millions)
(USD
millions)
Cash flow from operating activities
Income before income tax 207 283 644 44 2,586 152
Depreciation and amortization 211 302 343 23 349 21
Guarantee deposits (311) (620) (695) (47) (1,086) (64)
Unearned transportation revenue 433 135 27 2 478 28
Changes in working capital and provisions (43) (61) 14 1 (186) (11)
Net cash flows provided by operating activities 497 39 334 23 2,140 126
Cash flow from investing activities
Acquisitions of rotable spare parts, furniture, equipment and
intangible assets (856) (1,161) (1,603) (109) (912) (54)
Pre-delivery payments reimbursements 875 698 396 27 533 31
Proceeds from disposals of rotable spare parts, furniture and
equipment 169 151 22 1 134 9
Net cash flows provided by (used in) investing activities 187 (312) (1,185) (81) (245) (14)
Cash flow from financing activities
Payments of Treasury Shares - - (7) - - -
Net proceeds from initial public offering - 2,578 - - - -
Transaction costs on issue of shares - (38) - - - -
Proceeds from exercised treasury shares - 26 - - - -
Interest paid (119) (65) (23) (2) (30) (2)
Other finance costs (8) - (11) (1) (40) (2)
Payments of financial debt (694) (1,084) (3) (400) (27) (631) (37)
Proceeds from financial debt 550 444 966 66 640 38
Net cash flows (used in) provided by financing activities (272) 1,861 525 36 ( 61) (4)
Increase (decrease) in cash and cash equivalents 413 1,587 (326) (22) 1,833 108
Net foreign exchange differences (32) 41 141 10 309 18
Cash and cash equivalents at beginning of period 441 822 2,451 167 2,265 133
Cash and cash equivalents at end of period 822 2,451 2,265 154 4,408 259
27
Adj. EBITDA and Adj. EBITDAR reconciliation
(1) Full year 2014 and September YTD 2015 figures converted to USD at December end of the period spot exchange rate $14.7180 and $17.0073, respectively, for convenience
purposes only
(2) Audited financial information 2012A - 2014A
Source: Company data
MXN millions unless otherwise stated (2) 2012A 2013A 2014A 2014A (1)
September
YTD 2015
September
YTD 2015 (1)
(USD
millions)
(USD
millions)
Net income 203 265 605 41 1,810 106
Plus (minus):
Finance costs 90 126 32 2 15 1
Finance income (14) (25) (23) (2) (37) (2)
(Benefit)/provision for income taxes 3 18 39 3 776 46
Depreciation and amortization 211 302 343 23 349 21
EBITDA 494 685 995 68 2,912 171
Exchange (gain) loss, net 95 (66) (449) (30) (789) (46)
Adjusted EBITDA 589 619 547 37 2,124 125
Aircraft and engine rent expense 1,886 2,187 2,535 172 2,483 146
Adjusted EBITDAR 2,475 2,806 3,081 209 4,606 271
28

More Related Content

What's hot

Aeromexico overview presentation_august_2014
Aeromexico overview presentation_august_2014Aeromexico overview presentation_august_2014
Aeromexico overview presentation_august_2014Aeromexico_IR
 
Volaris corporate presentation 4 q17
Volaris corporate presentation 4 q17Volaris corporate presentation 4 q17
Volaris corporate presentation 4 q17
irvolaris
 
Volaris corp presentation march 2018
Volaris corp presentation march 2018Volaris corp presentation march 2018
Volaris corp presentation march 2018
irvolaris
 
Corp prez may 2018 ii
Corp prez may 2018 iiCorp prez may 2018 ii
Corp prez may 2018 ii
irvolaris
 
Corp prez may 2018 ii
Corp prez may 2018 iiCorp prez may 2018 ii
Corp prez may 2018 ii
irvolaris
 
Corp pres june 2018
Corp pres june 2018Corp pres june 2018
Corp pres june 2018
irvolaris
 
Corp pres july 2018 v1
Corp pres july 2018 v1Corp pres july 2018 v1
Corp pres july 2018 v1
irvolaris
 
Corp pres june 2018
Corp pres june 2018Corp pres june 2018
Corp pres june 2018
irvolaris
 
Corp pres july 2018 v1
Corp pres july 2018 v1Corp pres july 2018 v1
Corp pres july 2018 v1
irvolaris
 
Volaris corp presentation may 2018 ii
Volaris corp presentation may 2018 iiVolaris corp presentation may 2018 ii
Volaris corp presentation may 2018 ii
irvolaris
 
Volaris corp presentation may 2018
Volaris corp presentation may 2018Volaris corp presentation may 2018
Volaris corp presentation may 2018
irvolaris
 
Volaris corp presentation may 2018
Volaris corp presentation may 2018Volaris corp presentation may 2018
Volaris corp presentation may 2018
irvolaris
 
Corp prez may 2018 ii
Corp prez may 2018 iiCorp prez may 2018 ii
Corp prez may 2018 ii
irvolaris
 
Volaris corp presentation may 2018
Volaris corp presentation may 2018Volaris corp presentation may 2018
Volaris corp presentation may 2018
irvolaris
 
Volaris corporate presentation january 2018 2
Volaris corporate presentation january 2018 2Volaris corporate presentation january 2018 2
Volaris corporate presentation january 2018 2
irvolaris
 
Volaris corporate presentation baml transportation conference
Volaris corporate presentation   baml transportation conferenceVolaris corporate presentation   baml transportation conference
Volaris corporate presentation baml transportation conferenceirvolaris
 
Volaris corporate presentation september 2017
Volaris corporate presentation september 2017Volaris corporate presentation september 2017
Volaris corporate presentation september 2017
irvolaris
 
Volaris corporate presentation - deutsche bank ge ms conference
Volaris corporate presentation -  deutsche bank ge ms conferenceVolaris corporate presentation -  deutsche bank ge ms conference
Volaris corporate presentation - deutsche bank ge ms conference
irvolaris
 
Volaris corporate presentation - cowen transportation conference
Volaris corporate presentation -  cowen transportation conferenceVolaris corporate presentation -  cowen transportation conference
Volaris corporate presentation - cowen transportation conference
irvolaris
 
Volaris corporate presentation - december 2014
Volaris corporate presentation - december 2014Volaris corporate presentation - december 2014
Volaris corporate presentation - december 2014
irvolaris
 

What's hot (20)

Aeromexico overview presentation_august_2014
Aeromexico overview presentation_august_2014Aeromexico overview presentation_august_2014
Aeromexico overview presentation_august_2014
 
Volaris corporate presentation 4 q17
Volaris corporate presentation 4 q17Volaris corporate presentation 4 q17
Volaris corporate presentation 4 q17
 
Volaris corp presentation march 2018
Volaris corp presentation march 2018Volaris corp presentation march 2018
Volaris corp presentation march 2018
 
Corp prez may 2018 ii
Corp prez may 2018 iiCorp prez may 2018 ii
Corp prez may 2018 ii
 
Corp prez may 2018 ii
Corp prez may 2018 iiCorp prez may 2018 ii
Corp prez may 2018 ii
 
Corp pres june 2018
Corp pres june 2018Corp pres june 2018
Corp pres june 2018
 
Corp pres july 2018 v1
Corp pres july 2018 v1Corp pres july 2018 v1
Corp pres july 2018 v1
 
Corp pres june 2018
Corp pres june 2018Corp pres june 2018
Corp pres june 2018
 
Corp pres july 2018 v1
Corp pres july 2018 v1Corp pres july 2018 v1
Corp pres july 2018 v1
 
Volaris corp presentation may 2018 ii
Volaris corp presentation may 2018 iiVolaris corp presentation may 2018 ii
Volaris corp presentation may 2018 ii
 
Volaris corp presentation may 2018
Volaris corp presentation may 2018Volaris corp presentation may 2018
Volaris corp presentation may 2018
 
Volaris corp presentation may 2018
Volaris corp presentation may 2018Volaris corp presentation may 2018
Volaris corp presentation may 2018
 
Corp prez may 2018 ii
Corp prez may 2018 iiCorp prez may 2018 ii
Corp prez may 2018 ii
 
Volaris corp presentation may 2018
Volaris corp presentation may 2018Volaris corp presentation may 2018
Volaris corp presentation may 2018
 
Volaris corporate presentation january 2018 2
Volaris corporate presentation january 2018 2Volaris corporate presentation january 2018 2
Volaris corporate presentation january 2018 2
 
Volaris corporate presentation baml transportation conference
Volaris corporate presentation   baml transportation conferenceVolaris corporate presentation   baml transportation conference
Volaris corporate presentation baml transportation conference
 
Volaris corporate presentation september 2017
Volaris corporate presentation september 2017Volaris corporate presentation september 2017
Volaris corporate presentation september 2017
 
Volaris corporate presentation - deutsche bank ge ms conference
Volaris corporate presentation -  deutsche bank ge ms conferenceVolaris corporate presentation -  deutsche bank ge ms conference
Volaris corporate presentation - deutsche bank ge ms conference
 
Volaris corporate presentation - cowen transportation conference
Volaris corporate presentation -  cowen transportation conferenceVolaris corporate presentation -  cowen transportation conference
Volaris corporate presentation - cowen transportation conference
 
Volaris corporate presentation - december 2014
Volaris corporate presentation - december 2014Volaris corporate presentation - december 2014
Volaris corporate presentation - december 2014
 

Similar to Volaris corporate presentation december

Volaris corp presentation march 2018
Volaris corp presentation march 2018Volaris corp presentation march 2018
Volaris corp presentation march 2018
irvolaris
 
Citi’s 26th Annual Latin America Conference
Citi’s 26th Annual Latin America ConferenceCiti’s 26th Annual Latin America Conference
Citi’s 26th Annual Latin America Conference
irvolaris
 
Volaris corp presentation march 2018 (2)
Volaris corp presentation march 2018 (2)Volaris corp presentation march 2018 (2)
Volaris corp presentation march 2018 (2)
irvolaris
 
Volaris corp presentation march 2018 esp
Volaris corp presentation march 2018 espVolaris corp presentation march 2018 esp
Volaris corp presentation march 2018 esp
irvolaris
 
Volaris corporate presentation november 2017
Volaris corporate presentation november 2017Volaris corporate presentation november 2017
Volaris corporate presentation november 2017
irvolaris
 
Volaris corporate presentation november 2017
Volaris corporate presentation november 2017Volaris corporate presentation november 2017
Volaris corporate presentation november 2017
irvolaris
 
Volaris corporate presentation may 2017
Volaris corporate presentation may 2017Volaris corporate presentation may 2017
Volaris corporate presentation may 2017
irvolaris
 
Volaris corporate presentation january 2018
Volaris corporate presentation january 2018Volaris corporate presentation january 2018
Volaris corporate presentation january 2018
irvolaris
 
Volaris corporate presentation may 2015
Volaris corporate presentation may 2015Volaris corporate presentation may 2015
Volaris corporate presentation may 2015
irvolaris
 
Volaris corporate presentation - march
Volaris corporate presentation - marchVolaris corporate presentation - march
Volaris corporate presentation - marchirvolaris
 
Volaris corporate presentation - march
Volaris corporate presentation - marchVolaris corporate presentation - march
Volaris corporate presentation - marchirvolaris
 
141030 volaris corporate presentation - october 2014
141030 volaris corporate presentation - october 2014141030 volaris corporate presentation - october 2014
141030 volaris corporate presentation - october 2014
irvolaris
 
Volaris Corporate Presentation March 2015
Volaris Corporate Presentation March 2015Volaris Corporate Presentation March 2015
Volaris Corporate Presentation March 2015
irvolaris
 
Volaris Corporate Presentation December 2013
Volaris Corporate Presentation  December 2013Volaris Corporate Presentation  December 2013
Volaris Corporate Presentation December 2013irvolaris
 

Similar to Volaris corporate presentation december (14)

Volaris corp presentation march 2018
Volaris corp presentation march 2018Volaris corp presentation march 2018
Volaris corp presentation march 2018
 
Citi’s 26th Annual Latin America Conference
Citi’s 26th Annual Latin America ConferenceCiti’s 26th Annual Latin America Conference
Citi’s 26th Annual Latin America Conference
 
Volaris corp presentation march 2018 (2)
Volaris corp presentation march 2018 (2)Volaris corp presentation march 2018 (2)
Volaris corp presentation march 2018 (2)
 
Volaris corp presentation march 2018 esp
Volaris corp presentation march 2018 espVolaris corp presentation march 2018 esp
Volaris corp presentation march 2018 esp
 
Volaris corporate presentation november 2017
Volaris corporate presentation november 2017Volaris corporate presentation november 2017
Volaris corporate presentation november 2017
 
Volaris corporate presentation november 2017
Volaris corporate presentation november 2017Volaris corporate presentation november 2017
Volaris corporate presentation november 2017
 
Volaris corporate presentation may 2017
Volaris corporate presentation may 2017Volaris corporate presentation may 2017
Volaris corporate presentation may 2017
 
Volaris corporate presentation january 2018
Volaris corporate presentation january 2018Volaris corporate presentation january 2018
Volaris corporate presentation january 2018
 
Volaris corporate presentation may 2015
Volaris corporate presentation may 2015Volaris corporate presentation may 2015
Volaris corporate presentation may 2015
 
Volaris corporate presentation - march
Volaris corporate presentation - marchVolaris corporate presentation - march
Volaris corporate presentation - march
 
Volaris corporate presentation - march
Volaris corporate presentation - marchVolaris corporate presentation - march
Volaris corporate presentation - march
 
141030 volaris corporate presentation - october 2014
141030 volaris corporate presentation - october 2014141030 volaris corporate presentation - october 2014
141030 volaris corporate presentation - october 2014
 
Volaris Corporate Presentation March 2015
Volaris Corporate Presentation March 2015Volaris Corporate Presentation March 2015
Volaris Corporate Presentation March 2015
 
Volaris Corporate Presentation December 2013
Volaris Corporate Presentation  December 2013Volaris Corporate Presentation  December 2013
Volaris Corporate Presentation December 2013
 

Recently uploaded

chapter 10 - excise tax of transfer and business taxation
chapter 10 - excise tax of transfer and business taxationchapter 10 - excise tax of transfer and business taxation
chapter 10 - excise tax of transfer and business taxation
AUDIJEAngelo
 
一比一原版加拿大渥太华大学毕业证(uottawa毕业证书)如何办理
一比一原版加拿大渥太华大学毕业证(uottawa毕业证书)如何办理一比一原版加拿大渥太华大学毕业证(uottawa毕业证书)如何办理
一比一原版加拿大渥太华大学毕业证(uottawa毕业证书)如何办理
taqyed
 
anas about venice for grade 6f about venice
anas about venice for grade 6f about veniceanas about venice for grade 6f about venice
anas about venice for grade 6f about venice
anasabutalha2013
 
5 Things You Need To Know Before Hiring a Videographer
5 Things You Need To Know Before Hiring a Videographer5 Things You Need To Know Before Hiring a Videographer
5 Things You Need To Know Before Hiring a Videographer
ofm712785
 
Skye Residences | Extended Stay Residences Near Toronto Airport
Skye Residences | Extended Stay Residences Near Toronto AirportSkye Residences | Extended Stay Residences Near Toronto Airport
Skye Residences | Extended Stay Residences Near Toronto Airport
marketingjdass
 
20240425_ TJ Communications Credentials_compressed.pdf
20240425_ TJ Communications Credentials_compressed.pdf20240425_ TJ Communications Credentials_compressed.pdf
20240425_ TJ Communications Credentials_compressed.pdf
tjcomstrang
 
Brand Analysis for an artist named Struan
Brand Analysis for an artist named StruanBrand Analysis for an artist named Struan
Brand Analysis for an artist named Struan
sarahvanessa51503
 
Digital Transformation in PLM - WHAT and HOW - for distribution.pdf
Digital Transformation in PLM - WHAT and HOW - for distribution.pdfDigital Transformation in PLM - WHAT and HOW - for distribution.pdf
Digital Transformation in PLM - WHAT and HOW - for distribution.pdf
Jos Voskuil
 
Improving profitability for small business
Improving profitability for small businessImproving profitability for small business
Improving profitability for small business
Ben Wann
 
Set off and carry forward of losses and assessment of individuals.pptx
Set off and carry forward of losses and assessment of individuals.pptxSet off and carry forward of losses and assessment of individuals.pptx
Set off and carry forward of losses and assessment of individuals.pptx
HARSHITHV26
 
Putting the SPARK into Virtual Training.pptx
Putting the SPARK into Virtual Training.pptxPutting the SPARK into Virtual Training.pptx
Putting the SPARK into Virtual Training.pptx
Cynthia Clay
 
FINAL PRESENTATION.pptx12143241324134134
FINAL PRESENTATION.pptx12143241324134134FINAL PRESENTATION.pptx12143241324134134
FINAL PRESENTATION.pptx12143241324134134
LR1709MUSIC
 
The-McKinsey-7S-Framework. strategic management
The-McKinsey-7S-Framework. strategic managementThe-McKinsey-7S-Framework. strategic management
The-McKinsey-7S-Framework. strategic management
Bojamma2
 
PriyoShop Celebration Pohela Falgun Mar 20, 2024
PriyoShop Celebration Pohela Falgun Mar 20, 2024PriyoShop Celebration Pohela Falgun Mar 20, 2024
PriyoShop Celebration Pohela Falgun Mar 20, 2024
PriyoShop.com LTD
 
What is the TDS Return Filing Due Date for FY 2024-25.pdf
What is the TDS Return Filing Due Date for FY 2024-25.pdfWhat is the TDS Return Filing Due Date for FY 2024-25.pdf
What is the TDS Return Filing Due Date for FY 2024-25.pdf
seoforlegalpillers
 
Cree_Rey_BrandIdentityKit.PDF_PersonalBd
Cree_Rey_BrandIdentityKit.PDF_PersonalBdCree_Rey_BrandIdentityKit.PDF_PersonalBd
Cree_Rey_BrandIdentityKit.PDF_PersonalBd
creerey
 
India Orthopedic Devices Market: Unlocking Growth Secrets, Trends and Develop...
India Orthopedic Devices Market: Unlocking Growth Secrets, Trends and Develop...India Orthopedic Devices Market: Unlocking Growth Secrets, Trends and Develop...
India Orthopedic Devices Market: Unlocking Growth Secrets, Trends and Develop...
Kumar Satyam
 
Premium MEAN Stack Development Solutions for Modern Businesses
Premium MEAN Stack Development Solutions for Modern BusinessesPremium MEAN Stack Development Solutions for Modern Businesses
Premium MEAN Stack Development Solutions for Modern Businesses
SynapseIndia
 
falcon-invoice-discounting-a-premier-platform-for-investors-in-india
falcon-invoice-discounting-a-premier-platform-for-investors-in-indiafalcon-invoice-discounting-a-premier-platform-for-investors-in-india
falcon-invoice-discounting-a-premier-platform-for-investors-in-india
Falcon Invoice Discounting
 
Pitch Deck Teardown: RAW Dating App's $3M Angel deck
Pitch Deck Teardown: RAW Dating App's $3M Angel deckPitch Deck Teardown: RAW Dating App's $3M Angel deck
Pitch Deck Teardown: RAW Dating App's $3M Angel deck
HajeJanKamps
 

Recently uploaded (20)

chapter 10 - excise tax of transfer and business taxation
chapter 10 - excise tax of transfer and business taxationchapter 10 - excise tax of transfer and business taxation
chapter 10 - excise tax of transfer and business taxation
 
一比一原版加拿大渥太华大学毕业证(uottawa毕业证书)如何办理
一比一原版加拿大渥太华大学毕业证(uottawa毕业证书)如何办理一比一原版加拿大渥太华大学毕业证(uottawa毕业证书)如何办理
一比一原版加拿大渥太华大学毕业证(uottawa毕业证书)如何办理
 
anas about venice for grade 6f about venice
anas about venice for grade 6f about veniceanas about venice for grade 6f about venice
anas about venice for grade 6f about venice
 
5 Things You Need To Know Before Hiring a Videographer
5 Things You Need To Know Before Hiring a Videographer5 Things You Need To Know Before Hiring a Videographer
5 Things You Need To Know Before Hiring a Videographer
 
Skye Residences | Extended Stay Residences Near Toronto Airport
Skye Residences | Extended Stay Residences Near Toronto AirportSkye Residences | Extended Stay Residences Near Toronto Airport
Skye Residences | Extended Stay Residences Near Toronto Airport
 
20240425_ TJ Communications Credentials_compressed.pdf
20240425_ TJ Communications Credentials_compressed.pdf20240425_ TJ Communications Credentials_compressed.pdf
20240425_ TJ Communications Credentials_compressed.pdf
 
Brand Analysis for an artist named Struan
Brand Analysis for an artist named StruanBrand Analysis for an artist named Struan
Brand Analysis for an artist named Struan
 
Digital Transformation in PLM - WHAT and HOW - for distribution.pdf
Digital Transformation in PLM - WHAT and HOW - for distribution.pdfDigital Transformation in PLM - WHAT and HOW - for distribution.pdf
Digital Transformation in PLM - WHAT and HOW - for distribution.pdf
 
Improving profitability for small business
Improving profitability for small businessImproving profitability for small business
Improving profitability for small business
 
Set off and carry forward of losses and assessment of individuals.pptx
Set off and carry forward of losses and assessment of individuals.pptxSet off and carry forward of losses and assessment of individuals.pptx
Set off and carry forward of losses and assessment of individuals.pptx
 
Putting the SPARK into Virtual Training.pptx
Putting the SPARK into Virtual Training.pptxPutting the SPARK into Virtual Training.pptx
Putting the SPARK into Virtual Training.pptx
 
FINAL PRESENTATION.pptx12143241324134134
FINAL PRESENTATION.pptx12143241324134134FINAL PRESENTATION.pptx12143241324134134
FINAL PRESENTATION.pptx12143241324134134
 
The-McKinsey-7S-Framework. strategic management
The-McKinsey-7S-Framework. strategic managementThe-McKinsey-7S-Framework. strategic management
The-McKinsey-7S-Framework. strategic management
 
PriyoShop Celebration Pohela Falgun Mar 20, 2024
PriyoShop Celebration Pohela Falgun Mar 20, 2024PriyoShop Celebration Pohela Falgun Mar 20, 2024
PriyoShop Celebration Pohela Falgun Mar 20, 2024
 
What is the TDS Return Filing Due Date for FY 2024-25.pdf
What is the TDS Return Filing Due Date for FY 2024-25.pdfWhat is the TDS Return Filing Due Date for FY 2024-25.pdf
What is the TDS Return Filing Due Date for FY 2024-25.pdf
 
Cree_Rey_BrandIdentityKit.PDF_PersonalBd
Cree_Rey_BrandIdentityKit.PDF_PersonalBdCree_Rey_BrandIdentityKit.PDF_PersonalBd
Cree_Rey_BrandIdentityKit.PDF_PersonalBd
 
India Orthopedic Devices Market: Unlocking Growth Secrets, Trends and Develop...
India Orthopedic Devices Market: Unlocking Growth Secrets, Trends and Develop...India Orthopedic Devices Market: Unlocking Growth Secrets, Trends and Develop...
India Orthopedic Devices Market: Unlocking Growth Secrets, Trends and Develop...
 
Premium MEAN Stack Development Solutions for Modern Businesses
Premium MEAN Stack Development Solutions for Modern BusinessesPremium MEAN Stack Development Solutions for Modern Businesses
Premium MEAN Stack Development Solutions for Modern Businesses
 
falcon-invoice-discounting-a-premier-platform-for-investors-in-india
falcon-invoice-discounting-a-premier-platform-for-investors-in-indiafalcon-invoice-discounting-a-premier-platform-for-investors-in-india
falcon-invoice-discounting-a-premier-platform-for-investors-in-india
 
Pitch Deck Teardown: RAW Dating App's $3M Angel deck
Pitch Deck Teardown: RAW Dating App's $3M Angel deckPitch Deck Teardown: RAW Dating App's $3M Angel deck
Pitch Deck Teardown: RAW Dating App's $3M Angel deck
 

Volaris corporate presentation december

  • 1. Volaris: the leading ultra-low-cost airline serving Mexico, USA and Central America December 2015
  • 2. The information ("Confidential Information") contained in this presentation is confidential and is provided by Controladora Vuela Compañía de Aviación, S.A.B. de C.V., (d/b/a Volaris, the "Company") confidentially to you solely for your reference and may not be retransmitted or distributed to any other persons for any purpose whatsoever. The Confidential Information is subject to change without notice, its accuracy is not guaranteed, it has not been independently verified and it may not contain all material information concerning the Company. Neither the Company, nor any of their respective directors makes any representation or warranty (express or implied) regarding, or assumes any responsibility or liability for, the accuracy or completeness of, or any errors or omissions in, any information or opinions contained herein. None of the Company nor any of their respective directors, officers, employees, stockholders or affiliates nor any other person accepts any liability (in negligence, or otherwise) whatsoever for any loss howsoever arising from any use of this presentation or its contents or otherwise arising in connection therewith. No reliance may be placed for any purposes whatsoever on the information set forth in this presentation or on its completeness. This presentation does not constitute or form part of any offer or invitation for sale or subscription of or solicitation or invitation of any offer to buy or subscribe for any securities, nor shall it or any part of it form the basis of or be relied on in connection with any contract or commitment whatsoever. Recipients of this presentation are not to construe the contents of this presentation as legal, tax or investment advice and should consult their own advisers in this regard. This presentation contains statements that constitute forward-looking statements which involve risks and uncertainties. These statements include descriptions regarding the intent, belief or current expectations of the Company or its officers with respect to the consolidated results of operations and financial condition, and future events and plans of the Company. These statements can be recognized by the use of words such as "expects," "plans," "will," "estimates," "projects," or words of similar meaning. Such forward-looking statements are not guarantees of future performance and actual results may differ significantly from those in the forward-looking statements as a result of various factors and assumptions. You are cautioned not to place undue reliance on these forward looking statements, which are based on the current view of the management of the Company on future events. The Company does not undertake to revise forward-looking statements to reflect future events or circumstances. Disclaimer 2
  • 3. Volaris, the lowest unit cost operator in the Americas : snapshot at 30,000 feet Serving 61 destinations throughout Mexico, USA and Central America Volaris’ destinations (1) Based on CASM among publicly traded carriers (2) Converted to USD at an average annual exchange rate Source: Company data 2008 2014 LTM Sep 2015 2008- 14 CAGR Unit cost (CASM ex-fuel; cents, USD)(2) 5.5 5.4 5.0 -0.4% Passenger demand (RPMs, bn) 3.2 9.7 10.9 +20.5% Aircraft (End of period) 21 50 55 +15.6% Routes (End of period) 42 122 139 +19.4% Passengers (mm) 3.5 9.8 11.3 +18.7% Operating revenue (bn, MXN) 4.4 14.0 17.0 +21.2% Adj. EBITDAR (bn. MXN) 0.7 3.1 5.8 +26.6% Adj. ROIC (pre-tax) 11% 14% 21% +3 pp. (1) 3
  • 4. Volaris’ flight path for demand stimulation and continued growth Capacity increase Cost reduction “Clean”, low base fares More customers More ancillaries (“You decide”) Resilient ULCC business model driving high, profitable growth 4
  • 5. Volaris’ consistent execution of its ULCC business model well positioned for growth Diversified and resilient point-to-point network Successful price unbundling Strong penetration of Mexican air travel market Proven ancillary revenue model Bus to air substitution Upside in ancillary revenue Continue geographic diversification through international growth Attractive emerging air travel market in Mexico Flexible fleet plan and utilization; capacity management Sustained profitability with strong balance sheet Continue cost reductions Continue route frequency increase OpportunitiesAccomplishments 5
  • 7. 4.9 11.6 8.5 8.3 7.5 6.5 6.3 8.5 5.8 5.6 9.8 2.2 3.9 3.4 2.8 2.9 3.3 2.9 2.7 2.8 2.3 2.7 • Economies of scale - Dilute fixed costs - High seat density • Young and fuel efficient fleet - Sharklet rollout - Average age of 4.4 years (4) - Low fuel burn • Productive network - Point-to-point - No connections complexity • High aircraft utilization - On average 12.6 block hours a day during September YTD 2015 Volaris has a best-in-class unit cost structure Lowest unit cost in the Americas (1) CASM and CASM ex-fuel (Sep YTD 2015, USD cents) (2) (1) Based on CASM among the publicly-traded airlines (2) Non-USD data converted to USD at an average exchange rate (3) DCOMPS= Direct Competitors: Average CASM and CASM ex-fuel; US network carriers include: Delta, United, Alaska Airlines and American Airlines (4) As of September 30, 2015 Source: Company data, airlines public information In line with best-in-class ULCCs Latin American carriers US LCCs US network carriers (3) 7.1 15.5 11.9 11.2 10.4 9.8 9.2 11.2 8.6 7.9 12.5 Continued cost improvement potential Cost structure 7
  • 8. 8.2 7.9 8.7 9.2 9.8 10.3 11.2 11.2 11.9 12.5 15.5 . Spirit Allegiant Copa Gol Interjet Aeromexico Southwest Latam US network carriers Avianca Volaris cost structure enables us to lower base fares and increase ancillaries Volaris TRASM is below most competitors CASM (1) TRASM and CASM (Sep YTD 2015, USD cents) (2) (1) Based on CASM and TRASM among the publicly-traded airlines (2) Non-USD data converted to USD at an average exchange rate (3) US network carriers direct competitors include: Delta, United, Alaska Airlines and American Airlines Source: Company data, airlines public information Overlap: Volaris’ resilient ULCC model 8 2 5 % TRASM CASM CASM CASM CASM CASM CASM CASM CASM CASM CASM (3)
  • 9. 7 9 11 15 17 21 22 2009 2010 2011 2012 2013 2014 LTM Sep 2015 Non-ticket revenue continue to grow, with upside potential (1) Converted using an average annual MXN/USD exchange rate (2) Mexican legislation does not allow to charge for the first bag Source: Company data, airlines public information Non-ticket revenue per passenger Volaris(USD per passenger) (1,2) Best-in class ULCCs, including first bag fee (2) (LTM Sep 2015, USD per passenger) 2009 – 2015 CAGR: +24.5% 3.1x Ancillaries • Apply revenue management techniques - Pricing by route, season, day - Fully dynamic pricing for some products • Add products - New products & services - Enhancements to existing products • Improve presence - More touch-points to sell ancillaries throughout the journey - Allow customization • Benefit from network diversification - More international capacity Increasing non-ticket revenue allows to reduce fare further and stimulate demand 32 49 54 Wizz Allegiant Spirit 9
  • 10. Network enhancement: connecting the dots and diversifying further Source: Company data New routes Domestic International Cancun +2 +3 Guadalajara +3 +10 Mexico City +3 +1 Monterrey +3 Other +2 +3 Tijuana +2 Total +15 +17 New stations USA Mexico C. America Dallas Durango Guatemala City Fort Lauderdale Huatulco San Jose, CR Houston Tapachula New York Torreon Portland Reno San Juan, PR In the last twelve months, Volaris diversified its network by opening 32 routes and 13 stations Volaris’ September LTM new routes New International New Domestic 10
  • 11. …supporting strong capacity growth New countries Joining existing airports Additional frequencies New airports 7.8% 3.9% 4.6% 0.3% Total ASM growth September YTD capacity growth contribution (yoy) 16.6% Our network is well positioned for diversified growth = + + + + 11 Source: Company data
  • 13. 24 36 18 258 12 2010 2011 2012 2013 2014 LTM Sep 2015 Domestic USA Other international Yoy growth 3.3% 4.0% 8.3% 8.3% 8.3% 10.6%(1) GDP growth 5.1% 4.0% 3.8% 1.7% 2.1% 1.8%(2) GDP multiplier 0.6 1.0 2.2 5.0 3.9 5.9 In recent years, volume growth has been robust despite challenging economic environment Note (1) LTM September 2015 vs. LTM September LTM 2014 (2) Banco de México GDP 2015 estimate Source: DGAC-SCT; INEGI; Banco de México Mexico passenger market volume has increased since 2010 50 52 57 61 67 72 Passenger volume (millions) CAGR: 6.4% 13
  • 14. 3.3% 7.2% 10.0% 0% 2% 4% 6% 8% 10% 12% GDP Passengers RPMs …and supply has met the strong market demand DemandSupply (WB + NB + RJ) (1) 2.2x GDP 2.5% 5.1% 7.1% 0% 2% 4% 6% 8% 10% 12% Aircraft Fleet seats ASMs 2010-2014 Capacity growth (CAGR) 2010-2014 Demand growth (CAGR) (1) WB= wide body, NB= narrow body and RJ= regional jet (2) Only domestic market Source: DGAC, Diio Mi, Banco de México (2) (2) 14
  • 15. (1) Minimum stage length of 170 miles (2) Minimum stage length of 200 miles; CAM stands for Central America; SAM stands for South America (3) South and northbound leisure routes (4) Figures calculated as of September 2015 (5) Data from ALTA Yearbook 2014 Source: Company data, SCT-DGAC and DIIO MI Market Intelligence for the Aviation Industry; ALTA 0 10 20 30 40 50 0 25 50 75 100 USA (Leisure) USA (VFR) CAM, SAM, Canada, Caribbean Significant untapped opportunities Domestic – growth potential of approx. 120 routes (4) International – growth potential of approx.130 routes (4) (3) Number of routes (1) Number of routes (2) Routes served Growth potential 15 In terms of air trips per capita Mexico has plenty potential to grow 2014 air trips per capita(5) 2.05 0.55 0.45 0.42 0.27 0.25 0.21 0.04 0.01 USA Chile Brazil Colombia Peru Mexico Argentina Costa Rica Paraguay
  • 16. ULCC model First sell Trial Ticket giveaway #Nomáscamión Strong conversion rate 2014 Domestic International 2014 Executive & luxury First, economy and other Volaris contributed by stimulating demand from bus to air substitution Source: Company data, Secretaría de Comunicaciones y Transportes (SCT), Dec. 2014 Bus switching programSignificant upside for air travel Total air travel trips in Mexico (mm) Total bus trips in Mexico (mm) 2,837 2,706 77 34 33 67 Mass media campaigns Digital capabilities Attracting 1st time flyers 16 Education
  • 17. Drivers of continued profitable growth Uniquely positioned to capture growth in underpenetrated Mexican aviation market Reduce unit costs Fleet growth Expand network Increase total revenues • Deepen footprint in markets with high demand stimulation • Grow ancillary revenue to world class ULCC benchmarks • 60 additional aircraft to be delivered • Up-gauge fleet from A319 to A320/A321 • Higher seat density configuration • Expand network geographically Source: Company data • Neo incorporation - Fuel efficiency 17 • Price, product, presence
  • 19. 18 18 15 12 17 16 13 13 15 20 28 28 0 0 2 80 2 10 10 0 0 0 2 FY14 FY15 FY16 FY17 A319 A320 A320 w/sharklets A320 NEO w/sharklets A321 w/sharklets A321 NEO w/sharklets Fleet plan with flexibility that enables capacity management Projected fleet under current contracts (number of aircraft) (1) (1) Net fleet after additions and returns (2) Figure calculated as of November 2015 (3) Percentage of year-end fleet with sharklets Source: Company data Backlog of 63 Aircraft to support growth (2) Seat growth % fleet w/Sharklets (3) 18% 39% 18% 59% 19% 66% 56 68 73 50 2016-2018 PDPs fully financedFirst two A320neo First two A321ceo 19
  • 20. 34% 25% 23% 23% 19% 18% 14% 0% 10% 20% 30% 40% Copa Aeromexico Interjet Latam Avianca Gol Revenue CAGR 2009 - 2014 LTM Sep. 2015 Adj. EBITDAR margin High growth and solid financial performance (1) Converted using an average MXN/USD exchange rate for the corresponding period Source: Company data, airlines public information Revenue (1) Adj. EBITDAR (1) 374 536 714 887 1,018 1,056 1,127 0 400 800 1,200 2009 2010 2011 2012 2013 2014 LTM Sep '15 (USDmm) 116 140 100 188 220 232 387 0 150 300 450 2009 2010 2011 2012 2013 2014 LTM Sep '15 (USDmm) 23% 17% 16% 14% 7% 6% 6% 0% 10% 20% 30% Copa Interjet Aeromexico Gol Latam Avianca 20
  • 21. Strong continued performance during Sep YTD 2015 (1) Converted using an MXN/USD exchange rate of Ps.17.0073 (2) Converted using an MXN/USD exchange rate of Ps.13.4541 Source: Company data Sep YTD 2015 Sep YTD 2014 Yoy growth Unit cost (CASM ex-fuel; cents, USD) 4.4(1) 5.2(2) -15.4% Passenger demand (RPMs, bn) 8.4 7.2 +21.4% Aircraft (End of period) 55 48 +14.6% Passengers (mm) 8.7 7.2 +21.4% Operating revenue (mm, MXN) 13,087 10,078 +29.9% Adj. EBITDAR (mm. MXN) 4,606 1,842 >100% LTM Adj. ROIC (pre-tax) 21% 11% +10 pp. 21
  • 22. 25.9% 31.2% 27.4% 19.6% 14.2% 13.9% 10.2% Strong balance sheet and liquidity, well funded for continued growth • Positive cash flow from operating activities in the last four quarters. • Fully financed pre-delivery payments through 2018 and executed sale- leasebacks for 2016 deliveries. • Unrestricted cash of $4.4 billion pesos (US$ 259 million(2)) as of September 30th 2015. • Net cash position of $3.0 billion pesos (US$ 173 million(2)) as of September 30th 2015. • Adjusted long term net debt to EBITDAR of 3.3x as of September 2015 LTM. (1) Includes capital increase of Delta and the issuance of a long term third party loan for. The figure also includes IPO Smiles program proceeds. (2) Figures converted to USD at September end of the period spot exchange rate $17.0073 for convenience purposes only Source: Company data, airlines public information LTM liquidity-cash and equivalents as a % of LTM Op. Revenue 22
  • 24. Fuel hedging position Period Total % hedged Avg. price (gal/USD$) Instrument 4Q15 50% $2.07 Call 1Q16 60% $1.94 Call 2Q16 60% $1.95 Call 3Q16 60% $1.99 Call 4Q16 60% $1.99 Call 1Q17 45% $1.75 Call 2Q17 40% $1.73 Call 3Q17 15% $1.65 Call 24
  • 25. (1) Full year 2014 and September YTD 2015 figures converted to USD at December end of the period spot exchange rate $14.7180 and $17.0073, respectively, for convenience purposes only (2) Audited financial information 2012A – 2014A (3) Includes debt prepayment of Ps.65 million Source: Company data Consolidated statements of operations summary MXN millions unless otherwise stated (2) 2012A 2013A 2014A 2014A (1) September YTD 2015 September YTD 2015(1) % of total operating revenues (USD millions) (USD millions) Passenger 10,177 11,117 11,303 768 10,201 600 77.9 Non-ticket 1,510 1,885 2,733 186 2,887 170 22.1 Total operating revenues 11,686 13,002 14,037 954 13,087 770 100 Fuel 4,730 5,086 5,364 364 3,563 209 27.2 Aircraft and engines rent expense 1,886 2,187 2,535 172 2,483 146 19.0 Landing, take off and navigation expenses 1,640 1,924 2,066 140 1,884 111 14.4 Salaries and benefits 1,303 1,563 1,577 107 1,364 80 10.4 Sales, marketing and distribution expenses 752 704 817 56 750 44 5.7 Maintenance expenses 499 572 665 45 587 35 4.5 Other operating expense, net 288 347 468 32 333 20 2.5 Depreciation and amortization 211 302 343 23 349 21 2.7 Total operating expenses 11,308 12,685 13,833 940 11,312 665 86.46 EBIT 378 317 204 14 1,775 104 13.6 Operating margin (%) 3.2 2.4 1.5 1.5 13.6 13.6 Finance income 14 25 23 2 37 2 0.3 Finance cost (90) (126) (32) (2) (15) (1) (0.1) Exchange (loss) gain, net (95) 66 449 30 789 46 6.0 Income tax expense (3) (18) (39) (3) (776) (46) (5.9) Net income 203 265 (3) 605 41 1,810 106 13.8 Net margin (%) 1.7 2.0 4.3 4.3 13.8 13.8 Adjusted EBITDAR 2,475 2,806 3,081 209 4,606 271 35.2 Adj. EBITDAR margin (%) 21.2 21.6 22.0 22.0 35.2 35.2 EPS Basic and Diluted (Pesos) 0.29 0.31 0.60 0.04 1.79 0.11 EPADS Basic and Diluted (Pesos) 2.94 3.10 6.00 0.40 17.89 1.05 25
  • 26. Consolidated statements of financial position summary (1) Full year 2014 and September 2015 figures converted to USD at December end of the period spot exchange rate $14.7180 and $17.0073, respectively, for convenience purposes only (2) Net debt = financial debt - cash and cash equivalents (3) Adjusted debt = (LTM aircraft rent expense x 7) + financial debt (4) Adjusted net debt = adjusted debt - cash and cash equivalents (5) Audited financial information 2012A – 2014A Source: Company data MXN millions unless otherwise stated (5) 2012A 2013A 2014A 2014A (1) As of September 30, 2015 As of September 30, 2015(1) (USD millions) (USD millions) Cash and cash equivalents 822 2,451 2,265 154 4,408 259 Current guarantee deposits 238 499 545 37 680 40 Other current assets 755 1,050 879 60 833 49 Total current assets 1,815 4,000 3,689 251 5,921 348 Rotable spare parts, furniture and equipment, net 1,195 1,341 2,223 151 2,273 134 Non-current guarantee deposits 2,245 2,603 3,541 241 4,680 275 Other non-current assets 447 434 452 31 869 51 Total assets 5,702 8,378 9,905 673 13,743 808 Unearned transportation revenue 1,259 1,393 1,421 97 1,898 112 Short-term financial debt 527 268 823 56 1,145 67 Other short-term liabilities 1,936 2,211 2,524 172 3,745 220 Total short-term liabilities 3,722 3,872 4,768 324 6,789 399 Long-term financial debt 633 294 425 29 309 18 Other long-term liabilities 272 250 242 16 449 26 Total liabilities 4,627 4,415 5,435 369 7,546 444 Total equity 1,075 3,962 4,470 304 6,196 364 Total liabilities and equity 5,702 8,378 9,905 673 13,743 808 Net debt (2) 338 (1,888) (1,017) (69) (2,954) (174) Adjusted debt (3) 14,360 15,874 18,990 1,290 23,558 1,385 Adjusted net debt (4) 13,538 13,423 16,725 1,136 19,150 1,126 26
  • 27. Consolidated statements of cash flows summary (1) Full year 2014 and September YTD 2015 figures converted to USD at December end of the period spot exchange rate $14.7180 and $17.0073, respectively, for convenience purposes only (2) Audited financial information 2012A - 2014A. (3) Includes debt prepayment premium Source: Company data MXN millions unless otherwise stated (2) 2012A 2013A September YTD 2015 September YTD 2015 (1)2014A 2014A (1) (USD millions) (USD millions) Cash flow from operating activities Income before income tax 207 283 644 44 2,586 152 Depreciation and amortization 211 302 343 23 349 21 Guarantee deposits (311) (620) (695) (47) (1,086) (64) Unearned transportation revenue 433 135 27 2 478 28 Changes in working capital and provisions (43) (61) 14 1 (186) (11) Net cash flows provided by operating activities 497 39 334 23 2,140 126 Cash flow from investing activities Acquisitions of rotable spare parts, furniture, equipment and intangible assets (856) (1,161) (1,603) (109) (912) (54) Pre-delivery payments reimbursements 875 698 396 27 533 31 Proceeds from disposals of rotable spare parts, furniture and equipment 169 151 22 1 134 9 Net cash flows provided by (used in) investing activities 187 (312) (1,185) (81) (245) (14) Cash flow from financing activities Payments of Treasury Shares - - (7) - - - Net proceeds from initial public offering - 2,578 - - - - Transaction costs on issue of shares - (38) - - - - Proceeds from exercised treasury shares - 26 - - - - Interest paid (119) (65) (23) (2) (30) (2) Other finance costs (8) - (11) (1) (40) (2) Payments of financial debt (694) (1,084) (3) (400) (27) (631) (37) Proceeds from financial debt 550 444 966 66 640 38 Net cash flows (used in) provided by financing activities (272) 1,861 525 36 ( 61) (4) Increase (decrease) in cash and cash equivalents 413 1,587 (326) (22) 1,833 108 Net foreign exchange differences (32) 41 141 10 309 18 Cash and cash equivalents at beginning of period 441 822 2,451 167 2,265 133 Cash and cash equivalents at end of period 822 2,451 2,265 154 4,408 259 27
  • 28. Adj. EBITDA and Adj. EBITDAR reconciliation (1) Full year 2014 and September YTD 2015 figures converted to USD at December end of the period spot exchange rate $14.7180 and $17.0073, respectively, for convenience purposes only (2) Audited financial information 2012A - 2014A Source: Company data MXN millions unless otherwise stated (2) 2012A 2013A 2014A 2014A (1) September YTD 2015 September YTD 2015 (1) (USD millions) (USD millions) Net income 203 265 605 41 1,810 106 Plus (minus): Finance costs 90 126 32 2 15 1 Finance income (14) (25) (23) (2) (37) (2) (Benefit)/provision for income taxes 3 18 39 3 776 46 Depreciation and amortization 211 302 343 23 349 21 EBITDA 494 685 995 68 2,912 171 Exchange (gain) loss, net 95 (66) (449) (30) (789) (46) Adjusted EBITDA 589 619 547 37 2,124 125 Aircraft and engine rent expense 1,886 2,187 2,535 172 2,483 146 Adjusted EBITDAR 2,475 2,806 3,081 209 4,606 271 28