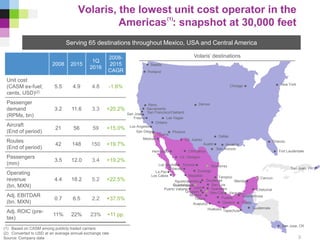
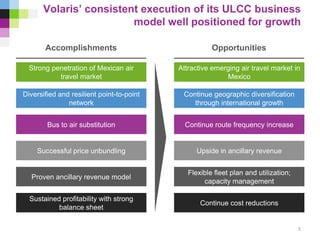
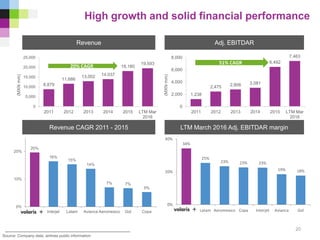
SlideShare a Scribd company logo
1 of 27
Download to read offline
Volaris: the leading ultra-low-cost airline
serving Mexico, USA and Central America
May 2016
The information ("Confidential Information") contained in this presentation is confidential and is provided by
Controladora Vuela Compañía de Aviación, S.A.B. de C.V., (d/b/a Volaris, the "Company") confidentially to you solely
for your reference and may not be retransmitted or distributed to any other persons for any purpose whatsoever.
The Confidential Information is subject to change without notice, its accuracy is not guaranteed, it has not been
independently verified and it may not contain all material information concerning the Company. Neither the Company,
nor any of their respective directors makes any representation or warranty (express or implied) regarding, or
assumes any responsibility or liability for, the accuracy or completeness of, or any errors or omissions in, any
information or opinions contained herein. None of the Company nor any of their respective directors, officers,
employees, stockholders or affiliates nor any other person accepts any liability (in negligence, or otherwise)
whatsoever for any loss howsoever arising from any use of this presentation or its contents or otherwise arising in
connection therewith. No reliance may be placed for any purposes whatsoever on the information set forth in this
presentation or on its completeness.
This presentation does not constitute or form part of any offer or invitation for sale or subscription of or solicitation or
invitation of any offer to buy or subscribe for any securities, nor shall it or any part of it form the basis of or be relied
on in connection with any contract or commitment whatsoever. Recipients of this presentation are not to construe the
contents of this presentation as legal, tax or investment advice and should consult their own advisers in this regard.
This presentation contains statements that constitute forward-looking statements which involve risks and
uncertainties. These statements include descriptions regarding the intent, belief or current expectations of the
Company or its officers with respect to the consolidated results of operations and financial condition, and future
events and plans of the Company. These statements can be recognized by the use of words such as "expects,"
"plans," "will," "estimates," "projects," or words of similar meaning. Such forward-looking statements are not
guarantees of future performance and actual results may differ significantly from those in the forward-looking
statements as a result of various factors and assumptions. You are cautioned not to place undue reliance on these
forward looking statements, which are based on the current view of the management of the Company on future
events. The Company does not undertake to revise forward-looking statements to reflect future events or
circumstances.
Disclaimer
2
Volaris, the lowest unit cost operator in the
Americas : snapshot at 30,000 feet
Serving 65 destinations throughout Mexico, USA and Central America
Volaris’ destinations
(1) Based on CASM among publicly traded carriers
(2) Converted to USD at an average annual exchange rate
Source: Company data
2008 2015
1Q
2016
2008-
2015
CAGR
Unit cost
(CASM ex-fuel;
cents, USD)(2)
5.5 4.9 4.8 -1.6%
Passenger
demand
(RPMs, bn)
3.2 11.6 3.3 +20.2%
Aircraft
(End of period)
21 56 59 +15.0%
Routes
(End of period)
42 148 150 +19.7%
Passengers
(mm)
3.5 12.0 3.4 +19.2%
Operating
revenue
(bn, MXN)
4.4 18.2 5.2 +22.5%
Adj. EBITDAR
(bn. MXN)
0.7 6.5 2.2 +37.5%
Adj. ROIC (pre-
tax)
11% 22% 23% +11 pp.
(1)
3
Portland
Reno
Sacramento
San Francisco/OaklandSan Jose
Fresno
Ontario
Los Angeles
San Diego
Las Vegas
Phoenix
Denver
Dallas
Houston
San Antonio
Chicago New York
Orlando
Fort Lauderdale
Tijuana
Mexicali
La Paz
Los Cabos
Hermosillo
Cd. Juarez
Chihuahua
Cd. Obregon
MonterreyLos Mochis Torreon
Culiacan
Mazatlan
Durango
Tampico
Zacatecas
San Luis
Aguascalientes
Guadalajara
Puerto Vallarta Leon
Uruapan
Morelia
Queretaro
Mex.City
Toluca
Veracruz
Acapulco
Huatulco Tapachula
Puebla
Oaxaca Tuxtla
Villahermosa
Chetumal
Cancun
Merida
Guatemala
San Jose, CR
San Juan, PR
Austin
Seattle
Volaris’ flight path for demand stimulation and
continued growth
Capacity
increase
Cost
reduction
“Clean”,
low
base
fares
More
customers
More
ancillaries
(“You decide”)
Resilient ULCC
business model
driving high,
profitable growth
4
Volaris’ consistent execution of its ULCC business
model well positioned for growth
Diversified and resilient point-to-point
network
Diversified and resilient point-to-point
network
Successful price unbundlingSuccessful price unbundling
Strong penetration of Mexican air
travel market
Strong penetration of Mexican air
travel market
Proven ancillary revenue modelProven ancillary revenue model
Bus to air substitutionBus to air substitution
Upside in ancillary revenueUpside in ancillary revenue
Continue geographic diversification
through international growth
Continue geographic diversification
through international growth
Attractive emerging air travel market in
Mexico
Attractive emerging air travel market in
Mexico
Flexible fleet plan and utilization;
capacity management
Flexible fleet plan and utilization;
capacity management
Sustained profitability with strong
balance sheet
Sustained profitability with strong
balance sheet
Continue cost reductionsContinue cost reductions
Continue route frequency increaseContinue route frequency increase
OpportunitiesAccomplishments
5
Accomplishments
Volaris has a best-in-class unit cost structure
Lowest unit cost in the Americas (1)
CASM and CASM ex-fuel (1Q 2016, USD cents) (2) Cost structure
7
4.8
11.7
8.0 7.6 7.3
6.2
5.1 5.0
8.6
5.8 5.6
10.1
1.4
2.5
1.8 2.1
1.9
2.1
2.5
1.3
2.4
1.8 1.7
2.1
• Economies of scale
- Dilute fixed costs
- High seat density
• Young and fuel efficient fleet
- Sharklet rollout
- Average age of 4.6 years (4)
- Low fuel burn
• Productive network
- Point-to-point
- No connections complexity
• High aircraft utilization
- On average 13.1 block hours a day
during 1Q 2016
(1) Based on CASM among the publicly-traded airlines
(2) Non-USD data converted to USD at an average exchange rate
(3) DCOMPS= Direct Competitors: Average CASM and CASM ex-fuel; US network carriers include: Delta, United, Alaska Airlines and American Airlines
(4) As of March 2016
Source: Company data, airlines public information
Latin American carriers US LCCs US network
carriers (3)
Continued cost improvement
potential
In line with best-in-class
ULCCs
6.2
14.2
9.8 9.8
9.2
8.3
7.6
11.0
7.6
7.3
12.2
6.2
Volaris cost structure enables us to lower base
fares and increase ancillaries
Volaris TRASM is below most competitors CASM (1)
TRASM and CASM (1Q 2016, USD cents) (2)
8
. Spirit Allegiant Gol Copa Interjet Latam Aeromexico Southwest US network
carriers
Avianca
Volaris’ resilient ULCC
model
TRASM
CASM
CASM
CASM
CASM
CASM
CASM
CASM
CASM
CASM
CASM
(3)
7.4 7.3 7.6 7.6
8.3
9.2
9.8 9.8
11.0
12.2
14.2
(1) Based on CASM and TRASM among the publicly-traded airlines
(2) Non-USD data converted to USD at an average exchange rate
(3) US network carriers direct competitors include: Delta, United, Alaska Airlines and American Airlines
Source: Company data, airlines public information
Overlap:
2
5
%
142
204 211
279
338 347
2011 2012 2013 2014 2015 LTM Mar
2016
Non-ticket revenue continue to grow, with
upside potential
(1) Converted using an average annual MXN/USD exchange rate
(2) Mexican legislation does not allow to charge for the first bag
(3) Wizz as of 4Q 2015
Source: Company data, airlines public information
Non-ticket revenue per passenger
Volaris(MXN) per passenger (2)
Best-in class ULCCs, including first bag fee (2)
(1Q 2016, USD per passenger) (1)
2009 – 2015 CAGR: +23.7%
2.4x
Ancillaries
• Apply revenue management techniques
- Pricing by route, season, day
- Fully dynamic pricing for some products
• Add products
- New products & services
- Enhancements to existing products
• Improve presence
- More touch-points to sell ancillaries
throughout the journey
- Allow customization
• Benefit from network diversification
- More international capacity
Increasing non-ticket revenue allows to
reduce fare further and stimulate
demand
9
21
43
53
57
Volaris Wizz Spirit Allegiant
(3)
Network enhancement: connecting the dots and
diversifying further
Source: Company data
New routes
Domestic International
Cancun +2 +3
Guadalajara +4
Mexico City +3
Other +4 +3
Tijuana +1
Total +10 +10
New stations
USA Mexico C. America
Dallas Durango Guatemala City
New York Chetumal San Jose, CR
San Juan, PR Zihuatanejo
In LTM March, Volaris diversified its network by opening 20 routes and 8 stations
Volaris’ LTM new routes
New International
New Domestic
10
…supporting strong capacity growth
Joining existing airportsJoining existing airports
Additional frequenciesAdditional frequencies
New airportsNew airports
27.7%
0.2%
0.0%
Total ASM growthTotal ASM growth
1Q 2016 capacity growth contribution (yoy)
27.9%
Our network is well positioned for diversified growth
=
+
+
+
11
Source: Company data
Growth opportunities
24
38
18
26
6
12
2010 2011 2012 2013 2014 2015 LTM Mar 2016
Domestic USA Other international
Yoy growth 3.3% 4.0% 8.3% 8.3% 8.3% 12.3% 13.0%
GDP growth 5.1% 4.0% 3.8% 1.7% 2.1% 2.5% 2.4%
GDP multiplier 0.6 1.0 2.2 5.0 3.9 4.9 5.4
In recent years, volume growth has been robust
despite challenging economic environment
(1) LTM March 2015 vs. LTM March 2016 growth
(2) GDP growth expectations from Banxico April’s survey
Source: DGAC-SCT; INEGI; Banco de México
Mexico passenger market volume has increased since 2010
50 52
57
61
67
74
Passenger volume (millions)
CAGR:
8.2%
13
77
(1)
(2)
(1) WB= wide body, NB= narrow body and RJ= regional jet
(2) Only domestic market
(3) Only Mexican carriers
Source: DGAC, Diio Mi, Banco de México
2.8%
8.2%
8.8%
0%
1%
2%
3%
4%
5%
6%
7%
8%
9%
10%
GDP Passengers RPMs
…and supply has met the strong market demand
DemandSupply (WB + NB + RJ) (1)
2.9x GDP
4.9%
6.5%
7.2%
0%
2%
4%
6%
8%
10%
12%
Fleet seats Aircraft ASMs
2010-2015 Capacity growth (CAGR) 2010-2015 Demand growth (CAGR)
(2) (2)
14
(3)
(1) Minimum stage length of 170 miles
(2) Minimum stage length of 200 miles; CAM stands for Central America; SAM stands for South America
(3) South and northbound leisure routes
(4) Figures calculated as of September 2015
(5) Data from ALTA Yearbook 2014
Source: Company data, SCT-DGAC and DIIO MI Market Intelligence for the Aviation Industry; ALTA
0
10
20
30
40
50
0
25
50
75
100
USA (Leisure) USA (VFR) CAM, SAM,
Canada,
Caribbean
Significant untapped opportunities
Domestic – growth potential of approx. 120
routes (4)
International – growth potential of approx.130
routes (4)
(3)
Number of routes (1)
Number of routes (2)
Routes served Growth potential
15
In terms of air trips per capita Mexico has plenty potential to grow
2014 air trips per capita(5)
2.05
0.55 0.45 0.42
0.27 0.25 0.21
0.04 0.01
USA Chile Brazil Colombia Peru Mexico Argentina Costa Rica Paraguay
2012 2015
Exectutive and Luxury
First, economy and
other
ULCC model
First sell
Trial
Ticket giveaway
#Nomáscamión
Strong conversion
rate
Volaris contributed by stimulating demand from
bus to air substitution
Source: Company data, Secretaría de Comunicaciones y Transportes (SCT), Dec. 2014
Bus switching programSignificant upside for air travel
Total air travel passengers
in Mexico (mm)
Total bus passengers
in Mexico (mm)
2,758
33
Mass media campaigns
Digital capabilities
Attracting 1st
time flyers
16
Education
2,918
2,683 2,834
74 79
28 37
27
38
2012 2015
Domestic
International
55
75
Drivers of continued profitable growth
Uniquely positioned to capture growth in underpenetrated Mexican aviation market
Reduce
unit costs
Fleet
growth
Expand
network
Increase
total
revenues
• Deepen footprint in
markets with high
demand stimulation
• Grow ancillary revenue to
world class ULCC
benchmarks
• 58 additional aircraft to be
delivered
• Up-gauge fleet from
A319 to A320/A321
• Higher seat density
configuration
• Expand network
geographically
Source: Company data
• Neo incorporation
- Fuel efficiency
17
• Price, product,
presence
Fleet and financials
18 15 12
5
16
15 15
15
20 28 28
28
0
2 8 182
10 10 10
0
0
2
6
2015 2016E 2017E 2018E
A319 A320 A320 w/sharklets A320 NEO w/sharklets A321 w/sharklets A321 NEO w/sharklets
Fleet plan with flexibility that enables capacity
management
Projected fleet under current contracts (number of aircraft) (1)
(1) Net fleet after additions and returns
(2) Figure calculated as of March 2016
(3) Percentage of year-end seats with sharklets
Source: Company data
Backlog of 58 Aircraft to support growth (2)Backlog of 58 Aircraft to support growth (2)
Seat growth
% seats w/Sharklets (3)
18%
61%
20%
68%
11%
78%
70
75
82
56
2016-2018 PDPs
fully financed
First two A320neo
19
1,238
2,475 2,806 3,081
6,492
7,463
0
2,000
4,000
6,000
8,000
2011 2012 2013 2014 2015 LTM Mar
2016
(MXNmm)
8,879
11,686
13,002 14,037
18,180
19,593
0
5,000
10,000
15,000
20,000
25,000
2011 2012 2013 2014 2015 LTM Mar
2016
(MXNmm)
Revenue CAGR 2011 - 2015 LTM March 2016 Adj. EBITDAR margin
High growth and solid financial performance
Revenue Adj. EBITDAR
20
20% CAGR
51% CAGR
34%
25%
23% 23% 23%
19% 18%
0%
20%
40%
Latam Aeromexico Copa Interjet Avianca Gol
20%
16%
15%
14%
7% 7%
5%
0%
10%
20%
Interjet Latam Avianca Aeromexico Gol Copa
Source: Company data, airlines public information
Strong balance sheet and liquidity, well funded
for continued growth
21
(1) Figures converted to USD at March end of the period spot exchange rate $17.4015 for convenience purposes only
Source: Company data, airlines public information
• Unrestricted cash of $6.4 billion pesos (US$
366 million(1)) as of March 31st 2016.
• Net cash position of $5.3 billion pesos (US$
303 million(1)) as of March 31st 2016.
• Adjusted long term net debt to EBITDAR of
3.0x as of March 31st 2016.
• Fully financed pre-delivery payments
through 2018 and executed sale-
leasebacks for 2016 deliveries.
• Expected 2016 net CAPEX neutral (US$ 0
to -10 million):
• PDPs: from US$ -50 to -45 million,
net of PDP reimbursements (8 aircraft
order book deliveries)
• Major maintenance: US$ 25 to 35
million
• Other: from US$ 10 to 15 million
2.8x 3.0x
4.8x
5.9x
6.6x
11.0x
Copa Aeromexico LatAm Avianca Gol
33.2% 32.5%
18.2%
13.9%
11.7% 11.7%
Copa Gol Latam Aeromexico Avianca
Adj. net debt/EBITDAR
LTM liquidity-cash and equivalents as a % of LTM Op. Revenue
Appendix
Fuel hedging position
23
(1) Approximate percentage of gallons hedged
Period Total % hedged(1)
Avg. price (gal/USD$) Instrument
2Q16 60% $1.95 Call
3Q16 60% $1.99 Call
4Q16 60% $1.99 Call
1Q17 50% $1.64 Call
2Q17 50% $1.61 Call
3Q17 50% $1.44 Call
4Q17 50% $1.40 Call
1Q18 20% $1.46 Call
2Q18 5% $1.40 Call
(1) Full year 2015 figures converted to USD at December end of the period spot exchange rate $17.2065, respectively, for convenience purposes only.
(2) 1Q 2016 figures converted to USD at March end of the period spot exchange rate $17.4015, respectively, for convenience purposes only.
(3) Audited financial information 2013A – 2015A
(4) Includes debt prepayment of Ps.570 million
Source: Company data
Consolidated statements of operations summary
MXN millions unless otherwise stated (3) 2013A 2014A 2015A 2015A (1) 1Q 2016 1Q 2016(2)
% of total
operating
revenues
(USD
millions)
(USD
millions)
Passenger 11,117 11,303 14,130 821 3,906 224 75.4
Non-ticket 1,885 2,733 4,049 235 1,276 73 24.6
Total operating revenues 13,002 14,037 18,180 1,057 5,182 298 100
Fuel 5,086 5,364 4,721 274 1,013 58 19.6
Aircraft and engine rent expense 2,187 2,535 3,525 205 1,219 70 23.5
Landing, take off and navigation expenses 1,924 2,066 2,595 151 791 45 15.3
Salaries and benefits 1,563 1,577 1,903 111 564 32 10.9
Sales, marketing and distribution expenses 704 817 1,089 63 295 17 5.7
Maintenance expenses 572 665 875 51 340 20 6.6
Other operating expense, net 347 468 505 29 4 - 0.1
Depreciation and amortization 302 343 457 27 120 7 2.3
Total operating expenses 12,685 13,833 15,669 911 4,346 250 83.9
6
EBIT 317 204 2,510 146 836 48 16.1
Operating margin (%) 2.4 1.5 13.8 13.8 16.1 16.1
Finance income 25 23 47 3 34 2 0.7
Finance cost (126) (32) (22) (1) (7) - (0.1)
Exchange gain, net 66 449 967 56 9 1 0.2
Income tax expense (18) (39) (1,038) (60) (270) (16) (5.2)
Net income 265 (4) 605 2,464 143 602 35 11.6
Net margin (%) 2.0 4.3 13.6 13.6 11.6 11.6
Adjusted EBITDAR 2,806 3,081 6,492 377 2,175 125 42.0
Adj. EBITDAR margin (%) 21.6 22.0 35.7 35.7 42.0 42.0
EPS Basic and Diluted (Pesos) 0.31 0.60 2.43 0.14 0.59 0.03
EPADS Basic and Diluted (Pesos) 3.10 6.00 24.35 1.42 5.95 0.34
24
Consolidated statements of financial position
summary
(1) Full year 2015 figures converted to USD at December end of the period spot exchange rate $17.2065 for convenience purposes only
(2) 1Q 2016 figures converted to USD at March end of the period spot exchange rate $17.4015, respectively, for convenience purposes only.
(3) Net debt = financial debt - cash and cash equivalents
(4) Adjusted debt = (LTM aircraft rent expense x 7) + financial debt
(5) Adjusted net debt = adjusted debt - cash and cash equivalents
(6) Audited financial information 2013A – 2015A
Source: Company data
MXN millions unless otherwise
stated (6) 2013A 2014A 2015A 2015A (1) 1Q 2016 1Q 2016 (2)
(USD
millions)
(USD
millions)
Cash and cash equivalents 2,451 2,265 5,157 300 6,366 366
Current guarantee deposits 499 545 861 50 1,052 60
Other current assets 1,050 879 1,223 71 1,300 75
Total current assets 4,000 3,689 7,241 421 8,718 501
Rotable spare parts, furniture
and equipment, net
1,341 2,223 2,550 148 2,187 126
Non-current guarantee deposits 2,603 3,541 4,704 273 4,703 270
Other non-current assets 434 452 765 44 996 57
Total assets 8,378 9,905 15,261 887 16,604 954
Unearned transportation
revenue 1,393 1,421 1,957 114 2,558 147
Short-term financial debt 268 823 1,371 80 845 49
Other short-term liabilities 2,211 2,524 3,774 219 4,336 249
Total short-term liabilities 3,872 4,768 7,103 413 7,739 445
Long-term financial debt 294 425 220 13 256 15
Other long-term liabilities 250 242 1,113 65 1,126 65
Total liabilities 4,415 5,435 8,436 490 9,120 524
Total equity 3,962 4,470 6,825 397 7,484 430
Total liabilities and equity 8,378 9,905 15,261 877 16,604 954
Net debt (3) (1,888) (1,017) (3,566) (207) (5,265) (303)
Adjusted debt (4) 15,874 18,990 26,268 1,527 29,028 1,668
Adjusted net debt (5) 13,423 16,725 21,111 1,227 22,662 1,302
25
Consolidated statements of cash flows summary
(1) Full year 2015 figures converted to USD at December end of the period spot exchange rate $17.2065 for convenience purposes only
(2) 1Q 2016 figures converted to USD at March end of the period spot exchange rate $17.4015, respectively, for convenience purposes only.
(3) Audited financial information 2013A - 2015A.
(4) Includes debt prepayment premium
Source: Company data
MXN millions unless otherwise stated (3) 2013A 2014A 2015A 2015A (1) 1Q 2016 1Q 2016(2)
(USD
millions)
(USD
millions)
Cash flow from operating activities
Income before income tax 283 644 3,502 204 872 50
Depreciation and amortization 302 343 457 27 120 7
Guarantee deposits (620) (695) (1,165) (68) (319) (18)
Unearned transportation revenue 135 27 536 31 600 35
Changes in working capital and provisions (61) 14 (261) (15) 56 3
Net cash flows provided by operating activities 39 334 3,070 178 1,329 77
Cash flow from investing activities
Acquisitions of rotable spare parts, furniture, equipment and
intangible assets (1,161) (1,603) (1,456) (85) (207) (12)
Pre-delivery payments reimbursements 698 396 670 39 446 26
Proceeds from disposals of rotable spare parts, furniture
and equipment 151 22 185 11 197 11
Net cash flows (used in) provided by investing activities (312) (1,185) (601) (35) 435 25
Cash flow from financing activities
Payments of Treasury Shares - (7) - - - -
Net proceeds from initial public offering 2,578 - - - - -
Transaction costs on issue of shares (38) - - - - -
Proceeds from exercised treasury shares 26 - 23 1 - -
Interest paid (65) (23) (42) (2) (13) (1)
Other finance costs - (11) (40) (2) - -
Payments of financial debt (1,084) (4) (400) (801) (47) (570) (33)
Proceeds from financial debt 444 966 925 54 35 2
Net cash flows provided by (used in) financing activities 1,861 525 65 4 (549) (32)
Increase (decrease) in cash and cash equivalents 1,587 (326) 2,533 147 1,216 70
Net foreign exchange differences 41 141 359 21 (7) -
Cash and cash equivalents at beginning of period 822 2,451 2,265 132 5,157 296
Cash and cash equivalents at end of period 2,451 2,265 5,157 300 6,366 366
26
Adj. EBITDA and Adj. EBITDAR reconciliation
(1) Full year 2015 figures converted to USD at December end of the period spot exchange rate $17.2065 for convenience purposes only
(2) 1Q 2016 figures converted to USD at March end of the period spot exchange rate $17.4015, respectively, for convenience purposes only.
(3) Audited financial information 2013A - 2015A
Source: Company data
MXN millions unless otherwise stated (3) 2013A 2014A 2015A 2015A (1) 1Q 2016 1Q 2016 (2)
(USD
millions)
(USD
millions)
Net income 265 605 2,464 143 602 35
Plus (minus):
Finance costs 126 32 22 1 7 -
Finance income (25) (23) (47) (3) (34) (2)
(Benefit)/provision for income taxes 18 39 1,038 60 270 16
Depreciation and amortization 302 343 457 27 120 7
EBITDA 685 995 3,934 229 965 56
Exchange (gain) loss, net (66) (449) (967) (56) (9) (1)
Adjusted EBITDA 619 547 2,967 172 956 55
Aircraft and engine rent expense 2,187 2,535 3,525 205 1,219 70
Adjusted EBITDAR 2,806 3,081 6,492 377 2,175 125
27

More Related Content

What's hot

Aeromexico Overview Presentation - September 2014
Aeromexico Overview Presentation - September 2014Aeromexico Overview Presentation - September 2014
Aeromexico Overview Presentation - September 2014Aeromexico_IR
 
Volaris corporate presentation 4 q17
Volaris corporate presentation 4 q17Volaris corporate presentation 4 q17
Volaris corporate presentation 4 q17irvolaris
 
Volaris corp presentation march 2018
Volaris corp presentation march 2018Volaris corp presentation march 2018
Volaris corp presentation march 2018irvolaris
 
Corp pres june 2018
Corp pres june 2018Corp pres june 2018
Corp pres june 2018irvolaris
 
Corp prez may 2018 ii
Corp prez may 2018 iiCorp prez may 2018 ii
Corp prez may 2018 iiirvolaris
 
Corp prez may 2018 ii
Corp prez may 2018 iiCorp prez may 2018 ii
Corp prez may 2018 iiirvolaris
 
Volaris corp presentation march 2018
Volaris corp presentation march 2018Volaris corp presentation march 2018
Volaris corp presentation march 2018irvolaris
 
Corp pres june 2018
Corp pres june 2018Corp pres june 2018
Corp pres june 2018irvolaris
 
Corp pres july 2018 v1
Corp pres july 2018 v1Corp pres july 2018 v1
Corp pres july 2018 v1irvolaris
 
Corp pres july 2018 v1
Corp pres july 2018 v1Corp pres july 2018 v1
Corp pres july 2018 v1irvolaris
 
Volaris corp presentation may 2018 ii
Volaris corp presentation may 2018 iiVolaris corp presentation may 2018 ii
Volaris corp presentation may 2018 iiirvolaris
 
Volaris corp presentation may 2018
Volaris corp presentation may 2018Volaris corp presentation may 2018
Volaris corp presentation may 2018irvolaris
 
Volaris corp presentation may 2018
Volaris corp presentation may 2018Volaris corp presentation may 2018
Volaris corp presentation may 2018irvolaris
 
Volaris corporate presentation january 2018 2
Volaris corporate presentation january 2018 2Volaris corporate presentation january 2018 2
Volaris corporate presentation january 2018 2irvolaris
 
Corp prez may 2018 ii
Corp prez may 2018 iiCorp prez may 2018 ii
Corp prez may 2018 iiirvolaris
 
Volaris corporate presentation - march
Volaris corporate presentation - marchVolaris corporate presentation - march
Volaris corporate presentation - marchirvolaris
 
Volaris corp presentation may 2018
Volaris corp presentation may 2018Volaris corp presentation may 2018
Volaris corp presentation may 2018irvolaris
 
Volaris corporate presentation baml transportation conference
Volaris corporate presentation   baml transportation conferenceVolaris corporate presentation   baml transportation conference
Volaris corporate presentation baml transportation conferenceirvolaris
 
Volaris investor day presentation 2017
Volaris investor day presentation 2017Volaris investor day presentation 2017
Volaris investor day presentation 2017irvolaris
 
Volaris corporate presentation - cowen transportation conference
Volaris corporate presentation -  cowen transportation conferenceVolaris corporate presentation -  cowen transportation conference
Volaris corporate presentation - cowen transportation conferenceirvolaris
 

What's hot (20)

Aeromexico Overview Presentation - September 2014
Aeromexico Overview Presentation - September 2014Aeromexico Overview Presentation - September 2014
Aeromexico Overview Presentation - September 2014
 
Volaris corporate presentation 4 q17
Volaris corporate presentation 4 q17Volaris corporate presentation 4 q17
Volaris corporate presentation 4 q17
 
Volaris corp presentation march 2018
Volaris corp presentation march 2018Volaris corp presentation march 2018
Volaris corp presentation march 2018
 
Corp pres june 2018
Corp pres june 2018Corp pres june 2018
Corp pres june 2018
 
Corp prez may 2018 ii
Corp prez may 2018 iiCorp prez may 2018 ii
Corp prez may 2018 ii
 
Corp prez may 2018 ii
Corp prez may 2018 iiCorp prez may 2018 ii
Corp prez may 2018 ii
 
Volaris corp presentation march 2018
Volaris corp presentation march 2018Volaris corp presentation march 2018
Volaris corp presentation march 2018
 
Corp pres june 2018
Corp pres june 2018Corp pres june 2018
Corp pres june 2018
 
Corp pres july 2018 v1
Corp pres july 2018 v1Corp pres july 2018 v1
Corp pres july 2018 v1
 
Corp pres july 2018 v1
Corp pres july 2018 v1Corp pres july 2018 v1
Corp pres july 2018 v1
 
Volaris corp presentation may 2018 ii
Volaris corp presentation may 2018 iiVolaris corp presentation may 2018 ii
Volaris corp presentation may 2018 ii
 
Volaris corp presentation may 2018
Volaris corp presentation may 2018Volaris corp presentation may 2018
Volaris corp presentation may 2018
 
Volaris corp presentation may 2018
Volaris corp presentation may 2018Volaris corp presentation may 2018
Volaris corp presentation may 2018
 
Volaris corporate presentation january 2018 2
Volaris corporate presentation january 2018 2Volaris corporate presentation january 2018 2
Volaris corporate presentation january 2018 2
 
Corp prez may 2018 ii
Corp prez may 2018 iiCorp prez may 2018 ii
Corp prez may 2018 ii
 
Volaris corporate presentation - march
Volaris corporate presentation - marchVolaris corporate presentation - march
Volaris corporate presentation - march
 
Volaris corp presentation may 2018
Volaris corp presentation may 2018Volaris corp presentation may 2018
Volaris corp presentation may 2018
 
Volaris corporate presentation baml transportation conference
Volaris corporate presentation   baml transportation conferenceVolaris corporate presentation   baml transportation conference
Volaris corporate presentation baml transportation conference
 
Volaris investor day presentation 2017
Volaris investor day presentation 2017Volaris investor day presentation 2017
Volaris investor day presentation 2017
 
Volaris corporate presentation - cowen transportation conference
Volaris corporate presentation -  cowen transportation conferenceVolaris corporate presentation -  cowen transportation conference
Volaris corporate presentation - cowen transportation conference
 

Similar to Volaris corporate presentation may 2016

Volaris corporate presentation - december 2014
Volaris corporate presentation - december 2014Volaris corporate presentation - december 2014
Volaris corporate presentation - december 2014irvolaris
 
Volaris Corporate Presentation December 2013
Volaris Corporate Presentation  December 2013Volaris Corporate Presentation  December 2013
Volaris Corporate Presentation December 2013irvolaris
 
Volaris corporate presentation - deutsche bank ge ms conference
Volaris corporate presentation -  deutsche bank ge ms conferenceVolaris corporate presentation -  deutsche bank ge ms conference
Volaris corporate presentation - deutsche bank ge ms conferenceirvolaris
 
Volaris corporate presentation january 2018
Volaris corporate presentation january 2018Volaris corporate presentation january 2018
Volaris corporate presentation january 2018irvolaris
 
Volaris corporate presentation - march
Volaris corporate presentation - marchVolaris corporate presentation - march
Volaris corporate presentation - marchirvolaris
 
Volaris corporate presentation november 2017
Volaris corporate presentation november 2017Volaris corporate presentation november 2017
Volaris corporate presentation november 2017irvolaris
 
141030 volaris corporate presentation - october 2014
141030 volaris corporate presentation - october 2014141030 volaris corporate presentation - october 2014
141030 volaris corporate presentation - october 2014irvolaris
 
Volaris corporate presentation november 2017
Volaris corporate presentation november 2017Volaris corporate presentation november 2017
Volaris corporate presentation november 2017irvolaris
 
Volaris corporate presentation september 2017
Volaris corporate presentation september 2017Volaris corporate presentation september 2017
Volaris corporate presentation september 2017irvolaris
 
Citi’s 26th Annual Latin America Conference
Citi’s 26th Annual Latin America ConferenceCiti’s 26th Annual Latin America Conference
Citi’s 26th Annual Latin America Conferenceirvolaris
 
Volaris corp presentation march 2018 esp
Volaris corp presentation march 2018 espVolaris corp presentation march 2018 esp
Volaris corp presentation march 2018 espirvolaris
 
Volaris corp presentation march 2018 (2)
Volaris corp presentation march 2018 (2)Volaris corp presentation march 2018 (2)
Volaris corp presentation march 2018 (2)irvolaris
 
Volaris corporate presentation may 2017
Volaris corporate presentation may 2017Volaris corporate presentation may 2017
Volaris corporate presentation may 2017irvolaris
 
Volaris Corporate Presentation March 2015
Volaris Corporate Presentation March 2015Volaris Corporate Presentation March 2015
Volaris Corporate Presentation March 2015irvolaris
 
Volaris corporate presentation may 2015
Volaris corporate presentation may 2015Volaris corporate presentation may 2015
Volaris corporate presentation may 2015irvolaris
 

Similar to Volaris corporate presentation may 2016 (15)

Volaris corporate presentation - december 2014
Volaris corporate presentation - december 2014Volaris corporate presentation - december 2014
Volaris corporate presentation - december 2014
 
Volaris Corporate Presentation December 2013
Volaris Corporate Presentation  December 2013Volaris Corporate Presentation  December 2013
Volaris Corporate Presentation December 2013
 
Volaris corporate presentation - deutsche bank ge ms conference
Volaris corporate presentation -  deutsche bank ge ms conferenceVolaris corporate presentation -  deutsche bank ge ms conference
Volaris corporate presentation - deutsche bank ge ms conference
 
Volaris corporate presentation january 2018
Volaris corporate presentation january 2018Volaris corporate presentation january 2018
Volaris corporate presentation january 2018
 
Volaris corporate presentation - march
Volaris corporate presentation - marchVolaris corporate presentation - march
Volaris corporate presentation - march
 
Volaris corporate presentation november 2017
Volaris corporate presentation november 2017Volaris corporate presentation november 2017
Volaris corporate presentation november 2017
 
141030 volaris corporate presentation - october 2014
141030 volaris corporate presentation - october 2014141030 volaris corporate presentation - october 2014
141030 volaris corporate presentation - october 2014
 
Volaris corporate presentation november 2017
Volaris corporate presentation november 2017Volaris corporate presentation november 2017
Volaris corporate presentation november 2017
 
Volaris corporate presentation september 2017
Volaris corporate presentation september 2017Volaris corporate presentation september 2017
Volaris corporate presentation september 2017
 
Citi’s 26th Annual Latin America Conference
Citi’s 26th Annual Latin America ConferenceCiti’s 26th Annual Latin America Conference
Citi’s 26th Annual Latin America Conference
 
Volaris corp presentation march 2018 esp
Volaris corp presentation march 2018 espVolaris corp presentation march 2018 esp
Volaris corp presentation march 2018 esp
 
Volaris corp presentation march 2018 (2)
Volaris corp presentation march 2018 (2)Volaris corp presentation march 2018 (2)
Volaris corp presentation march 2018 (2)
 
Volaris corporate presentation may 2017
Volaris corporate presentation may 2017Volaris corporate presentation may 2017
Volaris corporate presentation may 2017
 
Volaris Corporate Presentation March 2015
Volaris Corporate Presentation March 2015Volaris Corporate Presentation March 2015
Volaris Corporate Presentation March 2015
 
Volaris corporate presentation may 2015
Volaris corporate presentation may 2015Volaris corporate presentation may 2015
Volaris corporate presentation may 2015
 

Recently uploaded

OKC Thunder Reveal Game 2 Playoff T Shirts
OKC Thunder Reveal Game 2 Playoff T ShirtsOKC Thunder Reveal Game 2 Playoff T Shirts
OKC Thunder Reveal Game 2 Playoff T Shirtsrahman018755
 
《加州大学圣克鲁兹分校学位证书复制》Q微信741003700美国学历疑难问题指南|挂科被加州大学圣克鲁兹分校劝退没有毕业证怎么办?《UCSC毕业证购买|加...
《加州大学圣克鲁兹分校学位证书复制》Q微信741003700美国学历疑难问题指南|挂科被加州大学圣克鲁兹分校劝退没有毕业证怎么办?《UCSC毕业证购买|加...《加州大学圣克鲁兹分校学位证书复制》Q微信741003700美国学历疑难问题指南|挂科被加州大学圣克鲁兹分校劝退没有毕业证怎么办?《UCSC毕业证购买|加...
《加州大学圣克鲁兹分校学位证书复制》Q微信741003700美国学历疑难问题指南|挂科被加州大学圣克鲁兹分校劝退没有毕业证怎么办?《UCSC毕业证购买|加...wyqazy
 
CALL ON ➥8923113531 🔝Call Girls Vineet Khand Lucknow best Night Fun service 🧦
CALL ON ➥8923113531 🔝Call Girls Vineet Khand Lucknow best Night Fun service  🧦CALL ON ➥8923113531 🔝Call Girls Vineet Khand Lucknow best Night Fun service  🧦
CALL ON ➥8923113531 🔝Call Girls Vineet Khand Lucknow best Night Fun service 🧦anilsa9823
 
VIP Kolkata Call Girl Rishra 👉 8250192130 Available With Room
VIP Kolkata Call Girl Rishra 👉 8250192130  Available With RoomVIP Kolkata Call Girl Rishra 👉 8250192130  Available With Room
VIP Kolkata Call Girl Rishra 👉 8250192130 Available With Roomdivyansh0kumar0
 
Teck Investor Presentation, April 24, 2024
Teck Investor Presentation, April 24, 2024Teck Investor Presentation, April 24, 2024
Teck Investor Presentation, April 24, 2024TeckResourcesLtd
 
VIP Amritsar Call Girl 7001035870 Enjoy Call Girls With Our Escorts
VIP Amritsar Call Girl 7001035870 Enjoy Call Girls With Our EscortsVIP Amritsar Call Girl 7001035870 Enjoy Call Girls With Our Escorts
VIP Amritsar Call Girl 7001035870 Enjoy Call Girls With Our Escortssonatiwari757
 
Q3 FY24 Earnings Conference Call Presentation
Q3 FY24 Earnings Conference Call PresentationQ3 FY24 Earnings Conference Call Presentation
Q3 FY24 Earnings Conference Call PresentationSysco_Investors
 
Russian Call Girls Kolkata Amaira 🤌 8250192130 🚀 Vip Call Girls Kolkata
Russian Call Girls Kolkata Amaira 🤌  8250192130 🚀 Vip Call Girls KolkataRussian Call Girls Kolkata Amaira 🤌  8250192130 🚀 Vip Call Girls Kolkata
Russian Call Girls Kolkata Amaira 🤌 8250192130 🚀 Vip Call Girls Kolkataanamikaraghav4
 
Methanex Investor Presentation (April 2024)
Methanex Investor Presentation (April 2024)Methanex Investor Presentation (April 2024)
Methanex Investor Presentation (April 2024)Methanex Corporation
 
Cyberagent_For New Investors_EN_240424.pdf
Cyberagent_For New Investors_EN_240424.pdfCyberagent_For New Investors_EN_240424.pdf
Cyberagent_For New Investors_EN_240424.pdfCyberAgent, Inc.
 
Call Girls in Friends Colony 9711199171 Delhi Enjoy Call Girls With Our Escorts
Call Girls in Friends Colony 9711199171 Delhi Enjoy Call Girls With Our EscortsCall Girls in Friends Colony 9711199171 Delhi Enjoy Call Girls With Our Escorts
Call Girls in Friends Colony 9711199171 Delhi Enjoy Call Girls With Our Escortsindian call girls near you
 
Sustainability Leadership, April 26 2024
Sustainability Leadership, April 26 2024Sustainability Leadership, April 26 2024
Sustainability Leadership, April 26 2024TeckResourcesLtd
 
Malad Escorts, (Pooja 09892124323), Malad Call Girls Service
Malad Escorts, (Pooja 09892124323), Malad Call Girls ServiceMalad Escorts, (Pooja 09892124323), Malad Call Girls Service
Malad Escorts, (Pooja 09892124323), Malad Call Girls ServicePooja Nehwal
 
CALL ON ➥8923113531 🔝Call Girls Fazullaganj Lucknow best sexual service
CALL ON ➥8923113531 🔝Call Girls Fazullaganj Lucknow best sexual serviceCALL ON ➥8923113531 🔝Call Girls Fazullaganj Lucknow best sexual service
CALL ON ➥8923113531 🔝Call Girls Fazullaganj Lucknow best sexual serviceanilsa9823
 
Call Girl Kolkata Sia 🤌 8250192130 🚀 Vip Call Girls Kolkata
Call Girl Kolkata Sia 🤌  8250192130 🚀 Vip Call Girls KolkataCall Girl Kolkata Sia 🤌  8250192130 🚀 Vip Call Girls Kolkata
Call Girl Kolkata Sia 🤌 8250192130 🚀 Vip Call Girls Kolkataanamikaraghav4
 

Recently uploaded (20)

OKC Thunder Reveal Game 2 Playoff T Shirts
OKC Thunder Reveal Game 2 Playoff T ShirtsOKC Thunder Reveal Game 2 Playoff T Shirts
OKC Thunder Reveal Game 2 Playoff T Shirts
 
《加州大学圣克鲁兹分校学位证书复制》Q微信741003700美国学历疑难问题指南|挂科被加州大学圣克鲁兹分校劝退没有毕业证怎么办?《UCSC毕业证购买|加...
《加州大学圣克鲁兹分校学位证书复制》Q微信741003700美国学历疑难问题指南|挂科被加州大学圣克鲁兹分校劝退没有毕业证怎么办?《UCSC毕业证购买|加...《加州大学圣克鲁兹分校学位证书复制》Q微信741003700美国学历疑难问题指南|挂科被加州大学圣克鲁兹分校劝退没有毕业证怎么办?《UCSC毕业证购买|加...
《加州大学圣克鲁兹分校学位证书复制》Q微信741003700美国学历疑难问题指南|挂科被加州大学圣克鲁兹分校劝退没有毕业证怎么办?《UCSC毕业证购买|加...
 
CALL ON ➥8923113531 🔝Call Girls Vineet Khand Lucknow best Night Fun service 🧦
CALL ON ➥8923113531 🔝Call Girls Vineet Khand Lucknow best Night Fun service  🧦CALL ON ➥8923113531 🔝Call Girls Vineet Khand Lucknow best Night Fun service  🧦
CALL ON ➥8923113531 🔝Call Girls Vineet Khand Lucknow best Night Fun service 🧦
 
Rohini Sector 15 Call Girls Delhi 9999965857 @Sabina Saikh No Advance
Rohini Sector 15 Call Girls Delhi 9999965857 @Sabina Saikh No AdvanceRohini Sector 15 Call Girls Delhi 9999965857 @Sabina Saikh No Advance
Rohini Sector 15 Call Girls Delhi 9999965857 @Sabina Saikh No Advance
 
VIP Kolkata Call Girl Rishra 👉 8250192130 Available With Room
VIP Kolkata Call Girl Rishra 👉 8250192130  Available With RoomVIP Kolkata Call Girl Rishra 👉 8250192130  Available With Room
VIP Kolkata Call Girl Rishra 👉 8250192130 Available With Room
 
Teck Investor Presentation, April 24, 2024
Teck Investor Presentation, April 24, 2024Teck Investor Presentation, April 24, 2024
Teck Investor Presentation, April 24, 2024
 
Call Girls 🫤 Nehru Place ➡️ 9999965857 ➡️ Delhi 🫦 Russian Escorts FULL ENJOY
Call Girls 🫤 Nehru Place ➡️ 9999965857  ➡️ Delhi 🫦  Russian Escorts FULL ENJOYCall Girls 🫤 Nehru Place ➡️ 9999965857  ➡️ Delhi 🫦  Russian Escorts FULL ENJOY
Call Girls 🫤 Nehru Place ➡️ 9999965857 ➡️ Delhi 🫦 Russian Escorts FULL ENJOY
 
VIP Amritsar Call Girl 7001035870 Enjoy Call Girls With Our Escorts
VIP Amritsar Call Girl 7001035870 Enjoy Call Girls With Our EscortsVIP Amritsar Call Girl 7001035870 Enjoy Call Girls With Our Escorts
VIP Amritsar Call Girl 7001035870 Enjoy Call Girls With Our Escorts
 
Q3 FY24 Earnings Conference Call Presentation
Q3 FY24 Earnings Conference Call PresentationQ3 FY24 Earnings Conference Call Presentation
Q3 FY24 Earnings Conference Call Presentation
 
Russian Call Girls Kolkata Amaira 🤌 8250192130 🚀 Vip Call Girls Kolkata
Russian Call Girls Kolkata Amaira 🤌  8250192130 🚀 Vip Call Girls KolkataRussian Call Girls Kolkata Amaira 🤌  8250192130 🚀 Vip Call Girls Kolkata
Russian Call Girls Kolkata Amaira 🤌 8250192130 🚀 Vip Call Girls Kolkata
 
Call Girls In Kalkaji 📱 9999965857 🤩 Delhi 🫦 HOT AND SEXY VVIP 🍎 SERVICE
Call Girls In Kalkaji 📱  9999965857  🤩 Delhi 🫦 HOT AND SEXY VVIP 🍎 SERVICECall Girls In Kalkaji 📱  9999965857  🤩 Delhi 🫦 HOT AND SEXY VVIP 🍎 SERVICE
Call Girls In Kalkaji 📱 9999965857 🤩 Delhi 🫦 HOT AND SEXY VVIP 🍎 SERVICE
 
Methanex Investor Presentation (April 2024)
Methanex Investor Presentation (April 2024)Methanex Investor Presentation (April 2024)
Methanex Investor Presentation (April 2024)
 
Cyberagent_For New Investors_EN_240424.pdf
Cyberagent_For New Investors_EN_240424.pdfCyberagent_For New Investors_EN_240424.pdf
Cyberagent_For New Investors_EN_240424.pdf
 
Call Girls in Friends Colony 9711199171 Delhi Enjoy Call Girls With Our Escorts
Call Girls in Friends Colony 9711199171 Delhi Enjoy Call Girls With Our EscortsCall Girls in Friends Colony 9711199171 Delhi Enjoy Call Girls With Our Escorts
Call Girls in Friends Colony 9711199171 Delhi Enjoy Call Girls With Our Escorts
 
Sustainability Leadership, April 26 2024
Sustainability Leadership, April 26 2024Sustainability Leadership, April 26 2024
Sustainability Leadership, April 26 2024
 
Escort Service Call Girls In Shalimar Bagh, 99530°56974 Delhi NCR
Escort Service Call Girls In Shalimar Bagh, 99530°56974 Delhi NCREscort Service Call Girls In Shalimar Bagh, 99530°56974 Delhi NCR
Escort Service Call Girls In Shalimar Bagh, 99530°56974 Delhi NCR
 
Malad Escorts, (Pooja 09892124323), Malad Call Girls Service
Malad Escorts, (Pooja 09892124323), Malad Call Girls ServiceMalad Escorts, (Pooja 09892124323), Malad Call Girls Service
Malad Escorts, (Pooja 09892124323), Malad Call Girls Service
 
CALL ON ➥8923113531 🔝Call Girls Fazullaganj Lucknow best sexual service
CALL ON ➥8923113531 🔝Call Girls Fazullaganj Lucknow best sexual serviceCALL ON ➥8923113531 🔝Call Girls Fazullaganj Lucknow best sexual service
CALL ON ➥8923113531 🔝Call Girls Fazullaganj Lucknow best sexual service
 
Call Girl Kolkata Sia 🤌 8250192130 🚀 Vip Call Girls Kolkata
Call Girl Kolkata Sia 🤌  8250192130 🚀 Vip Call Girls KolkataCall Girl Kolkata Sia 🤌  8250192130 🚀 Vip Call Girls Kolkata
Call Girl Kolkata Sia 🤌 8250192130 🚀 Vip Call Girls Kolkata
 
Call Girls 🫤 East Of Kailash ➡️ 9999965857 ➡️ Delhi 🫦 Russian Escorts FULL ...
Call Girls 🫤 East Of Kailash ➡️ 9999965857  ➡️ Delhi 🫦  Russian Escorts FULL ...Call Girls 🫤 East Of Kailash ➡️ 9999965857  ➡️ Delhi 🫦  Russian Escorts FULL ...
Call Girls 🫤 East Of Kailash ➡️ 9999965857 ➡️ Delhi 🫦 Russian Escorts FULL ...
 

Volaris corporate presentation may 2016

  • 1. Volaris: the leading ultra-low-cost airline serving Mexico, USA and Central America May 2016
  • 2. The information ("Confidential Information") contained in this presentation is confidential and is provided by Controladora Vuela Compañía de Aviación, S.A.B. de C.V., (d/b/a Volaris, the "Company") confidentially to you solely for your reference and may not be retransmitted or distributed to any other persons for any purpose whatsoever. The Confidential Information is subject to change without notice, its accuracy is not guaranteed, it has not been independently verified and it may not contain all material information concerning the Company. Neither the Company, nor any of their respective directors makes any representation or warranty (express or implied) regarding, or assumes any responsibility or liability for, the accuracy or completeness of, or any errors or omissions in, any information or opinions contained herein. None of the Company nor any of their respective directors, officers, employees, stockholders or affiliates nor any other person accepts any liability (in negligence, or otherwise) whatsoever for any loss howsoever arising from any use of this presentation or its contents or otherwise arising in connection therewith. No reliance may be placed for any purposes whatsoever on the information set forth in this presentation or on its completeness. This presentation does not constitute or form part of any offer or invitation for sale or subscription of or solicitation or invitation of any offer to buy or subscribe for any securities, nor shall it or any part of it form the basis of or be relied on in connection with any contract or commitment whatsoever. Recipients of this presentation are not to construe the contents of this presentation as legal, tax or investment advice and should consult their own advisers in this regard. This presentation contains statements that constitute forward-looking statements which involve risks and uncertainties. These statements include descriptions regarding the intent, belief or current expectations of the Company or its officers with respect to the consolidated results of operations and financial condition, and future events and plans of the Company. These statements can be recognized by the use of words such as "expects," "plans," "will," "estimates," "projects," or words of similar meaning. Such forward-looking statements are not guarantees of future performance and actual results may differ significantly from those in the forward-looking statements as a result of various factors and assumptions. You are cautioned not to place undue reliance on these forward looking statements, which are based on the current view of the management of the Company on future events. The Company does not undertake to revise forward-looking statements to reflect future events or circumstances. Disclaimer 2
  • 3. Volaris, the lowest unit cost operator in the Americas : snapshot at 30,000 feet Serving 65 destinations throughout Mexico, USA and Central America Volaris’ destinations (1) Based on CASM among publicly traded carriers (2) Converted to USD at an average annual exchange rate Source: Company data 2008 2015 1Q 2016 2008- 2015 CAGR Unit cost (CASM ex-fuel; cents, USD)(2) 5.5 4.9 4.8 -1.6% Passenger demand (RPMs, bn) 3.2 11.6 3.3 +20.2% Aircraft (End of period) 21 56 59 +15.0% Routes (End of period) 42 148 150 +19.7% Passengers (mm) 3.5 12.0 3.4 +19.2% Operating revenue (bn, MXN) 4.4 18.2 5.2 +22.5% Adj. EBITDAR (bn. MXN) 0.7 6.5 2.2 +37.5% Adj. ROIC (pre- tax) 11% 22% 23% +11 pp. (1) 3 Portland Reno Sacramento San Francisco/OaklandSan Jose Fresno Ontario Los Angeles San Diego Las Vegas Phoenix Denver Dallas Houston San Antonio Chicago New York Orlando Fort Lauderdale Tijuana Mexicali La Paz Los Cabos Hermosillo Cd. Juarez Chihuahua Cd. Obregon MonterreyLos Mochis Torreon Culiacan Mazatlan Durango Tampico Zacatecas San Luis Aguascalientes Guadalajara Puerto Vallarta Leon Uruapan Morelia Queretaro Mex.City Toluca Veracruz Acapulco Huatulco Tapachula Puebla Oaxaca Tuxtla Villahermosa Chetumal Cancun Merida Guatemala San Jose, CR San Juan, PR Austin Seattle
  • 4. Volaris’ flight path for demand stimulation and continued growth Capacity increase Cost reduction “Clean”, low base fares More customers More ancillaries (“You decide”) Resilient ULCC business model driving high, profitable growth 4
  • 5. Volaris’ consistent execution of its ULCC business model well positioned for growth Diversified and resilient point-to-point network Diversified and resilient point-to-point network Successful price unbundlingSuccessful price unbundling Strong penetration of Mexican air travel market Strong penetration of Mexican air travel market Proven ancillary revenue modelProven ancillary revenue model Bus to air substitutionBus to air substitution Upside in ancillary revenueUpside in ancillary revenue Continue geographic diversification through international growth Continue geographic diversification through international growth Attractive emerging air travel market in Mexico Attractive emerging air travel market in Mexico Flexible fleet plan and utilization; capacity management Flexible fleet plan and utilization; capacity management Sustained profitability with strong balance sheet Sustained profitability with strong balance sheet Continue cost reductionsContinue cost reductions Continue route frequency increaseContinue route frequency increase OpportunitiesAccomplishments 5
  • 7. Volaris has a best-in-class unit cost structure Lowest unit cost in the Americas (1) CASM and CASM ex-fuel (1Q 2016, USD cents) (2) Cost structure 7 4.8 11.7 8.0 7.6 7.3 6.2 5.1 5.0 8.6 5.8 5.6 10.1 1.4 2.5 1.8 2.1 1.9 2.1 2.5 1.3 2.4 1.8 1.7 2.1 • Economies of scale - Dilute fixed costs - High seat density • Young and fuel efficient fleet - Sharklet rollout - Average age of 4.6 years (4) - Low fuel burn • Productive network - Point-to-point - No connections complexity • High aircraft utilization - On average 13.1 block hours a day during 1Q 2016 (1) Based on CASM among the publicly-traded airlines (2) Non-USD data converted to USD at an average exchange rate (3) DCOMPS= Direct Competitors: Average CASM and CASM ex-fuel; US network carriers include: Delta, United, Alaska Airlines and American Airlines (4) As of March 2016 Source: Company data, airlines public information Latin American carriers US LCCs US network carriers (3) Continued cost improvement potential In line with best-in-class ULCCs 6.2 14.2 9.8 9.8 9.2 8.3 7.6 11.0 7.6 7.3 12.2 6.2
  • 8. Volaris cost structure enables us to lower base fares and increase ancillaries Volaris TRASM is below most competitors CASM (1) TRASM and CASM (1Q 2016, USD cents) (2) 8 . Spirit Allegiant Gol Copa Interjet Latam Aeromexico Southwest US network carriers Avianca Volaris’ resilient ULCC model TRASM CASM CASM CASM CASM CASM CASM CASM CASM CASM CASM (3) 7.4 7.3 7.6 7.6 8.3 9.2 9.8 9.8 11.0 12.2 14.2 (1) Based on CASM and TRASM among the publicly-traded airlines (2) Non-USD data converted to USD at an average exchange rate (3) US network carriers direct competitors include: Delta, United, Alaska Airlines and American Airlines Source: Company data, airlines public information Overlap: 2 5 %
  • 9. 142 204 211 279 338 347 2011 2012 2013 2014 2015 LTM Mar 2016 Non-ticket revenue continue to grow, with upside potential (1) Converted using an average annual MXN/USD exchange rate (2) Mexican legislation does not allow to charge for the first bag (3) Wizz as of 4Q 2015 Source: Company data, airlines public information Non-ticket revenue per passenger Volaris(MXN) per passenger (2) Best-in class ULCCs, including first bag fee (2) (1Q 2016, USD per passenger) (1) 2009 – 2015 CAGR: +23.7% 2.4x Ancillaries • Apply revenue management techniques - Pricing by route, season, day - Fully dynamic pricing for some products • Add products - New products & services - Enhancements to existing products • Improve presence - More touch-points to sell ancillaries throughout the journey - Allow customization • Benefit from network diversification - More international capacity Increasing non-ticket revenue allows to reduce fare further and stimulate demand 9 21 43 53 57 Volaris Wizz Spirit Allegiant (3)
  • 10. Network enhancement: connecting the dots and diversifying further Source: Company data New routes Domestic International Cancun +2 +3 Guadalajara +4 Mexico City +3 Other +4 +3 Tijuana +1 Total +10 +10 New stations USA Mexico C. America Dallas Durango Guatemala City New York Chetumal San Jose, CR San Juan, PR Zihuatanejo In LTM March, Volaris diversified its network by opening 20 routes and 8 stations Volaris’ LTM new routes New International New Domestic 10
  • 11. …supporting strong capacity growth Joining existing airportsJoining existing airports Additional frequenciesAdditional frequencies New airportsNew airports 27.7% 0.2% 0.0% Total ASM growthTotal ASM growth 1Q 2016 capacity growth contribution (yoy) 27.9% Our network is well positioned for diversified growth = + + + 11 Source: Company data
  • 13. 24 38 18 26 6 12 2010 2011 2012 2013 2014 2015 LTM Mar 2016 Domestic USA Other international Yoy growth 3.3% 4.0% 8.3% 8.3% 8.3% 12.3% 13.0% GDP growth 5.1% 4.0% 3.8% 1.7% 2.1% 2.5% 2.4% GDP multiplier 0.6 1.0 2.2 5.0 3.9 4.9 5.4 In recent years, volume growth has been robust despite challenging economic environment (1) LTM March 2015 vs. LTM March 2016 growth (2) GDP growth expectations from Banxico April’s survey Source: DGAC-SCT; INEGI; Banco de México Mexico passenger market volume has increased since 2010 50 52 57 61 67 74 Passenger volume (millions) CAGR: 8.2% 13 77 (1) (2)
  • 14. (1) WB= wide body, NB= narrow body and RJ= regional jet (2) Only domestic market (3) Only Mexican carriers Source: DGAC, Diio Mi, Banco de México 2.8% 8.2% 8.8% 0% 1% 2% 3% 4% 5% 6% 7% 8% 9% 10% GDP Passengers RPMs …and supply has met the strong market demand DemandSupply (WB + NB + RJ) (1) 2.9x GDP 4.9% 6.5% 7.2% 0% 2% 4% 6% 8% 10% 12% Fleet seats Aircraft ASMs 2010-2015 Capacity growth (CAGR) 2010-2015 Demand growth (CAGR) (2) (2) 14 (3)
  • 15. (1) Minimum stage length of 170 miles (2) Minimum stage length of 200 miles; CAM stands for Central America; SAM stands for South America (3) South and northbound leisure routes (4) Figures calculated as of September 2015 (5) Data from ALTA Yearbook 2014 Source: Company data, SCT-DGAC and DIIO MI Market Intelligence for the Aviation Industry; ALTA 0 10 20 30 40 50 0 25 50 75 100 USA (Leisure) USA (VFR) CAM, SAM, Canada, Caribbean Significant untapped opportunities Domestic – growth potential of approx. 120 routes (4) International – growth potential of approx.130 routes (4) (3) Number of routes (1) Number of routes (2) Routes served Growth potential 15 In terms of air trips per capita Mexico has plenty potential to grow 2014 air trips per capita(5) 2.05 0.55 0.45 0.42 0.27 0.25 0.21 0.04 0.01 USA Chile Brazil Colombia Peru Mexico Argentina Costa Rica Paraguay
  • 16. 2012 2015 Exectutive and Luxury First, economy and other ULCC model First sell Trial Ticket giveaway #Nomáscamión Strong conversion rate Volaris contributed by stimulating demand from bus to air substitution Source: Company data, Secretaría de Comunicaciones y Transportes (SCT), Dec. 2014 Bus switching programSignificant upside for air travel Total air travel passengers in Mexico (mm) Total bus passengers in Mexico (mm) 2,758 33 Mass media campaigns Digital capabilities Attracting 1st time flyers 16 Education 2,918 2,683 2,834 74 79 28 37 27 38 2012 2015 Domestic International 55 75
  • 17. Drivers of continued profitable growth Uniquely positioned to capture growth in underpenetrated Mexican aviation market Reduce unit costs Fleet growth Expand network Increase total revenues • Deepen footprint in markets with high demand stimulation • Grow ancillary revenue to world class ULCC benchmarks • 58 additional aircraft to be delivered • Up-gauge fleet from A319 to A320/A321 • Higher seat density configuration • Expand network geographically Source: Company data • Neo incorporation - Fuel efficiency 17 • Price, product, presence
  • 19. 18 15 12 5 16 15 15 15 20 28 28 28 0 2 8 182 10 10 10 0 0 2 6 2015 2016E 2017E 2018E A319 A320 A320 w/sharklets A320 NEO w/sharklets A321 w/sharklets A321 NEO w/sharklets Fleet plan with flexibility that enables capacity management Projected fleet under current contracts (number of aircraft) (1) (1) Net fleet after additions and returns (2) Figure calculated as of March 2016 (3) Percentage of year-end seats with sharklets Source: Company data Backlog of 58 Aircraft to support growth (2)Backlog of 58 Aircraft to support growth (2) Seat growth % seats w/Sharklets (3) 18% 61% 20% 68% 11% 78% 70 75 82 56 2016-2018 PDPs fully financed First two A320neo 19
  • 20. 1,238 2,475 2,806 3,081 6,492 7,463 0 2,000 4,000 6,000 8,000 2011 2012 2013 2014 2015 LTM Mar 2016 (MXNmm) 8,879 11,686 13,002 14,037 18,180 19,593 0 5,000 10,000 15,000 20,000 25,000 2011 2012 2013 2014 2015 LTM Mar 2016 (MXNmm) Revenue CAGR 2011 - 2015 LTM March 2016 Adj. EBITDAR margin High growth and solid financial performance Revenue Adj. EBITDAR 20 20% CAGR 51% CAGR 34% 25% 23% 23% 23% 19% 18% 0% 20% 40% Latam Aeromexico Copa Interjet Avianca Gol 20% 16% 15% 14% 7% 7% 5% 0% 10% 20% Interjet Latam Avianca Aeromexico Gol Copa Source: Company data, airlines public information
  • 21. Strong balance sheet and liquidity, well funded for continued growth 21 (1) Figures converted to USD at March end of the period spot exchange rate $17.4015 for convenience purposes only Source: Company data, airlines public information • Unrestricted cash of $6.4 billion pesos (US$ 366 million(1)) as of March 31st 2016. • Net cash position of $5.3 billion pesos (US$ 303 million(1)) as of March 31st 2016. • Adjusted long term net debt to EBITDAR of 3.0x as of March 31st 2016. • Fully financed pre-delivery payments through 2018 and executed sale- leasebacks for 2016 deliveries. • Expected 2016 net CAPEX neutral (US$ 0 to -10 million): • PDPs: from US$ -50 to -45 million, net of PDP reimbursements (8 aircraft order book deliveries) • Major maintenance: US$ 25 to 35 million • Other: from US$ 10 to 15 million 2.8x 3.0x 4.8x 5.9x 6.6x 11.0x Copa Aeromexico LatAm Avianca Gol 33.2% 32.5% 18.2% 13.9% 11.7% 11.7% Copa Gol Latam Aeromexico Avianca Adj. net debt/EBITDAR LTM liquidity-cash and equivalents as a % of LTM Op. Revenue
  • 23. Fuel hedging position 23 (1) Approximate percentage of gallons hedged Period Total % hedged(1) Avg. price (gal/USD$) Instrument 2Q16 60% $1.95 Call 3Q16 60% $1.99 Call 4Q16 60% $1.99 Call 1Q17 50% $1.64 Call 2Q17 50% $1.61 Call 3Q17 50% $1.44 Call 4Q17 50% $1.40 Call 1Q18 20% $1.46 Call 2Q18 5% $1.40 Call
  • 24. (1) Full year 2015 figures converted to USD at December end of the period spot exchange rate $17.2065, respectively, for convenience purposes only. (2) 1Q 2016 figures converted to USD at March end of the period spot exchange rate $17.4015, respectively, for convenience purposes only. (3) Audited financial information 2013A – 2015A (4) Includes debt prepayment of Ps.570 million Source: Company data Consolidated statements of operations summary MXN millions unless otherwise stated (3) 2013A 2014A 2015A 2015A (1) 1Q 2016 1Q 2016(2) % of total operating revenues (USD millions) (USD millions) Passenger 11,117 11,303 14,130 821 3,906 224 75.4 Non-ticket 1,885 2,733 4,049 235 1,276 73 24.6 Total operating revenues 13,002 14,037 18,180 1,057 5,182 298 100 Fuel 5,086 5,364 4,721 274 1,013 58 19.6 Aircraft and engine rent expense 2,187 2,535 3,525 205 1,219 70 23.5 Landing, take off and navigation expenses 1,924 2,066 2,595 151 791 45 15.3 Salaries and benefits 1,563 1,577 1,903 111 564 32 10.9 Sales, marketing and distribution expenses 704 817 1,089 63 295 17 5.7 Maintenance expenses 572 665 875 51 340 20 6.6 Other operating expense, net 347 468 505 29 4 - 0.1 Depreciation and amortization 302 343 457 27 120 7 2.3 Total operating expenses 12,685 13,833 15,669 911 4,346 250 83.9 6 EBIT 317 204 2,510 146 836 48 16.1 Operating margin (%) 2.4 1.5 13.8 13.8 16.1 16.1 Finance income 25 23 47 3 34 2 0.7 Finance cost (126) (32) (22) (1) (7) - (0.1) Exchange gain, net 66 449 967 56 9 1 0.2 Income tax expense (18) (39) (1,038) (60) (270) (16) (5.2) Net income 265 (4) 605 2,464 143 602 35 11.6 Net margin (%) 2.0 4.3 13.6 13.6 11.6 11.6 Adjusted EBITDAR 2,806 3,081 6,492 377 2,175 125 42.0 Adj. EBITDAR margin (%) 21.6 22.0 35.7 35.7 42.0 42.0 EPS Basic and Diluted (Pesos) 0.31 0.60 2.43 0.14 0.59 0.03 EPADS Basic and Diluted (Pesos) 3.10 6.00 24.35 1.42 5.95 0.34 24
  • 25. Consolidated statements of financial position summary (1) Full year 2015 figures converted to USD at December end of the period spot exchange rate $17.2065 for convenience purposes only (2) 1Q 2016 figures converted to USD at March end of the period spot exchange rate $17.4015, respectively, for convenience purposes only. (3) Net debt = financial debt - cash and cash equivalents (4) Adjusted debt = (LTM aircraft rent expense x 7) + financial debt (5) Adjusted net debt = adjusted debt - cash and cash equivalents (6) Audited financial information 2013A – 2015A Source: Company data MXN millions unless otherwise stated (6) 2013A 2014A 2015A 2015A (1) 1Q 2016 1Q 2016 (2) (USD millions) (USD millions) Cash and cash equivalents 2,451 2,265 5,157 300 6,366 366 Current guarantee deposits 499 545 861 50 1,052 60 Other current assets 1,050 879 1,223 71 1,300 75 Total current assets 4,000 3,689 7,241 421 8,718 501 Rotable spare parts, furniture and equipment, net 1,341 2,223 2,550 148 2,187 126 Non-current guarantee deposits 2,603 3,541 4,704 273 4,703 270 Other non-current assets 434 452 765 44 996 57 Total assets 8,378 9,905 15,261 887 16,604 954 Unearned transportation revenue 1,393 1,421 1,957 114 2,558 147 Short-term financial debt 268 823 1,371 80 845 49 Other short-term liabilities 2,211 2,524 3,774 219 4,336 249 Total short-term liabilities 3,872 4,768 7,103 413 7,739 445 Long-term financial debt 294 425 220 13 256 15 Other long-term liabilities 250 242 1,113 65 1,126 65 Total liabilities 4,415 5,435 8,436 490 9,120 524 Total equity 3,962 4,470 6,825 397 7,484 430 Total liabilities and equity 8,378 9,905 15,261 877 16,604 954 Net debt (3) (1,888) (1,017) (3,566) (207) (5,265) (303) Adjusted debt (4) 15,874 18,990 26,268 1,527 29,028 1,668 Adjusted net debt (5) 13,423 16,725 21,111 1,227 22,662 1,302 25
  • 26. Consolidated statements of cash flows summary (1) Full year 2015 figures converted to USD at December end of the period spot exchange rate $17.2065 for convenience purposes only (2) 1Q 2016 figures converted to USD at March end of the period spot exchange rate $17.4015, respectively, for convenience purposes only. (3) Audited financial information 2013A - 2015A. (4) Includes debt prepayment premium Source: Company data MXN millions unless otherwise stated (3) 2013A 2014A 2015A 2015A (1) 1Q 2016 1Q 2016(2) (USD millions) (USD millions) Cash flow from operating activities Income before income tax 283 644 3,502 204 872 50 Depreciation and amortization 302 343 457 27 120 7 Guarantee deposits (620) (695) (1,165) (68) (319) (18) Unearned transportation revenue 135 27 536 31 600 35 Changes in working capital and provisions (61) 14 (261) (15) 56 3 Net cash flows provided by operating activities 39 334 3,070 178 1,329 77 Cash flow from investing activities Acquisitions of rotable spare parts, furniture, equipment and intangible assets (1,161) (1,603) (1,456) (85) (207) (12) Pre-delivery payments reimbursements 698 396 670 39 446 26 Proceeds from disposals of rotable spare parts, furniture and equipment 151 22 185 11 197 11 Net cash flows (used in) provided by investing activities (312) (1,185) (601) (35) 435 25 Cash flow from financing activities Payments of Treasury Shares - (7) - - - - Net proceeds from initial public offering 2,578 - - - - - Transaction costs on issue of shares (38) - - - - - Proceeds from exercised treasury shares 26 - 23 1 - - Interest paid (65) (23) (42) (2) (13) (1) Other finance costs - (11) (40) (2) - - Payments of financial debt (1,084) (4) (400) (801) (47) (570) (33) Proceeds from financial debt 444 966 925 54 35 2 Net cash flows provided by (used in) financing activities 1,861 525 65 4 (549) (32) Increase (decrease) in cash and cash equivalents 1,587 (326) 2,533 147 1,216 70 Net foreign exchange differences 41 141 359 21 (7) - Cash and cash equivalents at beginning of period 822 2,451 2,265 132 5,157 296 Cash and cash equivalents at end of period 2,451 2,265 5,157 300 6,366 366 26
  • 27. Adj. EBITDA and Adj. EBITDAR reconciliation (1) Full year 2015 figures converted to USD at December end of the period spot exchange rate $17.2065 for convenience purposes only (2) 1Q 2016 figures converted to USD at March end of the period spot exchange rate $17.4015, respectively, for convenience purposes only. (3) Audited financial information 2013A - 2015A Source: Company data MXN millions unless otherwise stated (3) 2013A 2014A 2015A 2015A (1) 1Q 2016 1Q 2016 (2) (USD millions) (USD millions) Net income 265 605 2,464 143 602 35 Plus (minus): Finance costs 126 32 22 1 7 - Finance income (25) (23) (47) (3) (34) (2) (Benefit)/provision for income taxes 18 39 1,038 60 270 16 Depreciation and amortization 302 343 457 27 120 7 EBITDA 685 995 3,934 229 965 56 Exchange (gain) loss, net (66) (449) (967) (56) (9) (1) Adjusted EBITDA 619 547 2,967 172 956 55 Aircraft and engine rent expense 2,187 2,535 3,525 205 1,219 70 Adjusted EBITDAR 2,806 3,081 6,492 377 2,175 125 27