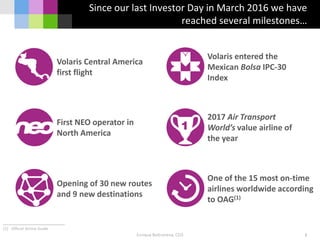
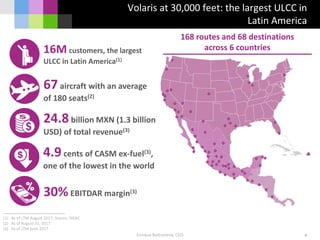
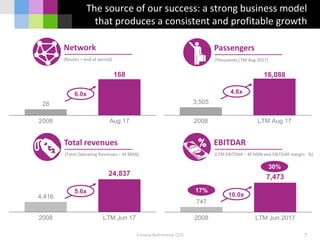
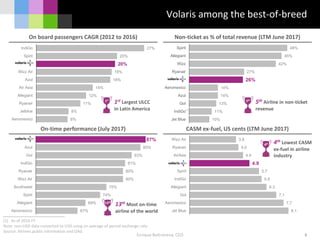
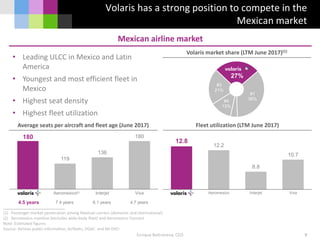
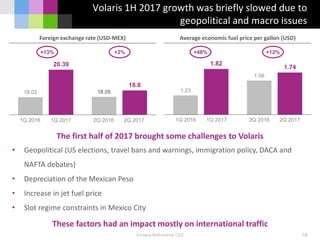
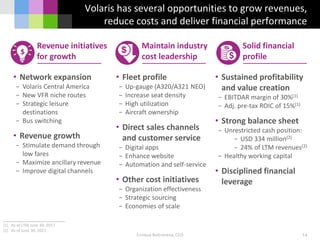
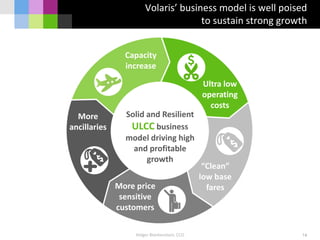
Volaris held an investor day on September 13, 2017 at the New York Stock Exchange to provide updates. Enrique Beltranena, the CEO, discussed how Volaris has achieved several milestones in becoming the largest ULCC in Latin America with 16 million customers annually and $1.3 billion in revenue. However, geopolitical factors in the first half of 2017 slowed some growth. Beltranena outlined opportunities for continued revenue growth and cost reductions through fleet optimization, direct sales channels, and other initiatives to maintain Volaris' leadership position.