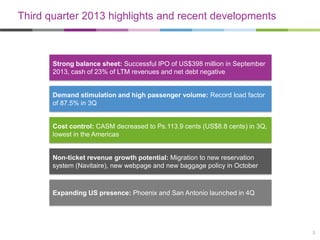
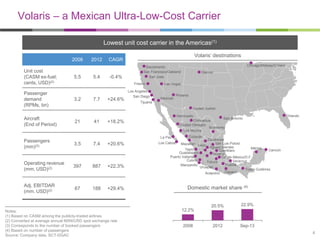
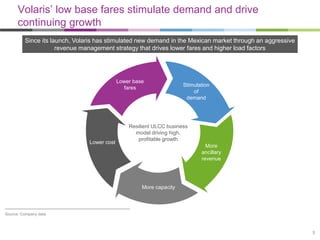
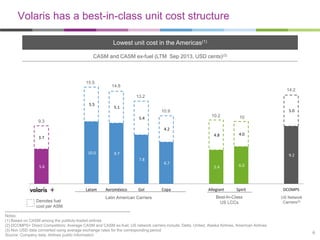
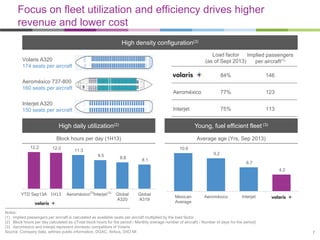
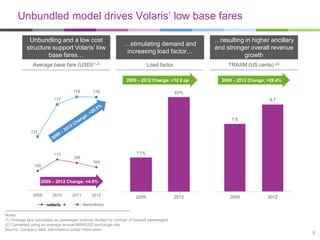
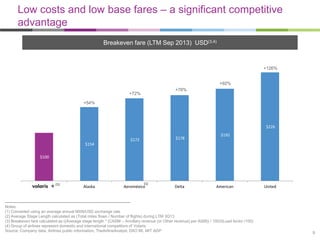
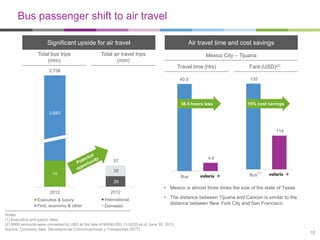
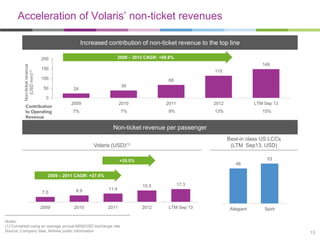
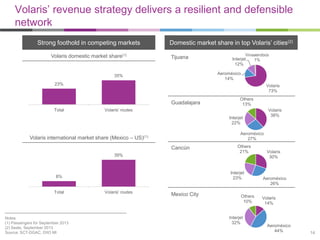
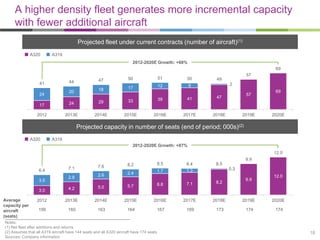
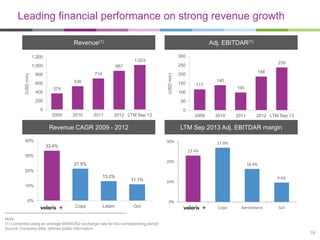
2. Disclaimer
The information ("Confidential Information") contained in this presentation is confidential and is provided by Controladora
Vuela Compañía de Aviación, S.A.B. de C.V., (d/b/a Volaris, the "Company") confidentially to you solely for your reference
and may not be retransmitted or distributed to any other persons for any purpose whatsoever. The Confidential Information
is subject to change without notice, its accuracy is not guaranteed, it has not been independently verified and it may not
contain all material information concerning the Company. The Company, nor any of their respective directors makes any
representation or warranty (express or implied) regarding, or assumes any responsibility or liability for, the accuracy or
completeness of, or any errors or omissions in, any information or opinions contained herein. None of the Company or any
of their respective directors, officers, employees, stockholders or affiliates nor any other person accepts any liability (in
negligence, or otherwise) whatsoever for any loss howsoever arising from any use of this presentation or its contents or
otherwise arising in connection therewith. No reliance may be placed for any purposes whatsoever on the information set
forth in this presentation or on its completeness.
This presentation does not constitute or form part of any offer or invitation for sale or subscription of or solicitation or
invitation of any offer to buy or subscribe for any securities, nor shall it or any part of it form the basis of or be relied on in
connection with any contract or commitment whatsoever. Recipients of this presentation are not to construe the contents of
this presentation as legal, tax or investment advice and should consult their own advisers in this regard.
This presentation contains statements that constitute forward-looking statements which involve risks and uncertainties.
These statements include descriptions regarding the intent, belief or current expectations of the Company or its officers with
respect to the consolidated results of operations and financial condition, and future events and plans of the Company. These
statements can be recognized by the use of words such as "expects," "plans," "will," "estimates," "projects," or words of
similar meaning. Such forward-looking statements are not guarantees of future performance and actual results may differ
significantly from those in the forward-looking statements as a result of various factors and assumptions. You are cautioned
not to place undue reliance on these forward looking statements, which are based on the current view of the management of
the Company on future events. The Company does not undertake to revise forward-looking statements to reflect future
events or circumstances.
2
3. Third quarter 2013 highlights and recent developments
Strong balance sheet: Successful IPO of US$398 million in September
2013, cash of 23% of LTM revenues and net debt negative
Demand stimulation and high passenger volume: Record load factor
of 87.5% in 3Q
Cost control: CASM decreased to Ps.113.9 cents (US$8.8 cents) in 3Q,
lowest in the Americas
Non-ticket revenue growth potential: Migration to new reservation
system (Navitaire), new webpage and new baggage policy in October
Expanding US presence: Phoenix and San Antonio launched in 4Q
3
4. Volaris – a Mexican Ultra-Low-Cost Carrier
Lowest unit cost carrier in the Americas(1)
2008
Unit cost
(CASM ex-fuel;
cents, USD)(2)
Passenger
demand
(RPMs, bn)
Aircraft
(End of Period)
5.5
2012
5.4
Volaris’ destinations
CAGR
-0.4%
Fresno
3.2
7.7
+24.6%
Chicago/Midway/O’Hare
Sacramento
San Francisco/Oakland
San Jose
Los Angeles
San Diego
Denver
Las Vegas
Mexicali
Phoenix
Tijuana
Ciudad Juarez
21
41
Hermosillo
San Antonio
Chihuahua
Ciudad Obregón
Monterrey
Los Mochis
+18.2%
La Paz
Passengers
(mm)(3)
3.5
7.4
+20.6%
Operating revenue
(mm, USD)(2)
397
887
+22.3%
Adj. EBITDAR
(mm. USD)(2)
67
188
+29.4%
Notes:
(1) Based on CASM among the publicly-traded airlines
(2) Converted at average annual MXN/USD spot exchange rate
(3) Corresponds to the number of booked passengers
(4) Based on number of passengers
Source: Company data, SCT-DGAC
Orlando
Culiacán
Zacatecas
San Luis Potosí
Mazatlán León
Aguascalientes
Mérida
Tepic
Cancún
Querétaro
Guadalajara
Morelia
Puerto Vallarta
Cd. de México/D.F.
Colima
Veracruz
Toluca
Puebla
Manzanillo
Uruapan
Tuxtla Gutiérrez
Acapulco Oaxaca
Los Cabos
Domestic market share (4)
12.2%
2008
20.5%
22.9%
2012
Sep-13
4
5. Volaris’ low base fares stimulate demand and drive
continuing growth
Since its launch, Volaris has stimulated new demand in the Mexican market through an aggressive
revenue management strategy that drives lower fares and higher load factors
Lower base
fares
Lower cost
Stimulation
of
demand
Resilient ULCC business
model driving high,
profitable growth
More
ancillary
revenue
More capacity
Source: Company data
5
6. Volaris has a best-in-class unit cost structure
Lowest unit cost in the Americas(1)
CASM and CASM ex-fuel (LTM Sep 2013, USD cents)(3)
15.5
14.8
14.2
13.2
5.5
5.1
5.0
10.9
10.2
4.8
5.4
9.3
10
4.0
4.2
3.7
10.0
9.7
7.8
5.6
Volaris
Denotes fuel
cost per ASM
Latam
Aeroméxico
Gol
Latin American Carriers
9.2
6.7
Copa
5.4
6.0
Allegiant
Spirit
Best-In-Class
US LCCs
Notes:
(1) Based on CASM among the publicly-traded airlines
(2) DCOMPS= Direct Competitors: Average CASM and CASM ex-fuel; US network carriers include: Delta, United, Alaska Airlines, American Airlines
(3) Non USD data converted using average exchange rates for the corresponding period
Source: Company data, Airlines public information
DCOMPS
US Network
Carriers(2)
6
7. Focus on fleet utilization and efficiency drives higher
revenue and lower cost
High density configuration(3)
Load factor
Implied passengers
(as of Sept 2013)
per aircraft(1)
Volaris A320
174 seats per aircraft
84%
77%
123
Interjet
Interjet A320
150 seats per aircraft
146
Aeroméxico
Aeroméxico 737-800
160 seats per aircraft
75%
113
High daily utilization(2)
Block hours per day (1H13)
12.2
Young, fuel efficient fleet (3)
Average age (Yrs, Sep 2013)
12.0
10.6
11.3
9.5
8.8
9.2
8.1
6.7
4.2
YTD Sep13A 1H13
Aeroméxico(3)Interjet (3)
Global
A320
Global
A319
Mexican
Average
Aeroméxico
Interjet
Notes:
(1) Implied passengers per aircraft is calculated as available seats per aircraft multiplied by the load factor
(2) Block hours per day calculated as ((Total block hours for the period / Monthly average number of aircraft) / Number of days for the period)
(3) Aeroméxico and Interjet represent domestic competitors of Volaris
Source: Company data, airlines public information, DGAC, Airbus, DIIO MI
7
8. Unbundled model drives Volaris’ low base fares
Unbundling and a low cost
structure support Volaris’ low
base fares…
…stimulating demand and
increasing load factor…
…resulting in higher ancillary
and stronger overall revenue
growth
Average base fare (USD)(1,2)
Load factor
TRASM (US cents) (2)
2009 – 2012 Change: +12.0 pp
179
178
2009 – 2012 Change: +28.4%
83%
171
9.7
7.6
137
113
71%
109
104
100
2009 – 2012 Change: +4.0%
2009
2010
2011
2012
2009
2012
2009
2012
Aeroméxico
Notes:
(1) Average fare calculated as passenger revenue divided by number of booked passengers
(2) Converted using an average annual MXN/USD exchange rate
Source: Company data, Aeromexico public information
8
9. Low costs and low base fares – a significant competitive
advantage
Breakeven fare (LTM Sep 2013) USD(3,4)
% Above Volaris
+126%
+92%
+78%
+72%
+54%
$226
$154
$178
$172
$192
$100
Volaris
(1)
Alaska
(1)
Aeroméxico
Delta
American
Notes:
(1) Converted using an average annual MXN/USD exchange rate
(2) Average Stage Length calculated as (Total miles flown / Number of flights) during LTM 3Q13
(3) Breakeven fare calculated as ((Average stage length * (CASM – Ancillary revenue (or Other revenue) per ASM)) / 100)/(Load factor /100)
(4) Group of airlines represent domestic and international competitors of Volaris
Source: Company data, Airlines public information, TheAirlineAnalyst. DIIO MI, MIT ADP
United
9
10. Bus passenger shift to air travel
Significant upside for air travel
Total bus trips
(mm)
Air travel time and cost savings
Total air travel trips
(mm)
Mexico City – Tijuana
Travel time (Hrs)
2,758
Fare (USD)(2)
135
40.5
36.5 hours less
15% cost savings
2,683
114
4.0
57
74
28
Bus
74
2012
Bus
(1)
Volaris
29
2012
Air
Executive & luxury
First, economy & other
• Mexico is almost three times the size of the state of Texas
International
Domestic
• The distance between Tijuana and Cancún is similar to the
distance between New York City and San Francisco
Notes:
(1) Executive and luxury class
(2) MXN amounts were converted to USD at the rate of MXN/USD 13.0235 as of June 30, 2013
Source: Company data, Secretaría de Comunicaciones y Transportes (SCT)
10
11. Rapidly expanding share in core markets
Stimulation of growth through our ULCC model
Passenger volume growth: 2011 vs. 2012
Volaris focus cities – Domestic market
2x
6x
2x
International market
5x
2x
13x
4x
65%
186%
147%
45%
33%
7%
15%
Tijuana
25%
69%
38%
13%
6%
Guadalajara
Cancun
Mexico City
Airport
46%
11%
Morelia
Mexico City
Aguascalientes
Volaris
A significant portion of our capacity faces no competition
Percentage of Volaris’ domestic capacity(1) competing with:
73%
55%
35%
22%
Aeroméxico
Interjet
Vivaaerobús
Non-competed
Notes:
(1) Offered seats for 4Q 2013
Source: SCT-DGAC, DIIO MI
11
12. Unbundled strategy: “Tú decides” – You decide
Pre-flight
Flight
planning
At the
airport
• V-Club
subscription
• Seat
assignment
• Excess
baggage
• Co-branded
credit cards
• Change /
booking fees
• Priority
boarding
• V-Shop
• Insurance
• Strollers
Onboard
aircraft
• Advertising
• Food and
beverage(1)
Post-flight
• Hotel
rooms
• Car rentals
• Airport
shuttle
Notes:
(1) In process of implementation
Source: Company data
12
13. Acceleration of Volaris’ non-ticket revenues
Increased contribution of non-ticket revenue to the top line
2009 – 2012 CAGR: +68.6%
Non-ticket revenue
(USD mm)(1)
200
149
150
115
100
50
68
39
24
0
Contribution
to Operating
Revenue
2009
2010
2011
2012
LTM Sep 13
7%
7%
9%
13%
15%
Non-ticket revenue per passenger
Best-in class US LCCs
(LTM Sep13, USD)
Volaris (USD)(1)
53
+35.5%
46
2009 – 2011 CAGR: +27.6%
7.0
8.9
11.4
2009
2010
2011
Notes:
(1) Converted using an average annual MXN/USD exchange rate
Source: Company data, Airlines public information
15.5
17.3
2012
LTM Sep 13
Allegiant
Spirit
13
14. Volaris’ revenue strategy delivers a resilient and defensible
network
Strong foothold in competing markets
Volaris domestic market share(1)
Domestic market share in top Volaris’ cities(2)
Tijuana
Vivaaerobús
Interjet
1%
12%
Aeroméxico
14%
35%
23%
Volaris
73%
Guadalajara
Total
Others
13%
Volaris' routes
Volaris
38%
Interjet
22%
Aeroméxico
27%
Volaris international market share (Mexico – US)(1)
Cancún
39%
Interjet
23%
8%
Total
Notes:
(1) Passengers for September 2013
(2) Seats, September 2013
Source: SCT-DGAC, DIIO MI
Others
21%
Volaris' routes
Mexico City
Others
10%
Interjet
32%
Volaris
30%
Aeroméxico
26%
Volaris
14%
Aeroméxico
44%
14
15. Substantial growth opportunity in the US-Mexico VFR /
leisure travel market
San
Francisco
0.7mm
Bakersfield
0.4mm
Sacramento
0.3mm
Fresno
0.5mm
Las Vegas
0.4mm
San Jose
0.4mm
Albuquerque
0.2mm
Phoenix
1.2mm
Los Angeles
4.6mm
Tucson
0.3mm
San
Diego
0.9mm
San
Bernardino
1.7mm
Chicago
1.5mm
Denver
0.5mm
Austin
0.4mm
El Paso
0.6mm
Washington
0.1mm
Dallas
1.5mm
San Antonio
0.9mm
New York
0.5mm
Philadelphia
0.1mm
Atlanta
0.3mm
Houston
1.5mm
Mission
0.6mm
Orlando
0.1mm
Tampa
0.1mm
San Benito
0.3mm
Denotes Volaris
presence(1)
Denotes other cities with large
Mexican origin populations(1,2)
Notes:
(1) Represents Mexican origin population figures as per population data released on May 26, 2011
(2) Mexican origin is based on self-described ancestry, lineage, heritage, nationality group or country of birth.
Source: Pew Research Hispanic Center
Significant Mexican origin
population(2) of 33.5 million
in the US
15
16. Attractive growth opportunities in Mexico and
throughout the Americas
Domestic – growth potential of nearly 180
routes
International – growth potential of about 150
routes
Number of routes(1)
Number of routes(2)
100
90
90
80
80
70
70
60
99
100
60
50
48
48
41
40
48
50
40
38
40
32
30
20
30
13
13
13
20
10
10
0
0
USA (Leisure)
Routes served
(3)
USA (VFR)
CAM, SAM,
Canada,
Caribbean
Growth potential
Notes:
(1) Minimum stage length of 170 miles
(2) Minimum stage length of 200 miles; CAM stands for Central America; SAM stands for South America
(3) South and northbound leisure routes
Source: Company data
16
18. A higher density fleet generates more incremental capacity
with fewer additional aircraft
Projected fleet under current contracts (number of aircraft)(1)
A320
A319
2012-2020E Growth: +68%
XXX
69
44
41
24
47
20
XXX
18
51
17
50
12
50
57
9
49
2
29
39
41
24
33
17
2012
2013E
2014E
2015E
2016E
2017E
57
47
2018E
2019E
69
2020E
Projected capacity in number of seats (end of period; 000s)(2)
A320
A319
2012-2020E Growth: +87%
XXX
12.0
9.9
XXX
6.4
3.5
7.1
2.9
7.6
8.2
8.5
1.7
2.6
2.4
8.4
1.3
8.5
0.3
9.9
12.0
7.1
3.0
Average
capacity per
aircraft
(seats)
5.7
8.2
5.0
6.8
4.2
2012
2013E
2014E
2015E
2016E
2017E
2018E
2019E
2020E
156
160
163
164
167
169
173
174
174
Notes:
(1) Net fleet after additions and returns
(2) Assumes that all A319 aircraft have 144 seats and all A320 aircraft have 174 seats
Sources: Company information
18
19. Leading financial performance on strong revenue growth
Revenue(1)
Adj. EBITDAR(1)
300
1,200
1,023
714
800
536
600
400
239
250
887
(USD mm)
(USD mm)
1,000
374
200
188
200
150
140
117
100
100
50
0
0
2009
2010
2011
2012 LTM Sep 13
2009
Revenue CAGR 2009 - 2012
2010
2011
2012 LTM Sep 13
LTM Sep 2013 Adj. EBITDAR margin
40%
30%
27.0%
33.4%
23.4%
30%
20%
21.5%
16.4%
20%
13.2%
11.1%
10%
0%
9.6%
10%
0%
Volaris
Copa
Latam
Gol
Copa
Aeroméxico
Gol
Note:
(1) Converted using an average MXN/USD exchange rate for the corresponding period
Source: Company data, airlines public information
19
20. Poised for future value creation
Sep YTD Sep YTD
‘12
‘13
Change
(YoY)
Continue growth in available seats
with a highly efficient fleet
• Switch from A319 to A320
TRASM
(cents, USD) (1)
9.5
9.7
3%
• Sharklet and NEO technology
• Maintain high utilization
CASM
(cents, USD) (1)
9.2
9.2
0%
Operating revenue
(mm, USD) (1)
640
774
21%
Adj. EBITDAR
(mm, USD) (1)
132
183
39%
Adj. EBITDAR
margin
21%
24%
3pp
Continue growth in our non-ticket
revenues
Maintain cost discipline
Continue to align employee
incentives
Focus on shareholder return
Notes;
(1) MXN amounts were converted to USD at the avg. rate of MXN/USD 13.24 as of Sep 30 2012 and at the avg. rate of MXN/USD 12.68 as of Sep 30, 2013
Source: Company data
20
21. Balance sheet well positioned for growth
• IPO provided sufficient liquidity / capital
LTM Sep 2013 Liquidity – Cash and
Equivalents / Op. Revenue
for growth over the next years
38.8%
• Minimal on-balance sheet debt
• $31mm(1) of debt after the IPO and
29.8%
debt payment
22.8%
• Strong cash position
• $229mm of cash and equivalents
as of September 2013
7.7%
• Fully financed fleet order through the
second quarter of 2016
Copa
Gol
Latam
Note:
(1) Principal + interest debt
Source: Company data, Airlines public information
21
23. Non-IFRS Terms Glossary
• Available seat miles (ASMs): Number of seats available for passengers multiplied by the number of miles the seats are flown.
• Block hours: Number of hours during which the aircraft is in revenue service, measured from the time it leaves the gate until the
time it arrives to the gate at destination.
• Revenue passenger miles (RPMs): Means the number of miles flown by passengers.
• TRASM: Total revenue divided by ASMs.
• RASM: Passenger revenue divided by ASMs.
• CASM: Total operating expenses, net divided by ASMs.
• CASM ex fuel: Total operating expenses, net excluding fuel expense divided by ASMs.
• Load factor: RPMs divided by ASMs and expressed as a percentage.
• EBITDA: Earnings before interest, taxes, depreciation and amortization.
• EBITDAR: Earnings before interest, taxes, depreciation, amortization and aircraft rent expense.
• Adj. EBITDAR: EBITDAR adjusted by non-cash and non-recurring items.
• Adj. Debt: Financial debt plus seven times the aircraft rent expense.
• Adj. Net debt: Adj. Debt minus cash and cash equivalents.
• VFR: Passengers who are visiting friends and relatives.
23
24. Consolidated statements of operations summary
MXN millions unless otherwise stated(2)
2010A
2011A(3)
2012A
3Q 2013A
September September YTD
YTD 2013A
2013A(1)
(USD
millions)
8,385
644
1434
110
9,819
755
% of total
operating
revenues
Passenger
Non-ticket
Total operating revenues
6,278
499
6,777
8,036
842
8,878
10,177
1,510
11,687
3,219
502.871
3,722
Fuel
Aircraft and engines rent expense
Salaries and benefits
Landing, take off and navigation expenses
Sales, marketing and distribution expenses
Maintenance expenses
Other operating expense
Depreciation and amortization
Total operating expenses
2,146
1,197
852
868
615
276
255
57
6,266
3,823
1,508
1,120
1,282
750
380
285
103
9,251
4,730
1,886
1,303
1,640
752
499
288
211
11,309
1,400
562
397
498
179
138
93
81
3,348
3,716
1,592
1144
1417
525
430
264
216
9,305
286
122
88
109
40
33
20
17
715
37.8
16.2
11.6
14.4
5.4
4.4
2.7
2.2
94.8
EBIT
Operating margin (%)
511
7.5
(373)
(4.2)
378
3.2
374
10.0
514
5.2
40
5.2
5.2
Finance income
Finance cost
Exchange (loss) gain, net
Taxes on profits
5
(56)
(56)
239
6
(58)
110
0
14
(90)
(95)
(3)
7
(84)
26
(69)
19
(120)
46
(97)
1
(9)
4
(7)
0.2
(1.2)
0.5
(1.0)
Net income (loss)
Net margin (%)
Net income (loss) excluding special items (4)
643
9.5
643
(315)
(3.6)
(315)
203
1.7
203
254
6.8
320
362
3.7
428
28
3.7
33
3.7
1,770
26.1
1,238
13.9
2,475
21.2
1016
27.3
2,322
23.7
178
23.7
23.7
Adjusted EBITDAR
Adj. EBITDAR margin (%)
EPS Basic (cents)
30.2
44.4
301.6
444.2
4.4
3.4
EPADS Basic (cents)
85.4
14.6
100.0
34.1
Notes:
(1) MXN amounts were converted to USD at the rate of MXN/USD 13.0119 as of Sep 30, 2013
(2) Financial information 2010-2012 audited; 2013 unaudited
(3) Financial statements restated
(4) Special items includes debt prepayment penalty by Ps.65 million
Source: Company data
24
25. Consolidated statements of financial position summary
MXN millions unless otherwise stated(5)
2010A
2011A(6)
2012A(6)
September
2013 A
September
2013A
Cash and cash equivalents
Current guarantee deposits
Other current assets
Total current assets
677
330
390
1,397
441
170
520
1,131
822
238
755
1,815
2,974
406
1,176
4,555
(USD millions)
229
31
90
350
Rotable spare parts, furniture and equipment, net
Non-current guarantee deposits
Other non-current assets
Total assets
Unearned transportation revenue
Short-term financial debt
Other short-term liabilities
Total short-term liabilities
Long-term financial debt
Other long-term liabilities
Total liabilities
921
1,041
342
3,701
505
251
1,171
1,927
384
164
2,475
1,517
2,002
412
5,062
825
687
1,667
3,179
725
298
4,202
1,195
2,245
447
5,702
1,259
527
1,936
3,722
633
272
4,627
1,062
2,445
390
8,452
1,513
134
2,146
3,794
275
249
4,318
82
188
30
650
116
10
165
292
21
19
332
Total equity
1,226
860
1,075
4,135
318
Total liabilities and equity
3,701
5,062
5,702
8,452
650
(42)
971
338
(2,565)
(197)
2.1%
2.1%
Net debt(2)
Total debt / Total capitalization(7)
Adjusted debt(3)
9,014
11,969
14,360
14,961
1,150
Adjusted net debt(4)
8,337
11,528
13,538
11,987
921
Nota:
(1) MXN amounts were converted to MXN/USD 13.019 as of Sep 30, 2013
(2) Net debt = financial debt - cash and cash equivalents
(3) Adjusted debt = (LTM aircraft rent expense x 7) + financial debt
(4) Adjusted net debt = adjusted debt - cash and cash equivalents
(5) Financial information 2010-2012 audited; 2013 unaudited
(6) Financial statements restated
(7) Total Capitalization = Total Debt + Equity @ Market Value
Source: Company data
25
26. Consolidated statements of cash flows summary
Sept YTD
2013A
Sept YTD
2013A(1)
(USD millions)
MXN millions unless otherwise stated(2)
2010A
2011A(3)
2012A
Cash flow from operating activities
Income (loss) before income tax
Depreciation and amortization
Guarantee deposits
Unearned transportation revenue
Changes in working capital and provisions
404
62
(316)
207
182
(315)
103
(801)
321
544
207
211
(311)
433
(43)
459
216
(368)
255
(128)
35
17
(28)
20
(10)
539
(148)
497
434
33
(321)
(1215)
(856)
(743)
(57)
-
587
1043
719
55
(321)
(628)
187
(24)
(2)
Cash flow from financing activities
Legal costs incurred on behalf of shareholders
Interest paid
Payments of financial debt
Proceeds from financial debt
(76)
(60)
46
(55)
(261)
879
(127)
(694)
550
(62)
(1236)
3004
(5)
(95)
231
Net cash flows (used in) provided by financing activities
(90)
562
(272)
1706
131
Increase (decrease) in cash and cash equivalents
Net foreign exchange differences
Cash and cash equivalents at beginning of period
Cash and cash equivalents at end of period
128
(25)
575
677
(213)
(22)
677
441
412
(31)
441
822
2116
35
822
2974
163
3
63
229
Net cash flows provided by (used in) operating activities
Cash flow from investing activities
Acquisitions of rotable spare parts, furniture, equipment and
intangible assets
Proceeds from disposals of rotable spare parts, furniture and
equipment
Net cash flows (used in) provided by investing activities
Notes:
(1) MXN amounts were converted to USD at the rate MXN/USD13.0119 as of September 30, 2013
(2) Financial information 2010-2012 audited; 2013 unaudited
(3) Financial statements restated
Source: Company data
26
27. Adj. EBITDA and Adj. EBITDAR reconciliation
MXN millions unless otherwise stated(2)
2010A
2011A(3)
2012A
3Q 2013A
Sept YTD
2013A
SEPT 2013
2013A(1)
(USD millions)
643
(315)
204
253
362
28
52
(5)
(239)
57
5
513
58
(6)
0
103
(160)
90
(14)
3
211
494
(84)
6
(69)
81
187
120
(19)
97
216
776
9
(1)
7
17
60
Exchange (gain) loss, net
Other financing cost (income), net
Adjusted EBITDA
56
3
573
(110)
(270)
95
589
(26)
161
(46)
730
(4)
56
Aircraft and engines rent expense
Adjusted EBITDAR
1,197
1,770
1,508
1,238
1,886
2,475
562
723
1592
2,322
122
178
Net income (loss)
Plus (minus):
Finance costs
Finance income
(Benefit)/provision for income taxes
Depreciation and amortization
Business alliance amortization
EBITDA
Notes:
(1) MXN amounts were converted to USD at the rate of MXN/USD13.0119 as of September 30, 2013
(2) Financial information 2010-2012 audited; 2013 unaudited
(3) Financial statements restated
Source: Company data
27