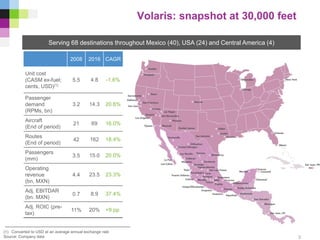
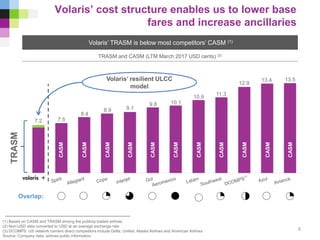
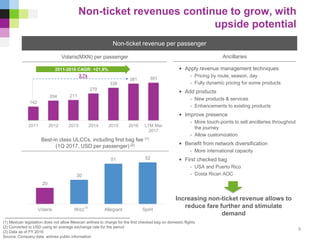
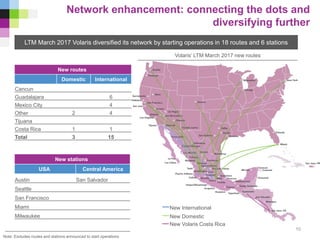
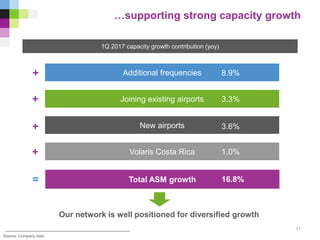
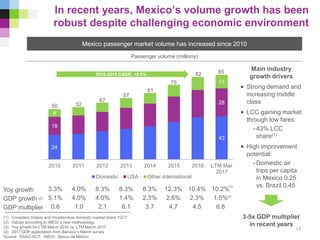
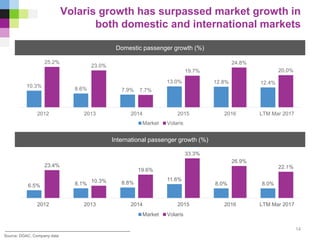
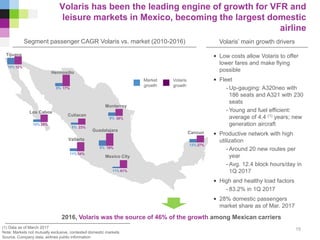
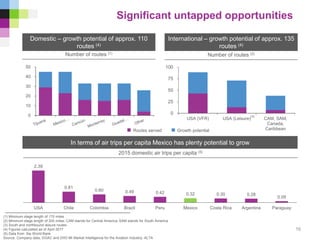
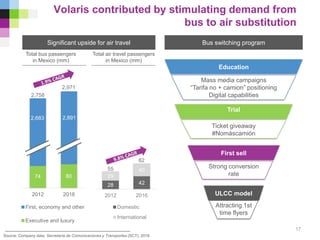
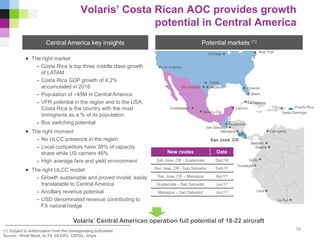
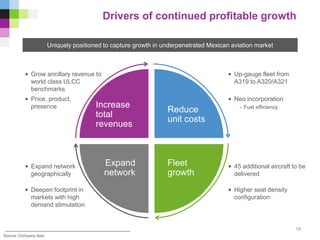
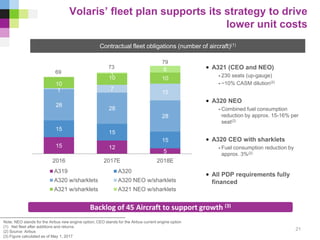
SlideShare a Scribd company logo
Volaris: the leading ultra-low-cost airline
serving Mexico, USA and Central America
May 2017
The information ("Confidential Information") contained in this presentation is confidential and is provided by
Controladora Vuela Compañía de Aviación, S.A.B. de C.V., (d/b/a Volaris, the "Company") confidentially to you solely
for your reference and may not be retransmitted or distributed to any other persons for any purpose whatsoever.
The Confidential Information is subject to change without notice, its accuracy is not guaranteed, it has not been
independently verified and it may not contain all material information concerning the Company. Neither the Company,
nor any of their respective directors makes any representation or warranty (express or implied) regarding, or
assumes any responsibility or liability for, the accuracy or completeness of, or any errors or omissions in, any
information or opinions contained herein. None of the Company nor any of their respective directors, officers,
employees, stockholders or affiliates nor any other person accepts any liability (in negligence, or otherwise)
whatsoever for any loss howsoever arising from any use of this presentation or its contents or otherwise arising in
connection therewith. No reliance may be placed for any purposes whatsoever on the information set forth in this
presentation or on its completeness.
This presentation does not constitute or form part of any offer or invitation for sale or subscription of or solicitation or
invitation of any offer to buy or subscribe for any securities, nor shall it or any part of it form the basis of or be relied
on in connection with any contract or commitment whatsoever. Recipients of this presentation are not to construe the
contents of this presentation as legal, tax or investment advice and should consult their own advisers in this regard.
This presentation contains statements that constitute forward-looking statements which involve risks and
uncertainties. These statements include descriptions regarding the intent, belief or current expectations of the
Company or its officers with respect to the consolidated results of operations and financial condition, and future
events and plans of the Company. These statements can be recognized by the use of words such as "expects,"
"plans," "will," "estimates," "projects," or words of similar meaning. Such forward-looking statements are not
guarantees of future performance and actual results may differ significantly from those in the forward-looking
statements as a result of various factors and assumptions. You are cautioned not to place undue reliance on these
forward looking statements, which are based on the current view of the management of the Company on future
events. The Company does not undertake to revise forward-looking statements to reflect future events or
circumstances.
Disclaimer
2
Serving 68 destinations throughout Mexico (40), USA (24) and Central America (4)
(1) Converted to USD at an average annual exchange rate
Source: Company data
2008 2016 CAGR
Unit cost
(CASM ex-fuel;
cents, USD)(1)
5.5 4.8 -1.6%
Passenger
demand
(RPMs, bn)
3.2 14.3 20.6%
Aircraft
(End of period)
21 69 16.0%
Routes
(End of period)
42 162 18.4%
Passengers
(mm)
3.5 15.0 20.0%
Operating
revenue
(bn, MXN)
4.4 23.5 23.3%
Adj. EBITDAR
(bn. MXN)
0.7 8.9 37.4%
Adj. ROIC (pre-
tax)
11% 20% +9 pp.
3
Volaris: snapshot at 30,000 feet
Volaris’ flight path for demand stimulation and
continued growth
Capacity
increase
Cost
reduction
“Clean”,
low
base
fares
More
customers
More
ancillaries
(“You decide”)
Resilient ULCC
business model
driving high,
profitable growth
4
Volaris’ consistent execution of its ULCC business
model well positioned for growth
Diversified and resilient point-to-point
network
Successful price unbundling
Strong penetration of Mexican air
travel market
Proven ancillary revenue model
Bus to air substitution
Upside in ancillary revenue
Continue geographic diversification
through international growth
Attractive emerging air travel market in
Mexico
Flexible fleet plan and utilization;
capacity management
Sustained profitability with strong
balance sheet
Continue cost reductions
Continue route frequency increase
OpportunitiesAccomplishments
5
Accomplishments
4.9
10.6 10.0
8.3
7.7
7.0 6.7 6.5
4.5
8.9
6.1 5.6
10.8
1.9
2.9
3.4
2.6
2.4
2.8
2.4 2.4
1.7
2.5
2.3
1.9
2.1
(1) Non-USD data converted to USD at an average exchange rate
(2) DCOMPS= Direct Competitors: Average CASM and CASM ex-fuel; US network carriers include: Delta, American Airlines, Alaska Airlines and United
(3) As of March 31, 2017
Source: Company data, airlines public information
Volaris has a best-in-class unit cost structure
Long-term unit cost advantage
CASM and CASM ex-fuel (LTM March 2017, USD cents) (1) Cost structure
7
• Economies of scale
- Dilute fixed costs
- High seat density
• Young and fuel efficient fleet
- Sharklet rollout
- Average age of 4.4 years (3)
- Low fuel burn
• Productive network
- Point-to-point
- No connections complexity
• High aircraft utilization
- 1Q17 average 12.4 block hours per
day
Latin American carriers US LCCs US network
carriers (2)
Continued cost improvement
potential
In line with best-in-class
ULCCs
6.8
13.5
10.9
10.1
9.8
9.1 8.9
11.3
8.4
7.5
12.9
6.2
13.4
2
5
%
Volaris’ cost structure enables us to lower base
fares and increase ancillaries
Volaris’ TRASM is below most competitors’ CASM (1)
TRASM and CASM (LTM March 2017 USD cents) (2)
8
Volaris’ resilient ULCC
model
TRASM
CASM
CASM
CASM
CASM
CASM
CASM
CASM
CASM
CASM
CASM
(1) Based on CASM and TRASM among the publicly-traded airlines
(2) Non-USD data converted to USD at an average exchange rate
(3) DCOMPS: US network carriers direct competitors include Delta, United, Alaska Airlines and American Airlines
Source: Company data, airlines public information
Overlap:
7.2 7.5
8.4
8.9 9.1
9.8 10.1
10.9
11.3
13.4 13.5
CASM
12.9
142
204 211
279
338
381 391
2011 2012 2013 2014 2015 2016 LTM Mar
2017
20
30
51 52
Volaris Wizz Allegiant Spirit
(1) Mexican legislation does not allow Mexican airlines to charge for the first checked bag on domestic flights
(2) Converted to USD using an average exchange rate for the period
(3) Data as of FY 2016
Source: Company data, airlines public information
Non-ticket revenues continue to grow, with
upside potential
Non-ticket revenue per passenger
Volaris(MXN) per passenger
Best-in class ULCCs, including first bag fee (1)
(1Q 2017, USD per passenger) (2)
2011-2016 CAGR: +21.9%
2.7x
Ancillaries
• Apply revenue management techniques
- Pricing by route, season, day
- Fully dynamic pricing for some products
• Add products
- New products & services
- Enhancements to existing products
• Improve presence
- More touch-points to sell ancillaries throughout
the journey
- Allow customization
• Benefit from network diversification
- More international capacity
• First checked bag
- USA and Puerto Rico
- Costa Rican AOC
Increasing non-ticket revenue allows to
reduce fare further and stimulate
demand
9
(3)
Network enhancement: connecting the dots and
diversifying further
Note: Excludes routes and stations announced to start operations
New routes
Domestic International
Cancun
Guadalajara 6
Mexico City 4
Other 2 4
Tijuana
Costa Rica 1 1
Total 3 15
New stations
USA Central America
Austin San Salvador
Seattle
San Francisco
Miami
Milwaukee
LTM March 2017 Volaris diversified its network by starting operations in 18 routes and 6 stations
Volaris’ LTM March 2017 new routes
10
New International
New Domestic
New Volaris Costa Rica
…supporting strong capacity growth
Joining existing airports
Additional frequencies
New airports
8.9%
3.3%
3.6%
Total ASM growth
1Q 2017 capacity growth contribution (yoy)
16.8%
Our network is well positioned for diversified growth
=
+
+
+
11
Source: Company data
Volaris Costa Rica 1.0%+
Growth opportunities
24
43
18
28
8
13
2010 2011 2012 2013 2014 2015 2016 LTM Mar
2017
Domestic USA Other international
Yoy growth 3.3% 4.0% 8.3% 8.3% 8.3% 12.3% 10.4% 10.2%
GDP growth (2) 5.1% 4.0% 4.0% 1.4% 2.3% 2.6% 2.3% 1.5%
GDP multiplier 0.6 1.0 2.1 6.1 3.7 4.7 4.5 6.8
In recent years, Mexico’s volume growth has been
robust despite challenging economic environment
(1) Considers Volaris and VivaAerobus domestic market share 1Q17
(2) Values according to INEGI´s new methodology
(3) Yoy growth for LTM March 2016 vs. LTM March 2017
(4) 2017 GDP expectation from Banxico’s March survey
Source: DGAC-SCT; INEGI; Banco de México
Mexico passenger market volume has increased since 2010
50 52
57
61
67
75
Passenger volume (millions)
13
82
Main industry
growth drivers
• Strong demand and
increasing middle
class
• LCC gaining market
through low fares
-43% LCC
share(1)
• High improvement
potential:
-Domestic air
trips per capita
in Mexico 0.25
vs. Brazil 0.45
3-5x GDP multiplier
in recent years
2010-2016 CAGR: +8.6%
85
(4)
(3)
6.5% 8.1% 8.8%
11.6%
8.0% 8.0%
23.4%
10.3%
19.6%
33.3%
26.9%
22.1%
2012 2013 2014 2015 2016 LTM Mar 2017
Market Volaris
10.3%
8.6% 7.9%
13.0% 12.8% 12.4%
25.2%
23.0%
7.7%
19.7%
24.8%
20.0%
2012 2013 2014 2015 2016 LTM Mar 2017
Market Volaris
Domestic passenger growth (%)
Source: DGAC, Company data
Volaris growth has surpassed market growth in
both domestic and international markets
14
International passenger growth (%)
• Low costs allow Volaris to offer
lower fares and make flying
possible
• Fleet
- Up-gauging: A320neo with
186 seats and A321 with 230
seats
- Young and fuel efficient:
average of 4.4 (1) years; new
generation aircraft
• Productive network with high
utilization
- Around 20 new routes per
year
- Avg. 12.4 block hours/day in
1Q 2017
• High and healthy load factors
- 83.2% in 1Q 2017
• 28% domestic passengers
market share as of Mar. 2017
Volaris has been the leading engine of growth for VFR and
leisure markets in Mexico, becoming the largest domestic
airline
Market
growth
Volaris
growth
2016, Volaris was the source of 46% of the growth among Mexican carriers
(1) Data as of March 2017
Note: Markets not mutually exclusive, contested domestic markets
Source. Company data, airlines public information
Volaris’ main growth driversSegment passenger CAGR Volaris vs. market (2010-2016)
15
Tijuana
Hermosillo
Los Cabos
Culiacan
Vallarta
Guadalajara
Mexico City
Cancun
Monterrey
10% 12%
5% 17%
10% 28%
8% 23%
11% 34%
9% 38%
8% 19%
11% 61%
13% 27%
(1) Minimum stage length of 170 miles
(2) Minimum stage length of 200 miles; CAM stands for Central America; SAM stands for South America
(3) South and northbound leisure routes
(4) Figures calculated as of April 2017
(5) Data from the World Bank
Source: Company data, DGAC and DIIO MI Market Intelligence for the Aviation Industry; ALTA
0
10
20
30
40
50
0
25
50
75
100
USA (VFR) USA (Leisure) CAM, SAM,
Canada,
Caribbean
Significant untapped opportunities
Domestic – growth potential of approx. 110
routes (4)
International – growth potential of approx. 135
routes (4)
(3)
Number of routes (1)
Number of routes (2)
Routes served Growth potential
16
In terms of air trips per capita Mexico has plenty potential to grow
2015 domestic air trips per capita (5)
2.39
0.81
0.60 0.49 0.42 0.32 0.30 0.28
0.09
USA Chile Colombia Brazil Peru Mexico Costa Rica Argentina Paraguay
28 42
29
40
2012 2016
Domestic
International
2012 2016
First, economy and other
Executive and luxury
ULCC model
First sell
Trial
Ticket giveaway
#Nomáscamión
Strong conversion
rate
Volaris contributed by stimulating demand from
bus to air substitution
Source: Company data, Secretaría de Comunicaciones y Transportes (SCT), 2016
Bus switching programSignificant upside for air travel
Total air travel passengers
in Mexico (mm)
Total bus passengers
in Mexico (mm)
2,758
33
Mass media campaigns
“Tarifa no + camion” positioning
Digital capabilities
Attracting 1st
time flyers
17
Education
2,971
2,683 2,891
74 80
55
82
• The right market
- Costa Rica is top three middle class growth
of LATAM
- Costa Rica GDP growth of 4.2%
accumulated in 2016
- Population of ~45M in Central America
- VFR potential in the region and to the USA,
Costa Rica is the country with the most
immigrants as a % of its population
- Bus switching potential
• The right moment
- No ULCC presence in the region
- Local competitors have 38% of capacity
share while US carriers 46%
- High average fare and yield environment
• The right ULCC model
- Growth sustainable and proved model, easily
translatable to Central America
- Ancillary revenue potential
- USD denominated revenue contributing to
FX natural hedge
Volaris’ Costa Rican AOC provides growth
potential in Central America
(1) Subject to authorization from the corresponding authorities
Source: World Bank, ALTA, MI-DIIO, CEPAL, Infare
Potential markets (1)Central America key insights
18
Volaris’ Central American operation full potential of 18-22 aircraft
Chicago
New York
Los Angeles
Dallas
HoustonSan Antonio Orlando
Miami
Guadalajara
Mexico City
Cancun
Guatemala
San José, CR
Managua
Medellin
Bogota
Cartagena
Quito
Guayaquil
Lima
La Paz
San Salvador
La Habana
Santo Domingo
Puerto Rico
New routes Date
San Jose, CR - Guatemala Dec/16
San Jose, CR - San Salvador Feb/17
San Jose, CR – Managua Apr/17
Guatemala – San Salvador Jun/17
Managua – San Salvador Jun/17
Drivers of continued profitable growth
Uniquely positioned to capture growth in underpenetrated Mexican aviation market
Reduce
unit costs
Fleet
growth
Expand
network
Increase
total
revenues
• Deepen footprint in
markets with high
demand stimulation
• Grow ancillary revenue to
world class ULCC
benchmarks
• 45 additional aircraft to be
delivered
• Up-gauge fleet from
A319 to A320/A321
• Higher seat density
configuration
• Expand network
geographically
Source: Company data
• Neo incorporation
- Fuel efficiency
19
• Price, product,
presence
Fleet and financials
15 12
5
15
15
15
28
28
28
1 7
15
10
10 10
0
1
6
2016 2017E 2018E
A319 A320
A320 w/sharklets A320 NEO w/sharklets
A321 w/sharklets A321 NEO w/sharklets
Volaris’ fleet plan supports its strategy to drive
lower unit costs
Note: NEO stands for the Airbus new engine option; CEO stands for the Airbus current engine option
(1) Net fleet after additions and returns
(2) Source: Airbus
(3) Figure calculated as of May 1, 2017
69
73
79
• A321 (CEO and NEO)
- 230 seats (up-gauge)
- ~10% CASM dilution(2)
• A320 NEO
- Combined fuel consumption
reduction by approx. 15-16% per
seat(2)
• A320 CEO with sharklets
- Fuel consumption reduction by
approx. 3%(2)
• All PDP requirements fully
financed
21
Contractual fleet obligations (number of aircraft)(1)
Backlog of 45 Aircraft to support growth (3)
1.2
2.5 2.8 3.1
6.5
8.9
7.7
0.0
5.0
10.0
2011 2012 2013 2014 2015 2016 LTM
Mar
2017
(MXNbn)
22%
20%
17% 16%
11% 10%
9%
4%
2%
32% 32%
28%
26% 25%
22% 21% 20% 19%
8.9
11.7
13.0
14.0
18.2
23.5 24.0
5
15
25
2011 2012 2013 2014 2015 2016 LTM
Mar
2017
(MXNbn)(MXNbn)
(1) CAGR for 2012-2016
Source: Company data, airlines public information
Revenue CAGR 2011 - 2016
High growth and solid financial performance
Revenues
22
2011 – 2016 CAGR: +21.5%
Adj. EBITDAR
LTM March 2017 Adj. EBITDAR margin
2011 – 2016 CAGR: +48.3%
76% 74% 73% 69% 67%
24% 26% 27% 31% 33%
0%
25%
50%
75%
100%
2012 2013 2014 2015 2016
Domestic International
Increasing international operation brings higher USD revenues
Volaris’ international expansion has been key in constructing a
better hedge for FX volatility
23
Volaris’ revenues breakdown, MXN billion (International revenues priced in USD)
11.7 13.0 14.0 18.2 23.5
2.0x
4.9x 5.3x 5.4x 5.4x 5.5x
6.0x
7.2x
9.4x
37%
29% 27%
16% 15%
11% 9%
7% 7%
Strong balance sheet and liquidity, well funded
for continued growth
24(1) Figures converted to USD at March 2017 end of the period spot exchange rate $18.81 for convenience purposes only
Source: Company data, airlines public information
• Unrestricted cash of $6.8 billion pesos (US$
364 million(1)) as of March 31, 2017.
• Net cash position of $4.8 billion pesos (US$
255 million(1)) as of March 31, 2017.
• Adjusted net debt to EBITDAR of 4.9x as of
March 31, 2017.
• Fully financed pre-delivery payments.
• Expected 2017 net CAPEX (US$ 120 to -
140 million):
• PDPs: from US$ 60 to 65 million, net
of PDP reimbursements
• Major maintenance: US$ 50 to 60
million
• Other: from US$ 10 to 15 million
Adj. net debt/EBITDAR
Liquidity-cash and equivalents as a % of LTM Op. Revenue
Appendix
Fuel price protection
26
(1) Approximate percentage of gallons hedged as of May 1, 2017
Period Total % hedged(1)
Avg. price (gal/USD$) Instrument
2Q17 55% $1.61 Call
3Q17 55% $1.44 Call
4Q17 55% $1.40 Call
1Q18 50% $1.63 Call
2Q18 50% $1.74 Call
3Q18 35% $1.79 Call
4Q18 25% $1.89 Call
(1) Full year 2016 figures converted to USD at December end of the period spot exchange rate $20.6640 for convenience purposes only
(2) 1Q 2017 figures converted to USD at March end of the period spot exchange rate $18.8092 for convenience purposes only
(3) Audited financial information 2014A – 2016A
Source: Company data
Consolidated statements of operations summary
MXN millions unless otherwise stated (3) 2014A 2015A 2016A 2016A (1) 1Q 2017 1Q 2017(2)
% of total
operating
revenues
(USD
millions)
(USD
millions)
Passenger 11,303 14,130 17,790 861 4,025 214 71.2
Non-ticket 2,733 4,049 5,722 277 1,631 87 28.8
Total operating revenues 14,037 18,180 23,512 1,138 5,656 301 100
Other operating income (22) (193) (497) (24) (1) - -
Fuel 5,364 4,721 5,741 278 1,892 101 33.5
Aircraft and engine rent expenses 2,535 3,525 5,590 271 1,699 90 30.0
Landing, take off and navigation expenses 2,066 2,595 3,272 158 1,035 55 18.3
Salaries and benefits 1,577 1,903 2,420 117 696 37 12.3
Sales, marketing and distribution expenses 817 1,089 1,413 68 358 19 6.3
Maintenance expenses 665 875 1,344 65 351 19 6.2
Other operating expenses 490 698 952 46 269 14 4.8
Depreciation and amortization 343 457 537 26 128 7 2.3
Total operating expenses 13,833 15,669 20,773 1,005 6,428 342 113.7
6
EBIT 204 2,510 2,740 133 (772) (41) (13.7)
Operating margin (%) 1.5 13.8 11.7 11.7 (13.7) (13.7)
Finance income 23 47 103 5 21 1 0.4
Finance cost (32) (22) (35) (2) (21) (1) (0.4)
Exchange gain (loss), net 449 967 2,170 105 (1,145) (61) (20.2)
Income tax (expense) benefit (39) (1,038) (1,457) (71) 556 30 9.8
Net income (loss) 605 2,464 3,519 170 (1,361) (72) (24.1)
Net margin (%) 4.3 13.6 15.0 15.0 (24.1) (24.1)
Adjusted EBITDAR 3,081 6,492 8,866 429 1,055 56 18.7
Adj. EBITDAR margin (%) 22.0 35.7 37.7 37.7 18.7 18.7
EPS Basic and Diluted (Pesos) 0.60 2.43 3.48 0.17 (1.34) (0.07)
EPADS Basic and Diluted (Pesos) 5.98 24.35 34.78 1.68 (13.45) (0.71)
27
Consolidated statements of financial position
summary
(1) Full year 2016 figures converted to USD at December end of the period spot exchange rate $20.6640 for convenience purposes only
(2) Net debt = financial debt - cash and cash equivalents
(3) Adjusted debt = (LTM aircraft rent expense x 7) + financial debt
(4) Adjusted net debt = adjusted debt - cash and cash equivalents
(5) Audited financial information 2014A – 2016A
(6) Certain amounts related to prepaid income tax and guarantee deposits, presented in the consolidated statement of financial position have been reclassified in 2015A, in order to
be comparative with the classification between current and non-current assets presented during 2016A
(7) 1Q 2017 figures converted to USD at March end of the period spot exchange rate $18.8092, respectively, for convenience purposes only
Source: Company data
MXN millions unless otherwise
stated (5) 2014A 2015A(6) 2016A 2016A (1) 1Q 2017 1Q 2017(7)
(USD
millions)
(USD
millions)
Cash and cash equivalents 2,265 5,157 7,071 342 6,839 364
Current guarantee deposits 545 873 1,167 56 1,067 57
Other current assets 879 1,193 3,313 160 3,039 162
Total current assets 3,689 7,224 11,551 559 10,945 582
Rotable spare parts, furniture and
equipment, net
2,223 2,550 2,525 122 2,751 146
Non-current guarantee deposits 3,541 4,693 6,560 317 5,992 319
Other non-current assets 452 765 1,146 55 1,011 54
Total assets 9,905 15,232 21,782 1,054 20,698 1,100
Unearned transportation revenue 1,421 1,957 2,154 104 2,987 159
Short-term financial debt 823 1,371 1,051 51 1,150 61
Other short-term liabilities 2,524 3,745 4,683 227 4,938 263
Total short-term liabilities 4,768 7,073 7,888 382 9,075 482
Long-term financial debt 425 220 943 46 885 47
Other long-term liabilities 242 1,113 2,157 104 1,516 81
Total liabilities 5,435 8,407 10,988 532 11,476 610
Total equity 4,470 6,825 10,794 522 9,222 490
Total liabilities and equity 9,905 15,232 21,782 1,054 20,698 1,100
Net debt (2) (1,017) (3,566) (5,077) (246) (4,804) (255)
Adjusted debt (3) 18,990 26,268 41,125 1,990 44,523 2,367
Adjusted net debt (4) 16,725 21,111 34,053 1,648 37,685 2,004
28
Consolidated statements of cash flows summary
(1) Full year 2016 figures converted to USD at December end of the period spot exchange rate $20.6640 for convenience purposes only
(2) 1Q 2017 figures converted to USD at March end of the period spot exchange rate $18.8092 for convenience purposes only
(3) Audited financial information 2014A – 2016A
Source: Company data
MXN millions unless otherwise stated (3) 2014A 2015A 2016A 2016A (1) 1Q 2017 1Q 2017(2)
(USD
millions)
(USD
millions)
Cash flow from operating activities
Income (loss) before income tax 644 3,502 4,977 241 (1,916) (102)
Depreciation and amortization 343 457 537 26 128 7
Guarantee deposits (695) (1,165) (1,957) (95) 380 20
Unearned transportation revenue 27 536 196 10 834 44
Changes in working capital and provisions 14 (261) (2,773) (134) 1,043 56
Net cash flows provided by operating activities 334 3,070 979 47 469 25
Cash flow from investing activities
Acquisitions of rotable spare parts, furniture, equipment and
intangible assets (1,603) (1,456) (2,259) (109) (444) (24)
Pre-delivery payments reimbursements 396 670 1,733 84 - -
Proceeds from disposals of rotable spare parts, furniture
and equipment 22 185 498 24 101 5
Net cash flows used in investing activities (1,185) (601) (28) (1) (342) (18)
Cash flow from financing activities
Treasury shares purchase (7) - (17) (1) - -
Proceeds from exercised stock options - 23 20 1 - -
Interest paid (23) (42) (39) (2) (20) (1)
Other finance costs (11) (40) (138) (7) - -
Payments of financial debt (400) (801) (1,531) (74) (287) (15)
Proceeds from financial debt 966 925 1,716 83 481 26
Net cash flows provided by financing activities 525 65 11 1 174 9
(Decrease) increase in cash and cash equivalents (326) 2,533 962 47 300 16
Net foreign exchange differences 141 359 952 46 (533) (28)
Cash and cash equivalents at beginning of period 2,451 2,265 5,157 250 7,071 376
Cash and cash equivalents at end of period 2,265 5,157 7,071 342 6,839 364
29
Adj. EBITDA and Adj. EBITDAR reconciliation
(1) Full year 2016 figures converted to USD at December end of the period spot exchange rate $20.6640 for convenience purposes only
(2) 1Q 2017 figures converted to USD at March end of the period spot exchange rate $18.8092 for convenience purposes only
(3) Audited financial information 2014A – 2016A
Source: Company data
MXN millions unless otherwise stated (3) 2014A 2015A 2016A 2016A(1) 1Q 2017 1Q 2017(2)
(USD
millions)
(USD
millions)
Net income (loss) 605 2,464 3,519 170 (1,361) (72)
Plus (minus):
Finance costs 32 22 35 2 21 1
Finance income (23) (47) (103) (5) (21) (1)
(Benefit)/provision for income taxes 39 1,038 1,457 71 (556) (30)
Depreciation and amortization 343 457 537 26 128 7
EBITDA 995 3,934 5,446 264 (1,789) (95)
Exchange (gain) loss, net (449) (967) (2,170) (105) 1,145 61
Adjusted EBITDA 547 2,967 3,276 159 (644) (34)
Aircraft and engine rent expense 2,535 3,525 5,590 271 1,699 90
Adjusted EBITDAR 3,081 6,492 8,866 429 1,055 56
30

More Related Content

What's hot

Lvs 3 q17 earnings deck final
Lvs 3 q17 earnings deck   finalLvs 3 q17 earnings deck   final
Lvs 3 q17 earnings deck final
Investor_lvs
 
Investor Day Presentation
Investor Day PresentationInvestor Day Presentation
Investor Day Presentation
Investor_Meredith
 
Franklin resourcesq416
Franklin resourcesq416Franklin resourcesq416
Franklin resourcesq416
franklinresources
 
January Investor Presentation
January Investor PresentationJanuary Investor Presentation
January Investor Presentation
Devon Energy Corporation
 
PVA Credit Suisse Investor Presentation
PVA Credit Suisse Investor PresentationPVA Credit Suisse Investor Presentation
PVA Credit Suisse Investor PresentationPennVirginiaCorp
 
Tsn investor presentation march 2016
Tsn investor presentation march 2016Tsn investor presentation march 2016
Tsn investor presentation march 2016
investortyson
 
Investor presentation february 2015
Investor presentation   february 2015Investor presentation   february 2015
Investor presentation february 2015
genworth_financial
 
Meredith to acquire time inc. ir pres. final
Meredith to acquire time inc. ir pres. finalMeredith to acquire time inc. ir pres. final
Meredith to acquire time inc. ir pres. final
Investor_Meredith
 
March Investor Presentation
March Investor PresentationMarch Investor Presentation
March Investor Presentation
Devon Energy Corporation
 
Earnings executive commentary 3 q 2017
Earnings executive commentary 3 q 2017Earnings executive commentary 3 q 2017
Earnings executive commentary 3 q 2017
franklinresources
 
Earnings release 12 2015
Earnings release 12 2015Earnings release 12 2015
Earnings release 12 2015
franklinresources
 
2015 Delta Investor Day Presentation
2015 Delta Investor Day Presentation2015 Delta Investor Day Presentation
2015 Delta Investor Day Presentation
Delta_Airlines
 
Investor update march 2016 website
Investor update march 2016 websiteInvestor update march 2016 website
Investor update march 2016 website
investor_phillips66
 
Brink's 3 q 2017 earnings slides final 10242017
Brink's 3 q 2017 earnings slides final 10242017Brink's 3 q 2017 earnings slides final 10242017
Brink's 3 q 2017 earnings slides final 10242017
investorsbrinks
 
Tsn investor presentation september 2017
Tsn investor presentation september 2017Tsn investor presentation september 2017
Tsn investor presentation september 2017
investortyson
 
01 05-16 Evercore ISI CEO Retreat Presentation
01 05-16 Evercore ISI CEO Retreat Presentation01 05-16 Evercore ISI CEO Retreat Presentation
01 05-16 Evercore ISI CEO Retreat Presentation
AES_BigSky
 
August Investor Presentation
August Investor PresentationAugust Investor Presentation
August Investor Presentation
Devon Energy Corporation
 
Brink's Fourth Quarter 2015 Earnings Presentation
Brink's Fourth Quarter 2015 Earnings PresentationBrink's Fourth Quarter 2015 Earnings Presentation
Brink's Fourth Quarter 2015 Earnings Presentation
brinks2015
 
The Brink's Company First Quarter 2017 Results Presentation
The Brink's Company First Quarter 2017 Results PresentationThe Brink's Company First Quarter 2017 Results Presentation
The Brink's Company First Quarter 2017 Results Presentation
investorsbrinks
 
January Investor Presentation
January Investor Presentation January Investor Presentation
January Investor Presentation
SandRidgeIR
 

What's hot (20)

Lvs 3 q17 earnings deck final
Lvs 3 q17 earnings deck   finalLvs 3 q17 earnings deck   final
Lvs 3 q17 earnings deck final
 
Investor Day Presentation
Investor Day PresentationInvestor Day Presentation
Investor Day Presentation
 
Franklin resourcesq416
Franklin resourcesq416Franklin resourcesq416
Franklin resourcesq416
 
January Investor Presentation
January Investor PresentationJanuary Investor Presentation
January Investor Presentation
 
PVA Credit Suisse Investor Presentation
PVA Credit Suisse Investor PresentationPVA Credit Suisse Investor Presentation
PVA Credit Suisse Investor Presentation
 
Tsn investor presentation march 2016
Tsn investor presentation march 2016Tsn investor presentation march 2016
Tsn investor presentation march 2016
 
Investor presentation february 2015
Investor presentation   february 2015Investor presentation   february 2015
Investor presentation february 2015
 
Meredith to acquire time inc. ir pres. final
Meredith to acquire time inc. ir pres. finalMeredith to acquire time inc. ir pres. final
Meredith to acquire time inc. ir pres. final
 
March Investor Presentation
March Investor PresentationMarch Investor Presentation
March Investor Presentation
 
Earnings executive commentary 3 q 2017
Earnings executive commentary 3 q 2017Earnings executive commentary 3 q 2017
Earnings executive commentary 3 q 2017
 
Earnings release 12 2015
Earnings release 12 2015Earnings release 12 2015
Earnings release 12 2015
 
2015 Delta Investor Day Presentation
2015 Delta Investor Day Presentation2015 Delta Investor Day Presentation
2015 Delta Investor Day Presentation
 
Investor update march 2016 website
Investor update march 2016 websiteInvestor update march 2016 website
Investor update march 2016 website
 
Brink's 3 q 2017 earnings slides final 10242017
Brink's 3 q 2017 earnings slides final 10242017Brink's 3 q 2017 earnings slides final 10242017
Brink's 3 q 2017 earnings slides final 10242017
 
Tsn investor presentation september 2017
Tsn investor presentation september 2017Tsn investor presentation september 2017
Tsn investor presentation september 2017
 
01 05-16 Evercore ISI CEO Retreat Presentation
01 05-16 Evercore ISI CEO Retreat Presentation01 05-16 Evercore ISI CEO Retreat Presentation
01 05-16 Evercore ISI CEO Retreat Presentation
 
August Investor Presentation
August Investor PresentationAugust Investor Presentation
August Investor Presentation
 
Brink's Fourth Quarter 2015 Earnings Presentation
Brink's Fourth Quarter 2015 Earnings PresentationBrink's Fourth Quarter 2015 Earnings Presentation
Brink's Fourth Quarter 2015 Earnings Presentation
 
The Brink's Company First Quarter 2017 Results Presentation
The Brink's Company First Quarter 2017 Results PresentationThe Brink's Company First Quarter 2017 Results Presentation
The Brink's Company First Quarter 2017 Results Presentation
 
January Investor Presentation
January Investor Presentation January Investor Presentation
January Investor Presentation
 

Similar to Volaris corporate presentation may 2017

Volaris corporate presentation september 2017
Volaris corporate presentation september 2017Volaris corporate presentation september 2017
Volaris corporate presentation september 2017
irvolaris
 
Volaris corporate presentation november 2017
Volaris corporate presentation november 2017Volaris corporate presentation november 2017
Volaris corporate presentation november 2017
irvolaris
 
Volaris corp presentation may 2018
Volaris corp presentation may 2018Volaris corp presentation may 2018
Volaris corp presentation may 2018
irvolaris
 
Volaris corp presentation may 2018 ii
Volaris corp presentation may 2018 iiVolaris corp presentation may 2018 ii
Volaris corp presentation may 2018 ii
irvolaris
 
Volaris corp presentation may 2018
Volaris corp presentation may 2018Volaris corp presentation may 2018
Volaris corp presentation may 2018
irvolaris
 
Volaris corp presentation march 2018
Volaris corp presentation march 2018Volaris corp presentation march 2018
Volaris corp presentation march 2018
irvolaris
 
Volaris corporate presentation 4 q17
Volaris corporate presentation 4 q17Volaris corporate presentation 4 q17
Volaris corporate presentation 4 q17
irvolaris
 
Citi’s 26th Annual Latin America Conference
Citi’s 26th Annual Latin America ConferenceCiti’s 26th Annual Latin America Conference
Citi’s 26th Annual Latin America Conference
irvolaris
 
Volaris corp presentation march 2018 (2)
Volaris corp presentation march 2018 (2)Volaris corp presentation march 2018 (2)
Volaris corp presentation march 2018 (2)
irvolaris
 
Volaris corp presentation march 2018 esp
Volaris corp presentation march 2018 espVolaris corp presentation march 2018 esp
Volaris corp presentation march 2018 esp
irvolaris
 
Corp prez may 2018 ii
Corp prez may 2018 iiCorp prez may 2018 ii
Corp prez may 2018 ii
irvolaris
 
Volaris corp presentation may 2018
Volaris corp presentation may 2018Volaris corp presentation may 2018
Volaris corp presentation may 2018
irvolaris
 
Corp pres june 2018
Corp pres june 2018Corp pres june 2018
Corp pres june 2018
irvolaris
 
Corp pres july 2018 v1
Corp pres july 2018 v1Corp pres july 2018 v1
Corp pres july 2018 v1
irvolaris
 
Corp pres july 2018 v1
Corp pres july 2018 v1Corp pres july 2018 v1
Corp pres july 2018 v1
irvolaris
 
Volaris corp presentation march 2018
Volaris corp presentation march 2018Volaris corp presentation march 2018
Volaris corp presentation march 2018
irvolaris
 
Corp prez may 2018 ii
Corp prez may 2018 iiCorp prez may 2018 ii
Corp prez may 2018 ii
irvolaris
 
Corp prez may 2018 ii
Corp prez may 2018 iiCorp prez may 2018 ii
Corp prez may 2018 ii
irvolaris
 
Corp pres june 2018
Corp pres june 2018Corp pres june 2018
Corp pres june 2018
irvolaris
 
Volaris corporate presentation november 2017
Volaris corporate presentation november 2017Volaris corporate presentation november 2017
Volaris corporate presentation november 2017
irvolaris
 

Similar to Volaris corporate presentation may 2017 (20)

Volaris corporate presentation september 2017
Volaris corporate presentation september 2017Volaris corporate presentation september 2017
Volaris corporate presentation september 2017
 
Volaris corporate presentation november 2017
Volaris corporate presentation november 2017Volaris corporate presentation november 2017
Volaris corporate presentation november 2017
 
Volaris corp presentation may 2018
Volaris corp presentation may 2018Volaris corp presentation may 2018
Volaris corp presentation may 2018
 
Volaris corp presentation may 2018 ii
Volaris corp presentation may 2018 iiVolaris corp presentation may 2018 ii
Volaris corp presentation may 2018 ii
 
Volaris corp presentation may 2018
Volaris corp presentation may 2018Volaris corp presentation may 2018
Volaris corp presentation may 2018
 
Volaris corp presentation march 2018
Volaris corp presentation march 2018Volaris corp presentation march 2018
Volaris corp presentation march 2018
 
Volaris corporate presentation 4 q17
Volaris corporate presentation 4 q17Volaris corporate presentation 4 q17
Volaris corporate presentation 4 q17
 
Citi’s 26th Annual Latin America Conference
Citi’s 26th Annual Latin America ConferenceCiti’s 26th Annual Latin America Conference
Citi’s 26th Annual Latin America Conference
 
Volaris corp presentation march 2018 (2)
Volaris corp presentation march 2018 (2)Volaris corp presentation march 2018 (2)
Volaris corp presentation march 2018 (2)
 
Volaris corp presentation march 2018 esp
Volaris corp presentation march 2018 espVolaris corp presentation march 2018 esp
Volaris corp presentation march 2018 esp
 
Corp prez may 2018 ii
Corp prez may 2018 iiCorp prez may 2018 ii
Corp prez may 2018 ii
 
Volaris corp presentation may 2018
Volaris corp presentation may 2018Volaris corp presentation may 2018
Volaris corp presentation may 2018
 
Corp pres june 2018
Corp pres june 2018Corp pres june 2018
Corp pres june 2018
 
Corp pres july 2018 v1
Corp pres july 2018 v1Corp pres july 2018 v1
Corp pres july 2018 v1
 
Corp pres july 2018 v1
Corp pres july 2018 v1Corp pres july 2018 v1
Corp pres july 2018 v1
 
Volaris corp presentation march 2018
Volaris corp presentation march 2018Volaris corp presentation march 2018
Volaris corp presentation march 2018
 
Corp prez may 2018 ii
Corp prez may 2018 iiCorp prez may 2018 ii
Corp prez may 2018 ii
 
Corp prez may 2018 ii
Corp prez may 2018 iiCorp prez may 2018 ii
Corp prez may 2018 ii
 
Corp pres june 2018
Corp pres june 2018Corp pres june 2018
Corp pres june 2018
 
Volaris corporate presentation november 2017
Volaris corporate presentation november 2017Volaris corporate presentation november 2017
Volaris corporate presentation november 2017
 

More from irvolaris

Volaris corporate presentation january 2018 2
Volaris corporate presentation january 2018 2Volaris corporate presentation january 2018 2
Volaris corporate presentation january 2018 2
irvolaris
 
Volaris corporate presentation january 2018
Volaris corporate presentation january 2018Volaris corporate presentation january 2018
Volaris corporate presentation january 2018
irvolaris
 
Volaris investor-day-presentation-2017-v final
Volaris investor-day-presentation-2017-v finalVolaris investor-day-presentation-2017-v final
Volaris investor-day-presentation-2017-v final
irvolaris
 
170302 volaris corporate presentation march 2017
170302 volaris corporate presentation march 2017170302 volaris corporate presentation march 2017
170302 volaris corporate presentation march 2017
irvolaris
 
Volaris Corporate Presentation November 2016
Volaris Corporate Presentation November 2016Volaris Corporate Presentation November 2016
Volaris Corporate Presentation November 2016
irvolaris
 
Volaris corporate presentation august 2016
Volaris corporate presentation august 2016Volaris corporate presentation august 2016
Volaris corporate presentation august 2016
irvolaris
 
Volaris corporate presentation august 2016
Volaris corporate presentation august 2016Volaris corporate presentation august 2016
Volaris corporate presentation august 2016
irvolaris
 
Volaris corporate presentation may 2016
Volaris corporate presentation may 2016Volaris corporate presentation may 2016
Volaris corporate presentation may 2016
irvolaris
 
Volaris investor day presentation march 15,2016
Volaris investor day presentation march 15,2016Volaris investor day presentation march 15,2016
Volaris investor day presentation march 15,2016
irvolaris
 

More from irvolaris (9)

Volaris corporate presentation january 2018 2
Volaris corporate presentation january 2018 2Volaris corporate presentation january 2018 2
Volaris corporate presentation january 2018 2
 
Volaris corporate presentation january 2018
Volaris corporate presentation january 2018Volaris corporate presentation january 2018
Volaris corporate presentation january 2018
 
Volaris investor-day-presentation-2017-v final
Volaris investor-day-presentation-2017-v finalVolaris investor-day-presentation-2017-v final
Volaris investor-day-presentation-2017-v final
 
170302 volaris corporate presentation march 2017
170302 volaris corporate presentation march 2017170302 volaris corporate presentation march 2017
170302 volaris corporate presentation march 2017
 
Volaris Corporate Presentation November 2016
Volaris Corporate Presentation November 2016Volaris Corporate Presentation November 2016
Volaris Corporate Presentation November 2016
 
Volaris corporate presentation august 2016
Volaris corporate presentation august 2016Volaris corporate presentation august 2016
Volaris corporate presentation august 2016
 
Volaris corporate presentation august 2016
Volaris corporate presentation august 2016Volaris corporate presentation august 2016
Volaris corporate presentation august 2016
 
Volaris corporate presentation may 2016
Volaris corporate presentation may 2016Volaris corporate presentation may 2016
Volaris corporate presentation may 2016
 
Volaris investor day presentation march 15,2016
Volaris investor day presentation march 15,2016Volaris investor day presentation march 15,2016
Volaris investor day presentation march 15,2016
 

Recently uploaded

cyberagent_For New Investors_EN_240424.pdf
cyberagent_For New Investors_EN_240424.pdfcyberagent_For New Investors_EN_240424.pdf
cyberagent_For New Investors_EN_240424.pdf
CyberAgent, Inc.
 
Snam 2023-27 Industrial Plan - Financial Presentation
Snam 2023-27 Industrial Plan - Financial PresentationSnam 2023-27 Industrial Plan - Financial Presentation
Snam 2023-27 Industrial Plan - Financial Presentation
Valentina Ottini
 
Investor Day 2024 Presentation Sysco 2024
Investor Day 2024 Presentation Sysco 2024Investor Day 2024 Presentation Sysco 2024
Investor Day 2024 Presentation Sysco 2024
Sysco_Investors
 
Collective Mining | Corporate Presentation - May 2024
Collective Mining | Corporate Presentation - May 2024Collective Mining | Corporate Presentation - May 2024
Collective Mining | Corporate Presentation - May 2024
CollectiveMining1
 
Osisko Development - Investor Presentation - June 24
Osisko Development - Investor Presentation - June 24Osisko Development - Investor Presentation - June 24
Osisko Development - Investor Presentation - June 24
Philip Rabenok
 
Collective Mining | Corporate Presentation - May 2024
Collective Mining | Corporate Presentation - May 2024Collective Mining | Corporate Presentation - May 2024
Collective Mining | Corporate Presentation - May 2024
CollectiveMining1
 
New Tax Regime User Guide Flexi Plan Revised (1).pptx
New Tax Regime User Guide Flexi Plan Revised (1).pptxNew Tax Regime User Guide Flexi Plan Revised (1).pptx
New Tax Regime User Guide Flexi Plan Revised (1).pptx
RajkumarRajamanikam
 
Corporate Presentation Probe June 2024.pdf
Corporate Presentation Probe June 2024.pdfCorporate Presentation Probe June 2024.pdf
Corporate Presentation Probe June 2024.pdf
Probe Gold
 

Recently uploaded (8)

cyberagent_For New Investors_EN_240424.pdf
cyberagent_For New Investors_EN_240424.pdfcyberagent_For New Investors_EN_240424.pdf
cyberagent_For New Investors_EN_240424.pdf
 
Snam 2023-27 Industrial Plan - Financial Presentation
Snam 2023-27 Industrial Plan - Financial PresentationSnam 2023-27 Industrial Plan - Financial Presentation
Snam 2023-27 Industrial Plan - Financial Presentation
 
Investor Day 2024 Presentation Sysco 2024
Investor Day 2024 Presentation Sysco 2024Investor Day 2024 Presentation Sysco 2024
Investor Day 2024 Presentation Sysco 2024
 
Collective Mining | Corporate Presentation - May 2024
Collective Mining | Corporate Presentation - May 2024Collective Mining | Corporate Presentation - May 2024
Collective Mining | Corporate Presentation - May 2024
 
Osisko Development - Investor Presentation - June 24
Osisko Development - Investor Presentation - June 24Osisko Development - Investor Presentation - June 24
Osisko Development - Investor Presentation - June 24
 
Collective Mining | Corporate Presentation - May 2024
Collective Mining | Corporate Presentation - May 2024Collective Mining | Corporate Presentation - May 2024
Collective Mining | Corporate Presentation - May 2024
 
New Tax Regime User Guide Flexi Plan Revised (1).pptx
New Tax Regime User Guide Flexi Plan Revised (1).pptxNew Tax Regime User Guide Flexi Plan Revised (1).pptx
New Tax Regime User Guide Flexi Plan Revised (1).pptx
 
Corporate Presentation Probe June 2024.pdf
Corporate Presentation Probe June 2024.pdfCorporate Presentation Probe June 2024.pdf
Corporate Presentation Probe June 2024.pdf
 

Volaris corporate presentation may 2017

  • 1. Volaris: the leading ultra-low-cost airline serving Mexico, USA and Central America May 2017
  • 2. The information ("Confidential Information") contained in this presentation is confidential and is provided by Controladora Vuela Compañía de Aviación, S.A.B. de C.V., (d/b/a Volaris, the "Company") confidentially to you solely for your reference and may not be retransmitted or distributed to any other persons for any purpose whatsoever. The Confidential Information is subject to change without notice, its accuracy is not guaranteed, it has not been independently verified and it may not contain all material information concerning the Company. Neither the Company, nor any of their respective directors makes any representation or warranty (express or implied) regarding, or assumes any responsibility or liability for, the accuracy or completeness of, or any errors or omissions in, any information or opinions contained herein. None of the Company nor any of their respective directors, officers, employees, stockholders or affiliates nor any other person accepts any liability (in negligence, or otherwise) whatsoever for any loss howsoever arising from any use of this presentation or its contents or otherwise arising in connection therewith. No reliance may be placed for any purposes whatsoever on the information set forth in this presentation or on its completeness. This presentation does not constitute or form part of any offer or invitation for sale or subscription of or solicitation or invitation of any offer to buy or subscribe for any securities, nor shall it or any part of it form the basis of or be relied on in connection with any contract or commitment whatsoever. Recipients of this presentation are not to construe the contents of this presentation as legal, tax or investment advice and should consult their own advisers in this regard. This presentation contains statements that constitute forward-looking statements which involve risks and uncertainties. These statements include descriptions regarding the intent, belief or current expectations of the Company or its officers with respect to the consolidated results of operations and financial condition, and future events and plans of the Company. These statements can be recognized by the use of words such as "expects," "plans," "will," "estimates," "projects," or words of similar meaning. Such forward-looking statements are not guarantees of future performance and actual results may differ significantly from those in the forward-looking statements as a result of various factors and assumptions. You are cautioned not to place undue reliance on these forward looking statements, which are based on the current view of the management of the Company on future events. The Company does not undertake to revise forward-looking statements to reflect future events or circumstances. Disclaimer 2
  • 3. Serving 68 destinations throughout Mexico (40), USA (24) and Central America (4) (1) Converted to USD at an average annual exchange rate Source: Company data 2008 2016 CAGR Unit cost (CASM ex-fuel; cents, USD)(1) 5.5 4.8 -1.6% Passenger demand (RPMs, bn) 3.2 14.3 20.6% Aircraft (End of period) 21 69 16.0% Routes (End of period) 42 162 18.4% Passengers (mm) 3.5 15.0 20.0% Operating revenue (bn, MXN) 4.4 23.5 23.3% Adj. EBITDAR (bn. MXN) 0.7 8.9 37.4% Adj. ROIC (pre- tax) 11% 20% +9 pp. 3 Volaris: snapshot at 30,000 feet
  • 4. Volaris’ flight path for demand stimulation and continued growth Capacity increase Cost reduction “Clean”, low base fares More customers More ancillaries (“You decide”) Resilient ULCC business model driving high, profitable growth 4
  • 5. Volaris’ consistent execution of its ULCC business model well positioned for growth Diversified and resilient point-to-point network Successful price unbundling Strong penetration of Mexican air travel market Proven ancillary revenue model Bus to air substitution Upside in ancillary revenue Continue geographic diversification through international growth Attractive emerging air travel market in Mexico Flexible fleet plan and utilization; capacity management Sustained profitability with strong balance sheet Continue cost reductions Continue route frequency increase OpportunitiesAccomplishments 5
  • 7. 4.9 10.6 10.0 8.3 7.7 7.0 6.7 6.5 4.5 8.9 6.1 5.6 10.8 1.9 2.9 3.4 2.6 2.4 2.8 2.4 2.4 1.7 2.5 2.3 1.9 2.1 (1) Non-USD data converted to USD at an average exchange rate (2) DCOMPS= Direct Competitors: Average CASM and CASM ex-fuel; US network carriers include: Delta, American Airlines, Alaska Airlines and United (3) As of March 31, 2017 Source: Company data, airlines public information Volaris has a best-in-class unit cost structure Long-term unit cost advantage CASM and CASM ex-fuel (LTM March 2017, USD cents) (1) Cost structure 7 • Economies of scale - Dilute fixed costs - High seat density • Young and fuel efficient fleet - Sharklet rollout - Average age of 4.4 years (3) - Low fuel burn • Productive network - Point-to-point - No connections complexity • High aircraft utilization - 1Q17 average 12.4 block hours per day Latin American carriers US LCCs US network carriers (2) Continued cost improvement potential In line with best-in-class ULCCs 6.8 13.5 10.9 10.1 9.8 9.1 8.9 11.3 8.4 7.5 12.9 6.2 13.4
  • 8. 2 5 % Volaris’ cost structure enables us to lower base fares and increase ancillaries Volaris’ TRASM is below most competitors’ CASM (1) TRASM and CASM (LTM March 2017 USD cents) (2) 8 Volaris’ resilient ULCC model TRASM CASM CASM CASM CASM CASM CASM CASM CASM CASM CASM (1) Based on CASM and TRASM among the publicly-traded airlines (2) Non-USD data converted to USD at an average exchange rate (3) DCOMPS: US network carriers direct competitors include Delta, United, Alaska Airlines and American Airlines Source: Company data, airlines public information Overlap: 7.2 7.5 8.4 8.9 9.1 9.8 10.1 10.9 11.3 13.4 13.5 CASM 12.9
  • 9. 142 204 211 279 338 381 391 2011 2012 2013 2014 2015 2016 LTM Mar 2017 20 30 51 52 Volaris Wizz Allegiant Spirit (1) Mexican legislation does not allow Mexican airlines to charge for the first checked bag on domestic flights (2) Converted to USD using an average exchange rate for the period (3) Data as of FY 2016 Source: Company data, airlines public information Non-ticket revenues continue to grow, with upside potential Non-ticket revenue per passenger Volaris(MXN) per passenger Best-in class ULCCs, including first bag fee (1) (1Q 2017, USD per passenger) (2) 2011-2016 CAGR: +21.9% 2.7x Ancillaries • Apply revenue management techniques - Pricing by route, season, day - Fully dynamic pricing for some products • Add products - New products & services - Enhancements to existing products • Improve presence - More touch-points to sell ancillaries throughout the journey - Allow customization • Benefit from network diversification - More international capacity • First checked bag - USA and Puerto Rico - Costa Rican AOC Increasing non-ticket revenue allows to reduce fare further and stimulate demand 9 (3)
  • 10. Network enhancement: connecting the dots and diversifying further Note: Excludes routes and stations announced to start operations New routes Domestic International Cancun Guadalajara 6 Mexico City 4 Other 2 4 Tijuana Costa Rica 1 1 Total 3 15 New stations USA Central America Austin San Salvador Seattle San Francisco Miami Milwaukee LTM March 2017 Volaris diversified its network by starting operations in 18 routes and 6 stations Volaris’ LTM March 2017 new routes 10 New International New Domestic New Volaris Costa Rica
  • 11. …supporting strong capacity growth Joining existing airports Additional frequencies New airports 8.9% 3.3% 3.6% Total ASM growth 1Q 2017 capacity growth contribution (yoy) 16.8% Our network is well positioned for diversified growth = + + + 11 Source: Company data Volaris Costa Rica 1.0%+
  • 13. 24 43 18 28 8 13 2010 2011 2012 2013 2014 2015 2016 LTM Mar 2017 Domestic USA Other international Yoy growth 3.3% 4.0% 8.3% 8.3% 8.3% 12.3% 10.4% 10.2% GDP growth (2) 5.1% 4.0% 4.0% 1.4% 2.3% 2.6% 2.3% 1.5% GDP multiplier 0.6 1.0 2.1 6.1 3.7 4.7 4.5 6.8 In recent years, Mexico’s volume growth has been robust despite challenging economic environment (1) Considers Volaris and VivaAerobus domestic market share 1Q17 (2) Values according to INEGI´s new methodology (3) Yoy growth for LTM March 2016 vs. LTM March 2017 (4) 2017 GDP expectation from Banxico’s March survey Source: DGAC-SCT; INEGI; Banco de México Mexico passenger market volume has increased since 2010 50 52 57 61 67 75 Passenger volume (millions) 13 82 Main industry growth drivers • Strong demand and increasing middle class • LCC gaining market through low fares -43% LCC share(1) • High improvement potential: -Domestic air trips per capita in Mexico 0.25 vs. Brazil 0.45 3-5x GDP multiplier in recent years 2010-2016 CAGR: +8.6% 85 (4) (3)
  • 14. 6.5% 8.1% 8.8% 11.6% 8.0% 8.0% 23.4% 10.3% 19.6% 33.3% 26.9% 22.1% 2012 2013 2014 2015 2016 LTM Mar 2017 Market Volaris 10.3% 8.6% 7.9% 13.0% 12.8% 12.4% 25.2% 23.0% 7.7% 19.7% 24.8% 20.0% 2012 2013 2014 2015 2016 LTM Mar 2017 Market Volaris Domestic passenger growth (%) Source: DGAC, Company data Volaris growth has surpassed market growth in both domestic and international markets 14 International passenger growth (%)
  • 15. • Low costs allow Volaris to offer lower fares and make flying possible • Fleet - Up-gauging: A320neo with 186 seats and A321 with 230 seats - Young and fuel efficient: average of 4.4 (1) years; new generation aircraft • Productive network with high utilization - Around 20 new routes per year - Avg. 12.4 block hours/day in 1Q 2017 • High and healthy load factors - 83.2% in 1Q 2017 • 28% domestic passengers market share as of Mar. 2017 Volaris has been the leading engine of growth for VFR and leisure markets in Mexico, becoming the largest domestic airline Market growth Volaris growth 2016, Volaris was the source of 46% of the growth among Mexican carriers (1) Data as of March 2017 Note: Markets not mutually exclusive, contested domestic markets Source. Company data, airlines public information Volaris’ main growth driversSegment passenger CAGR Volaris vs. market (2010-2016) 15 Tijuana Hermosillo Los Cabos Culiacan Vallarta Guadalajara Mexico City Cancun Monterrey 10% 12% 5% 17% 10% 28% 8% 23% 11% 34% 9% 38% 8% 19% 11% 61% 13% 27%
  • 16. (1) Minimum stage length of 170 miles (2) Minimum stage length of 200 miles; CAM stands for Central America; SAM stands for South America (3) South and northbound leisure routes (4) Figures calculated as of April 2017 (5) Data from the World Bank Source: Company data, DGAC and DIIO MI Market Intelligence for the Aviation Industry; ALTA 0 10 20 30 40 50 0 25 50 75 100 USA (VFR) USA (Leisure) CAM, SAM, Canada, Caribbean Significant untapped opportunities Domestic – growth potential of approx. 110 routes (4) International – growth potential of approx. 135 routes (4) (3) Number of routes (1) Number of routes (2) Routes served Growth potential 16 In terms of air trips per capita Mexico has plenty potential to grow 2015 domestic air trips per capita (5) 2.39 0.81 0.60 0.49 0.42 0.32 0.30 0.28 0.09 USA Chile Colombia Brazil Peru Mexico Costa Rica Argentina Paraguay
  • 17. 28 42 29 40 2012 2016 Domestic International 2012 2016 First, economy and other Executive and luxury ULCC model First sell Trial Ticket giveaway #Nomáscamión Strong conversion rate Volaris contributed by stimulating demand from bus to air substitution Source: Company data, Secretaría de Comunicaciones y Transportes (SCT), 2016 Bus switching programSignificant upside for air travel Total air travel passengers in Mexico (mm) Total bus passengers in Mexico (mm) 2,758 33 Mass media campaigns “Tarifa no + camion” positioning Digital capabilities Attracting 1st time flyers 17 Education 2,971 2,683 2,891 74 80 55 82
  • 18. • The right market - Costa Rica is top three middle class growth of LATAM - Costa Rica GDP growth of 4.2% accumulated in 2016 - Population of ~45M in Central America - VFR potential in the region and to the USA, Costa Rica is the country with the most immigrants as a % of its population - Bus switching potential • The right moment - No ULCC presence in the region - Local competitors have 38% of capacity share while US carriers 46% - High average fare and yield environment • The right ULCC model - Growth sustainable and proved model, easily translatable to Central America - Ancillary revenue potential - USD denominated revenue contributing to FX natural hedge Volaris’ Costa Rican AOC provides growth potential in Central America (1) Subject to authorization from the corresponding authorities Source: World Bank, ALTA, MI-DIIO, CEPAL, Infare Potential markets (1)Central America key insights 18 Volaris’ Central American operation full potential of 18-22 aircraft Chicago New York Los Angeles Dallas HoustonSan Antonio Orlando Miami Guadalajara Mexico City Cancun Guatemala San José, CR Managua Medellin Bogota Cartagena Quito Guayaquil Lima La Paz San Salvador La Habana Santo Domingo Puerto Rico New routes Date San Jose, CR - Guatemala Dec/16 San Jose, CR - San Salvador Feb/17 San Jose, CR – Managua Apr/17 Guatemala – San Salvador Jun/17 Managua – San Salvador Jun/17
  • 19. Drivers of continued profitable growth Uniquely positioned to capture growth in underpenetrated Mexican aviation market Reduce unit costs Fleet growth Expand network Increase total revenues • Deepen footprint in markets with high demand stimulation • Grow ancillary revenue to world class ULCC benchmarks • 45 additional aircraft to be delivered • Up-gauge fleet from A319 to A320/A321 • Higher seat density configuration • Expand network geographically Source: Company data • Neo incorporation - Fuel efficiency 19 • Price, product, presence
  • 21. 15 12 5 15 15 15 28 28 28 1 7 15 10 10 10 0 1 6 2016 2017E 2018E A319 A320 A320 w/sharklets A320 NEO w/sharklets A321 w/sharklets A321 NEO w/sharklets Volaris’ fleet plan supports its strategy to drive lower unit costs Note: NEO stands for the Airbus new engine option; CEO stands for the Airbus current engine option (1) Net fleet after additions and returns (2) Source: Airbus (3) Figure calculated as of May 1, 2017 69 73 79 • A321 (CEO and NEO) - 230 seats (up-gauge) - ~10% CASM dilution(2) • A320 NEO - Combined fuel consumption reduction by approx. 15-16% per seat(2) • A320 CEO with sharklets - Fuel consumption reduction by approx. 3%(2) • All PDP requirements fully financed 21 Contractual fleet obligations (number of aircraft)(1) Backlog of 45 Aircraft to support growth (3)
  • 22. 1.2 2.5 2.8 3.1 6.5 8.9 7.7 0.0 5.0 10.0 2011 2012 2013 2014 2015 2016 LTM Mar 2017 (MXNbn) 22% 20% 17% 16% 11% 10% 9% 4% 2% 32% 32% 28% 26% 25% 22% 21% 20% 19% 8.9 11.7 13.0 14.0 18.2 23.5 24.0 5 15 25 2011 2012 2013 2014 2015 2016 LTM Mar 2017 (MXNbn)(MXNbn) (1) CAGR for 2012-2016 Source: Company data, airlines public information Revenue CAGR 2011 - 2016 High growth and solid financial performance Revenues 22 2011 – 2016 CAGR: +21.5% Adj. EBITDAR LTM March 2017 Adj. EBITDAR margin 2011 – 2016 CAGR: +48.3%
  • 23. 76% 74% 73% 69% 67% 24% 26% 27% 31% 33% 0% 25% 50% 75% 100% 2012 2013 2014 2015 2016 Domestic International Increasing international operation brings higher USD revenues Volaris’ international expansion has been key in constructing a better hedge for FX volatility 23 Volaris’ revenues breakdown, MXN billion (International revenues priced in USD) 11.7 13.0 14.0 18.2 23.5
  • 24. 2.0x 4.9x 5.3x 5.4x 5.4x 5.5x 6.0x 7.2x 9.4x 37% 29% 27% 16% 15% 11% 9% 7% 7% Strong balance sheet and liquidity, well funded for continued growth 24(1) Figures converted to USD at March 2017 end of the period spot exchange rate $18.81 for convenience purposes only Source: Company data, airlines public information • Unrestricted cash of $6.8 billion pesos (US$ 364 million(1)) as of March 31, 2017. • Net cash position of $4.8 billion pesos (US$ 255 million(1)) as of March 31, 2017. • Adjusted net debt to EBITDAR of 4.9x as of March 31, 2017. • Fully financed pre-delivery payments. • Expected 2017 net CAPEX (US$ 120 to - 140 million): • PDPs: from US$ 60 to 65 million, net of PDP reimbursements • Major maintenance: US$ 50 to 60 million • Other: from US$ 10 to 15 million Adj. net debt/EBITDAR Liquidity-cash and equivalents as a % of LTM Op. Revenue
  • 26. Fuel price protection 26 (1) Approximate percentage of gallons hedged as of May 1, 2017 Period Total % hedged(1) Avg. price (gal/USD$) Instrument 2Q17 55% $1.61 Call 3Q17 55% $1.44 Call 4Q17 55% $1.40 Call 1Q18 50% $1.63 Call 2Q18 50% $1.74 Call 3Q18 35% $1.79 Call 4Q18 25% $1.89 Call
  • 27. (1) Full year 2016 figures converted to USD at December end of the period spot exchange rate $20.6640 for convenience purposes only (2) 1Q 2017 figures converted to USD at March end of the period spot exchange rate $18.8092 for convenience purposes only (3) Audited financial information 2014A – 2016A Source: Company data Consolidated statements of operations summary MXN millions unless otherwise stated (3) 2014A 2015A 2016A 2016A (1) 1Q 2017 1Q 2017(2) % of total operating revenues (USD millions) (USD millions) Passenger 11,303 14,130 17,790 861 4,025 214 71.2 Non-ticket 2,733 4,049 5,722 277 1,631 87 28.8 Total operating revenues 14,037 18,180 23,512 1,138 5,656 301 100 Other operating income (22) (193) (497) (24) (1) - - Fuel 5,364 4,721 5,741 278 1,892 101 33.5 Aircraft and engine rent expenses 2,535 3,525 5,590 271 1,699 90 30.0 Landing, take off and navigation expenses 2,066 2,595 3,272 158 1,035 55 18.3 Salaries and benefits 1,577 1,903 2,420 117 696 37 12.3 Sales, marketing and distribution expenses 817 1,089 1,413 68 358 19 6.3 Maintenance expenses 665 875 1,344 65 351 19 6.2 Other operating expenses 490 698 952 46 269 14 4.8 Depreciation and amortization 343 457 537 26 128 7 2.3 Total operating expenses 13,833 15,669 20,773 1,005 6,428 342 113.7 6 EBIT 204 2,510 2,740 133 (772) (41) (13.7) Operating margin (%) 1.5 13.8 11.7 11.7 (13.7) (13.7) Finance income 23 47 103 5 21 1 0.4 Finance cost (32) (22) (35) (2) (21) (1) (0.4) Exchange gain (loss), net 449 967 2,170 105 (1,145) (61) (20.2) Income tax (expense) benefit (39) (1,038) (1,457) (71) 556 30 9.8 Net income (loss) 605 2,464 3,519 170 (1,361) (72) (24.1) Net margin (%) 4.3 13.6 15.0 15.0 (24.1) (24.1) Adjusted EBITDAR 3,081 6,492 8,866 429 1,055 56 18.7 Adj. EBITDAR margin (%) 22.0 35.7 37.7 37.7 18.7 18.7 EPS Basic and Diluted (Pesos) 0.60 2.43 3.48 0.17 (1.34) (0.07) EPADS Basic and Diluted (Pesos) 5.98 24.35 34.78 1.68 (13.45) (0.71) 27
  • 28. Consolidated statements of financial position summary (1) Full year 2016 figures converted to USD at December end of the period spot exchange rate $20.6640 for convenience purposes only (2) Net debt = financial debt - cash and cash equivalents (3) Adjusted debt = (LTM aircraft rent expense x 7) + financial debt (4) Adjusted net debt = adjusted debt - cash and cash equivalents (5) Audited financial information 2014A – 2016A (6) Certain amounts related to prepaid income tax and guarantee deposits, presented in the consolidated statement of financial position have been reclassified in 2015A, in order to be comparative with the classification between current and non-current assets presented during 2016A (7) 1Q 2017 figures converted to USD at March end of the period spot exchange rate $18.8092, respectively, for convenience purposes only Source: Company data MXN millions unless otherwise stated (5) 2014A 2015A(6) 2016A 2016A (1) 1Q 2017 1Q 2017(7) (USD millions) (USD millions) Cash and cash equivalents 2,265 5,157 7,071 342 6,839 364 Current guarantee deposits 545 873 1,167 56 1,067 57 Other current assets 879 1,193 3,313 160 3,039 162 Total current assets 3,689 7,224 11,551 559 10,945 582 Rotable spare parts, furniture and equipment, net 2,223 2,550 2,525 122 2,751 146 Non-current guarantee deposits 3,541 4,693 6,560 317 5,992 319 Other non-current assets 452 765 1,146 55 1,011 54 Total assets 9,905 15,232 21,782 1,054 20,698 1,100 Unearned transportation revenue 1,421 1,957 2,154 104 2,987 159 Short-term financial debt 823 1,371 1,051 51 1,150 61 Other short-term liabilities 2,524 3,745 4,683 227 4,938 263 Total short-term liabilities 4,768 7,073 7,888 382 9,075 482 Long-term financial debt 425 220 943 46 885 47 Other long-term liabilities 242 1,113 2,157 104 1,516 81 Total liabilities 5,435 8,407 10,988 532 11,476 610 Total equity 4,470 6,825 10,794 522 9,222 490 Total liabilities and equity 9,905 15,232 21,782 1,054 20,698 1,100 Net debt (2) (1,017) (3,566) (5,077) (246) (4,804) (255) Adjusted debt (3) 18,990 26,268 41,125 1,990 44,523 2,367 Adjusted net debt (4) 16,725 21,111 34,053 1,648 37,685 2,004 28
  • 29. Consolidated statements of cash flows summary (1) Full year 2016 figures converted to USD at December end of the period spot exchange rate $20.6640 for convenience purposes only (2) 1Q 2017 figures converted to USD at March end of the period spot exchange rate $18.8092 for convenience purposes only (3) Audited financial information 2014A – 2016A Source: Company data MXN millions unless otherwise stated (3) 2014A 2015A 2016A 2016A (1) 1Q 2017 1Q 2017(2) (USD millions) (USD millions) Cash flow from operating activities Income (loss) before income tax 644 3,502 4,977 241 (1,916) (102) Depreciation and amortization 343 457 537 26 128 7 Guarantee deposits (695) (1,165) (1,957) (95) 380 20 Unearned transportation revenue 27 536 196 10 834 44 Changes in working capital and provisions 14 (261) (2,773) (134) 1,043 56 Net cash flows provided by operating activities 334 3,070 979 47 469 25 Cash flow from investing activities Acquisitions of rotable spare parts, furniture, equipment and intangible assets (1,603) (1,456) (2,259) (109) (444) (24) Pre-delivery payments reimbursements 396 670 1,733 84 - - Proceeds from disposals of rotable spare parts, furniture and equipment 22 185 498 24 101 5 Net cash flows used in investing activities (1,185) (601) (28) (1) (342) (18) Cash flow from financing activities Treasury shares purchase (7) - (17) (1) - - Proceeds from exercised stock options - 23 20 1 - - Interest paid (23) (42) (39) (2) (20) (1) Other finance costs (11) (40) (138) (7) - - Payments of financial debt (400) (801) (1,531) (74) (287) (15) Proceeds from financial debt 966 925 1,716 83 481 26 Net cash flows provided by financing activities 525 65 11 1 174 9 (Decrease) increase in cash and cash equivalents (326) 2,533 962 47 300 16 Net foreign exchange differences 141 359 952 46 (533) (28) Cash and cash equivalents at beginning of period 2,451 2,265 5,157 250 7,071 376 Cash and cash equivalents at end of period 2,265 5,157 7,071 342 6,839 364 29
  • 30. Adj. EBITDA and Adj. EBITDAR reconciliation (1) Full year 2016 figures converted to USD at December end of the period spot exchange rate $20.6640 for convenience purposes only (2) 1Q 2017 figures converted to USD at March end of the period spot exchange rate $18.8092 for convenience purposes only (3) Audited financial information 2014A – 2016A Source: Company data MXN millions unless otherwise stated (3) 2014A 2015A 2016A 2016A(1) 1Q 2017 1Q 2017(2) (USD millions) (USD millions) Net income (loss) 605 2,464 3,519 170 (1,361) (72) Plus (minus): Finance costs 32 22 35 2 21 1 Finance income (23) (47) (103) (5) (21) (1) (Benefit)/provision for income taxes 39 1,038 1,457 71 (556) (30) Depreciation and amortization 343 457 537 26 128 7 EBITDA 995 3,934 5,446 264 (1,789) (95) Exchange (gain) loss, net (449) (967) (2,170) (105) 1,145 61 Adjusted EBITDA 547 2,967 3,276 159 (644) (34) Aircraft and engine rent expense 2,535 3,525 5,590 271 1,699 90 Adjusted EBITDAR 3,081 6,492 8,866 429 1,055 56 30