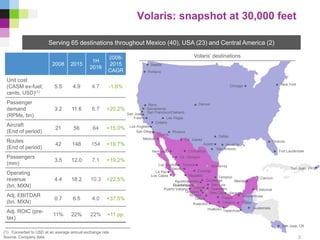
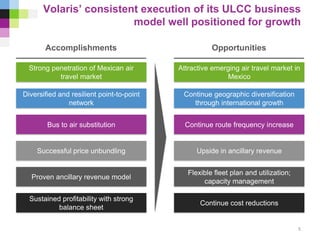
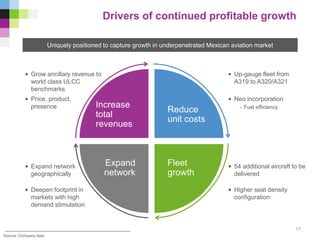
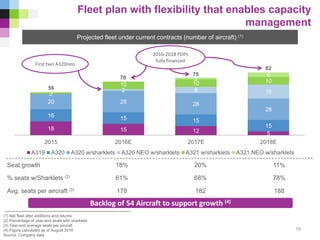
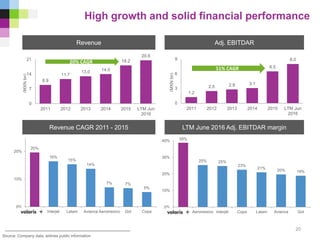
Volaris is the leading ultra-low-cost airline in Mexico, serving 65 destinations in Mexico, the United States, and Central America. It has a young and fuel efficient fleet of 64 aircraft that enable it to have the lowest unit costs in the Americas. Volaris has experienced strong growth over the past years through capacity increases, network expansion, and stimulating demand through low base fares and ancillary revenues. It is well positioned for continued profitable growth by further reducing costs, expanding its fleet and network, and increasing total revenues.
The above document is the marketing brochure for TEDxBITSGoa 2012, prepared by Sarthak Pranit and I.
TEDxBITSGoa is an independently organized TED event. Theme of 2012 edition is- "This is my Story". The event is being conducted on the 19th February, 2012 in BITS Pilani KK Birla Goa Campus. To know more about the event, please log on to: www.tedxbitsgoa.com
For an introduction with Sarthak, please drop me a mail at: neil[dot]r[dot]merchant[at]gmail[dot]com
Snam 2023-27 Industrial Plan - Financial Presentation
Volaris corporate presentation august 2016
1. Volaris: the leading ultra-low-cost airline
serving Mexico, USA and Central America
August 2016
2. The information ("Confidential Information") contained in this presentation is confidential and is provided by
Controladora Vuela Compañía de Aviación, S.A.B. de C.V., (d/b/a Volaris, the "Company") confidentially to you solely
for your reference and may not be retransmitted or distributed to any other persons for any purpose whatsoever.
The Confidential Information is subject to change without notice, its accuracy is not guaranteed, it has not been
independently verified and it may not contain all material information concerning the Company. Neither the Company,
nor any of their respective directors makes any representation or warranty (express or implied) regarding, or
assumes any responsibility or liability for, the accuracy or completeness of, or any errors or omissions in, any
information or opinions contained herein. None of the Company nor any of their respective directors, officers,
employees, stockholders or affiliates nor any other person accepts any liability (in negligence, or otherwise)
whatsoever for any loss howsoever arising from any use of this presentation or its contents or otherwise arising in
connection therewith. No reliance may be placed for any purposes whatsoever on the information set forth in this
presentation or on its completeness.
This presentation does not constitute or form part of any offer or invitation for sale or subscription of or solicitation or
invitation of any offer to buy or subscribe for any securities, nor shall it or any part of it form the basis of or be relied
on in connection with any contract or commitment whatsoever. Recipients of this presentation are not to construe the
contents of this presentation as legal, tax or investment advice and should consult their own advisers in this regard.
This presentation contains statements that constitute forward-looking statements which involve risks and
uncertainties. These statements include descriptions regarding the intent, belief or current expectations of the
Company or its officers with respect to the consolidated results of operations and financial condition, and future
events and plans of the Company. These statements can be recognized by the use of words such as "expects,"
"plans," "will," "estimates," "projects," or words of similar meaning. Such forward-looking statements are not
guarantees of future performance and actual results may differ significantly from those in the forward-looking
statements as a result of various factors and assumptions. You are cautioned not to place undue reliance on these
forward looking statements, which are based on the current view of the management of the Company on future
events. The Company does not undertake to revise forward-looking statements to reflect future events or
circumstances.
Disclaimer
2
3. Serving 65 destinations throughout Mexico (40), USA (23) and Central America (2)
Volaris’ destinations
(1) Converted to USD at an average annual exchange rate
Source: Company data
2008 2015
1H
2016
2008-
2015
CAGR
Unit cost
(CASM ex-fuel;
cents, USD)(1)
5.5 4.9 4.7 -1.6%
Passenger
demand
(RPMs, bn)
3.2 11.6 6.7 +20.2%
Aircraft
(End of period)
21 56 64 +15.0%
Routes
(End of period)
42 148 154 +19.7%
Passengers
(mm)
3.5 12.0 7.1 +19.2%
Operating
revenue
(bn, MXN)
4.4 18.2 10.3 +22.5%
Adj. EBITDAR
(bn. MXN)
0.7 6.5 4.0 +37.5%
Adj. ROIC (pre-
tax)
11% 22% 22% +11 pp.
3
Portland
Reno
Sacramento
San Francisco/OaklandSan Jose
Fresno
Ontario
Los Angeles
San Diego
Las Vegas
Phoenix
Denver
Dallas
Houston
San Antonio
Chicago New York
Orlando
Fort Lauderdale
Tijuana
Mexicali
La Paz
Los Cabos
Hermosillo
Cd. Juarez
Chihuahua
Cd. Obregon
MonterreyLos Mochis Torreon
Culiacan
Mazatlan
Durango
Tampico
Zacatecas
San Luis
Aguascalientes
Guadalajara
Puerto Vallarta Leon
Uruapan
Morelia
Queretaro
Mex.City
Toluca
Veracruz
Acapulco
Huatulco Tapachula
Puebla
Oaxaca Tuxtla
Villahermosa
Chetumal
Cancun
Merida
Guatemala
San Jose, CR
San Juan, PR
Austin
Seattle
Volaris: snapshot at 30,000 feet
4. Volaris’ flight path for demand stimulation and
continued growth
Capacity
increase
Cost
reduction
“Clean”,
low
base
fares
More
customers
More
ancillaries
(“You decide”)
Resilient ULCC
business model
driving high,
profitable growth
4
5. Volaris’ consistent execution of its ULCC business
model well positioned for growth
Diversified and resilient point-to-point
network
Successful price unbundling
Strong penetration of Mexican air
travel market
Proven ancillary revenue model
Bus to air substitution
Upside in ancillary revenue
Continue geographic diversification
through international growth
Attractive emerging air travel market in
Mexico
Flexible fleet plan and utilization;
capacity management
Sustained profitability with strong
balance sheet
Continue cost reductions
Continue route frequency increase
OpportunitiesAccomplishments
5
7. 4.7
10.6
8.0 7.9
7.1
6.0 6.2
4.7
8.5
5.7 5.6
10.5
1.7
2.5
2.2 2.0
2.1
2.5 2.3
1.4
2.4
1.8 1.7
1.9
(1) Based on CASM among the publicly-traded airlines
(2) Non-USD data converted to USD at an average exchange rate
(3) DCOMPS= Direct Competitors: Average CASM and CASM ex-fuel; US network carriers include: Delta, United, Alaska Airlines and American Airlines
(4) As of June 30, 2016
Source: Company data, airlines public information
Volaris has a best-in-class unit cost structure
Lowest unit cost in the Americas (1)
CASM and CASM ex-fuel (1H 2016, USD cents) (2) Cost structure
7
• Economies of scale
- Dilute fixed costs
- High seat density
• Young and fuel efficient fleet
- Sharklet rollout
- Average age of 4.5 years (4)
- Low fuel burn
• Productive network
- Point-to-point
- No connections complexity
• High aircraft utilization
- On average 12.7 block hours a day
during 1H 2016
Latin American carriers US LCCs US network
carriers (3)
Continued cost improvement
potential
In line with best-in-class
ULCCs
6.4
13.1
10.2 9.9
9.3
8.6 8.5
10.9
7.6
7.3
12.5
6.1
8. . Spirit Allegiant Copa Gol Interjet Aeromexico Latam Southwest US network
carriers
Avianca
Volaris’ cost structure enables us to lower base
fares and increase ancillaries
Volaris’ TRASM is below most competitors’ CASM (1)
TRASM and CASM (1H 2016, USD cents) (2)
8
Volaris’ resilient ULCC
model
TRASM
CASM
CASM
CASM
CASM
CASM
CASM
CASM
CASM
CASM
CASM
7.3 7.3 7.6
8.5 8.6
9.3
9.9 10.2
10.9
12.5
13.1
(1) Based on CASM and TRASM among the publicly-traded airlines
(2) Non-USD data converted to USD at an average exchange rate
(3) US network carriers direct competitors include: Delta, United, Alaska Airlines and American Airlines
Source: Company data, airlines public information
Overlap:
2
5
%
(3)
9. 142
204 211
279
338 353
2011 2012 2013 2014 2015 LTM Jun
2016
Non-ticket revenues continue to grow, with
upside potential
(1) Mexican legislation does not allow to charge for the first bag
(2) Converted to USD using an average exchange rate for the period
Source: Company data, airlines public information
Non-ticket revenue per passenger
Volaris(MXN) per passenger
Best-in class ULCCs, including first bag fee (1)
(1H 2016, USD per passenger) (2)
2009 – 2015 CAGR: +23.7%
2.5x
Ancillaries
• Apply revenue management techniques
- Pricing by route, season, day
- Fully dynamic pricing for some products
• Add products
- New products & services
- Enhancements to existing products
• Improve presence
- More touch-points to sell ancillaries
throughout the journey
- Allow customization
• Benefit from network diversification
- More international capacity
Increasing non-ticket revenue allows to
reduce fare further and stimulate
demand
9
20
30
50 52
Volaris Wizz Allegiant Spirit
10. Network enhancement: connecting the dots and
diversifying further
Note: Excludes routes and stations announced to start operations in 2H16.
New routes
Domestic International
Cancun +1 +2
Guadalajara +1 +2
Mexico City +5
Other +5 +3
Tijuana
Total +12 +7
New stations
USA Mexico Central America
San Juan, PR Chetumal San Jose, CR
New York Zihuatanejo
Reynosa
June LTM, Volaris diversified its network by opening 19 routes and 6 stations
Volaris’ LTM new routes
New International
New Domestic
10
11. …supporting strong capacity growth
Joining existing airports
Additional frequencies
New airports
19.3%
3.0%
1.2%
Total ASM growth
1H 2016 capacity growth contribution (yoy)
23.5%
Our network is well positioned for diversified growth
=
+
+
+
11
Source: Company data
13. 24
39
18
27
6
12
2010 2011 2012 2013 2014 2015 LTM Jun 2016
Domestic USA Other international
Yoy growth 3.3% 4.0% 8.3% 8.3% 8.3% 12.3% 12.2%
GDP growth 5.1% 4.0% 3.8% 1.7% 2.1% 2.5% 2.3%
GDP multiplier 0.6 1.0 2.2 5.0 3.9 4.9 5.3
In recent years, volume growth has been robust
despite challenging economic environment
(1) LTM June 2015 vs. LTM June 2016 growth
(2) GDP growth expectations from Banxico July’s survey
Source: DGAC-SCT; INEGI; Banco de México
Mexico passenger market volume has increased since 2010
50 52
57
61
67
75
Passenger volume (millions)
CAGR:
8.2%
13
78
(1)
(2)
14. (1) WB= wide body, NB= narrow body and RJ= regional jet
(2) Only domestic market
(3) Only Mexican carriers
Source: DGAC, Diio Mi, Banco de México
2.8%
8.2%
8.8%
0%
1%
2%
3%
4%
5%
6%
7%
8%
9%
10%
GDP Passengers RPMs
…and supply has met the strong market demand
DemandSupply (WB + NB + RJ) (1)
2.9x GDP
4.9%
6.5%
7.2%
0%
2%
4%
6%
8%
10%
12%
Fleet seats Aircraft ASMs
2010-2015 Capacity growth (CAGR) 2010-2015 Demand growth (CAGR)
(2) (2)
14
(3)
15. (1) Minimum stage length of 170 miles
(2) Minimum stage length of 200 miles; CAM stands for Central America; SAM stands for South America
(3) South and northbound leisure routes
(4) Figures calculated as of September 2015
(5) Data from ALTA Yearbook 2014
Source: Company data, SCT-DGAC and DIIO MI Market Intelligence for the Aviation Industry; ALTA
0
10
20
30
40
50
0
25
50
75
100
USA (Leisure) USA (VFR) CAM, SAM,
Canada,
Caribbean
Significant untapped opportunities
Domestic – growth potential of approx. 120
routes (4)
International – growth potential of approx.130
routes (4)
(3)
Number of routes (1)
Number of routes (2)
Routes served Growth potential
15
In terms of air trips per capita Mexico has plenty potential to grow
2014 air trips per capita(5)
2.05
0.55 0.45 0.42
0.27 0.25 0.21
0.04 0.01
USA Chile Brazil Colombia Peru Mexico Argentina Costa Rica Paraguay
16. 2012 2015
First, economy and
other
Exectutive and LuxuryExecutive and Luxury
ULCC model
First sell
Trial
Ticket giveaway
#Nomáscamión
Strong conversion
rate
Volaris contributed by stimulating demand from
bus to air substitution
Source: Company data, Secretaría de Comunicaciones y Transportes (SCT), Dec. 2014
Bus switching programSignificant upside for air travel
Total air travel passengers
in Mexico (mm)
Total bus passengers
in Mexico (mm)
2,758
33
Mass media campaigns
Digital capabilities
Attracting 1st
time flyers
16
Education
2,918
2,683 2,834
74 79
28 37
27
38
2012 2015
Domestic
International
55
75
17. Drivers of continued profitable growth
Uniquely positioned to capture growth in underpenetrated Mexican aviation market
Reduce
unit costs
Fleet
growth
Expand
network
Increase
total
revenues
• Deepen footprint in
markets with high
demand stimulation
• Grow ancillary revenue to
world class ULCC
benchmarks
• 54 additional aircraft to be
delivered
• Up-gauge fleet from
A319 to A320/A321
• Higher seat density
configuration
• Expand network
geographically
Source: Company data
• Neo incorporation
- Fuel efficiency
17
• Price, product,
presence
19. 18 15 12 5
16 15 15
15
20 28 28
28
0
2 8 182
10 10 10
0
0
2
6
2015 2016E 2017E 2018E
A319 A320 A320 w/sharklets A320 NEO w/sharklets A321 w/sharklets A321 NEO w/sharklets
Fleet plan with flexibility that enables capacity
management
Projected fleet under current contracts (number of aircraft) (1)
(1) Net fleet after additions and returns
(2) Percentage of year-end seats with sharklets
(3) Year-end average seats per aircraft
(4) Figure calculated as of August 2016
Source: Company data
Backlog of 54 Aircraft to support growth (4)
Seat growth
% seats w/Sharklets (2)
18%
61%
20%
68%
11%
78%
Avg. seats per aircraft (3) 178 182 188
70
75
82
56
2016-2018 PDPs
fully financed
First two A320neo
19
20. 39%
25% 25%
23%
21%
20% 19%
0%
10%
20%
30%
40%
Aeromexico Interjet Copa Latam Avianca Gol
Source: Company data, airlines public information
1.2
2.5 2.8 3.1
6.5
8.0
0
3
6
9
2011 2012 2013 2014 2015 LTM Jun
2016
(MXNbn)
8.9
11.7
13.0 14.0
18.2
20.6
0
7
14
21
2011 2012 2013 2014 2015 LTM Jun
2016
(MXNbn)
Revenue CAGR 2011 - 2015 LTM June 2016 Adj. EBITDAR margin
High growth and solid financial performance
Revenue Adj. EBITDAR
20
20% CAGR
51% CAGR
20%
16%
15%
14%
7% 7%
5%
0%
10%
20%
Interjet Latam Avianca Aeromexico Gol Copa
21. 3.0x 3.2x
4.7x
5.9x 6.3x
7.5x 7.6x
36%
34%
15% 14% 13%
10% 8%
Strong balance sheet and liquidity, well funded
for continued growth
21(1) Figures converted to USD at June end of the period spot exchange rate $18.91 for convenience purposes only
Source: Company data, airlines public information
• Unrestricted cash of $6.9 billion pesos (US$
366 million(1)) as of June 30, 2016.
• Net cash position of $6.1 billion pesos (US$
323 million(1)) as of June 30, 2016.
• Adjusted long term net debt to EBITDAR of
3.2x as of June 30, 2016.
• Fully financed pre-delivery payments
through 2018 and executed sale-
leasebacks for 2016 deliveries.
• Expected 2016 net CAPEX neutral (US$ 0
to -10 million):
• PDPs: from US$ -50 to -45 million,
net of PDP reimbursements (8 aircraft
order book deliveries)
• Major maintenance: US$ 25 to 35
million
• Other: from US$ 10 to 15 million
Adj. net debt/EBITDAR
LTM liquidity-cash and equivalents as a % of LTM Op. Revenue