Download to read offline


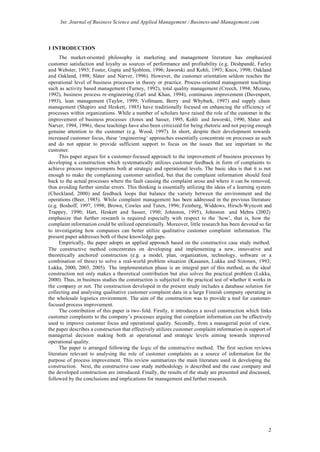
![Int. Journal of Business Science and Applied Management / Business-and-Management.com
was identified as shortage of skill, the warehouse manager could rotate the employee to other duties
more suitable to their skills or initiate further training.
Moreover, as positive feedback was recorded in a similar manner as complaints, the warehouse
management adopted the habit of reviewing also this information and giving feedback to employees on
their successful efforts that had led to customer delight. This was perceived to have very positive
effects to employee satisfaction and thus employee attitudes in terms of Figure 1.
“We do help some “begging” customers occasionally to get their stuff delivered next day,
although they have actually ordered too late in the afternoon to get next day delivery. It felt quite
nice that my boss [Transport Manager] actually said that the customer had thanked us because I
was still able to get his goods into the truck. Never thanked me for that sort of thing before. It
seemed to be important for the customer to get the ordered pipes next day, so I did a little extra
work, because of the hassle the customer would have otherwise had at his construction site.” (A
transport co-ordinator, August 2002)
Strategic level
At the strategic level, the logistics management became more interested in utilizing customer
complaint information with the implementation of the construction and started to review and analyse
complaint data regularly, on a monthly and annual basis.
“Analysing the data seems to become more and more interesting as the size of the database
grows. The database now has five months’ data, and it’s becoming quite interesting to play with
the data in Access, and see whether anything new comes out. I can hardly wait until we can start
looking at the data on an annual basis, when I expect we can better see the spread of different error
types and can evaluate their cost effects and use that for improving our operations.” (Logistics
Manager, August 2002)
“I have always believed that customer information is a key for achieving a new kind of, even
strategic competitive advantage. However, I often wondered what is the relevant information we
ought to get from the customer, and how we should go about getting that information. These
customer satisfaction questionnaires we send out seem, from the perspective of improving
logistics, rather useless. With regard to this new customer feedback construction, I was not
convinced at the beginning that complaints information is a sensible source of customer
information. I didn’t believe that it generates enough data for a reliable and systematic analysis.
However, as it seems now, our large volumes cause a large number of complaints, even though
they are relatively few proportionally [given the total volume]. A careful handling of customer
feedback creates a surprising amount of useful and interesting data.” (Director of Logistics,
November 2002)
By investigating and analysing the data in the long run, the top logistics management could
identify trends and larger issues in the delivery process. This led to a further investigation concerning
the potential for redesigning parts of the delivery process. For example, the logistics management
initiated discussions with the transport partners aiming to reduce the number of errors occurring when
goods are transported from the warehouse to the customer’s premises.
“I meet with all our transport partners once a month to evaluate and go through current issues and
ponder about how to develop operations and cooperation. Before the latest meeting with one of the
transporters, I filtered out from the system all the errors that, according to the system, they had
caused and sent them the list a couple of days beforehand. It was quite a confusion and surprise for
both of us, as we both claimed that we were innocent and that the other party was solely
responsible for the mistakes. However, the uniform reporting of errors created an intensive and
productive dialogue. Already during the first meeting we found a problem spot in the delivery
process, which we obviously decided to fix as quickly as possible. I am going to do the same thing
with all of our transport partners.” (Transport Manager, October 2002)
Numerous small changes in the warehouse operations were implemented during the observed
period. As the construction continues to be in use, more will be done every month. In principle these
changes, if correctly implemented, should lead to better operations, improvement in quality and
reduction in the number of complaints. While it was not within the scope of this study to measure the
8](https://image.slidesharecdn.com/vol3-issue11-130220075839-phpapp02/85/Vol3-issue1-1-9-320.jpg)

This document summarizes a study that developed a construction to utilize customer complaint data for process improvement at a large wholesale logistics company. The construction included a database to collect and analyze qualitative customer complaint information. The implementation of the construction provided benefits at both operational and strategic levels. It allowed the company to identify systematic errors, track the root causes, and make improvements to avoid future complaints. This led to improved operational quality and customer satisfaction over time.


![[Jennifer]Summary of the paper about Quality management into the supply chain...](https://cdn.slidesharecdn.com/ss_thumbnails/jenniferpresentationforthepaperextensionofqualitymanagementintothesupplychain25032014-140516085131-phpapp01-thumbnail.jpg?width=640&height=640&fit=bounds)


