SlideShare a Scribd company logo
1 of 10
Download to read offline
Water Use Analysis and Water Intensity Comparison
Stephen Goodwin
Department of Civil and Environmental Engineering
Colorado State University
Basic Water and Energy Use Model
Formation
Oil Gas Water
Drilling
Water
Hydraulic
Fracturing
Water
Flowback
Water
Produced
Water
Deep
Well
Injection
Oil
Recovered
Gas
Recovered
Drilling
Energy
Hydrualic
Fracturing
Energy
Transportation
Energy
Water Reuse Model
Water
Treatment
Drilling
Water
Hydraulic
Fracturing
Water
Flowback
Water
Produced
Water
Formation
Oil Gas Water
Drilling
Energy
Hydrualic
Fracturing
Energy
Oil
Recovered
Gas
Recovered
Transportation
Energy
Deep
Well
Injection
Water
Reuse
Treatment
Energy
1
2
3
Water Intensity
Drilling
Water
Hydraulic
Fracturing
Water
Flowback
Water
Produced
Water
Formation
Oil Gas Water
Deep
Well
Injection
Drilling
Energy
Hydrualic
Fracturing
Energy
Oil
Recovered
Gas
Recovered
Water
Treatment
Water
Reuse
Treatment
Energy
Water Intensity
Transportation
Energy Water
Intensity
Net Water Consumed (Gallons)
Net Energy Recovered (MMBtu)
=
Reducing Water Intensity
Optimize water management with
transportation, piping, and locating permanent
and mobile treatment facility.
(Ashwin Dhanasekar)
Temporal and spatial characterization of
flowback and produced water quality and
volumes to determine what water can be
treated. (Bing Bai)
Optimize treatment approaches and dilution
with modeling and bench-scale testing.
(Ryan Hutcherson and Nasim Esmaeilirad)
Reduce water use for drilling and hydraulic
fracturing
Reduce energy use for drilling and hydraulic
fracturing
Increase energy recovery
CSU’s Center for Energy
Water Sustainability Research
Other Possibilities Indirectly
Addressed by CSU Research
How much water is required
to drill and hydraulically
fracture a well in Northern
Colorado?
4
5
6
Water Use: Sampling
WELD
LARIMER
ADAMS
MORGAN
BOULDER
ARAPAHOE
JEFFERSON
GILPIN
DENVER
CLEAR CREEK
GRAND
BROOMFIELD
Legend
Extended horizontal wells sampled
Horizontal wells sampled
Vertical wells sampled
Wattenberg Field (as defined by the COGCC on July 1, 2013)
WELD
LARIMER
ADAMS
MORGAN
BOULDER
ARAPAHOE
JEFFERSON
GILPIN
DENVER
CLEAR CREEK
GRAND
BROOMFIELD
Legend
Extended horizontal wells sampled
Horizontal wells sampled
Vertical wells sampled
Wattenberg Field (as defined by the COGCC on July 1, 2013)
ADAMS
MORGAN
BOULDER
ARAPAHOE
JEFFERSON
GILPIN
DENVER
CLEAR CREEK
GRAND
BROOMFIELD
Legend
Extended horizontal wells sampled
Horizontal wells sampled
Vertical wells sampled
Wattenberg Field (as defined by the COGCC on July 1, 2013)
ADAMS
MORGAN
BOULDER
ARAPAHOE
JEFFERSON
GILPIN
DENVER
CLEAR CREEK
GRAND
BROOMFIELD
Legend
Extended horizontal wells sampled
Horizontal wells sampled
Vertical wells sampled
Wattenberg Field (as defined by the COGCC on July 1, 2013)
decisions regarding future water and energy development. The
objective of this study is to provide a detailed assessment of
current water use and to determine the factors that have the
strongest influence on the total water use per well. These factors
include the well type (vertical, horizontal, or extended horizon-
tal), number of hydraulic fracturing stages, water use (drilling
or hydraulic fracturing), temporal, and spatial distribution.
2. Method
The wells included in the water use analysis are limited to
wells located in the Wattenberg field, drilled between January
1, 2010 to July 1, 2013, and operated by Noble Energy, Inc.
(Noble) with complete water use records available. For this
study, the Wattenberg field is defined by the Colorado Oil Gas
Conservation Commission’s (COGCC) GIS shape file accessed
on July 1, 2013 (Figure 1). To best assess current water require-
ments and predict future demands only wells drilled after 2010
are included in the study. Noble is the largest operator in the
Wattenberg field.
WELD
LARIMER
ADAMS
MORGAN
BOULDER
ARAPAHOE
JEFFERSON
GILPIN
DENVER
CLEAR CREEK
GRAND
BROOMFIELD
Legend
Extended horizontal wells sampled
Horizontal wells sampled
Vertical wells sampled
Wattenberg Field (as defined by the COGCC on July 1, 2013)
WELD
LARIMER
ADAMS
MORGAN
BOULDER
ARAPAHOE
JEFFERSON
GILPIN
DENVER
CLEAR CREEK
GRAND
BROOMFIELD
Legend
Extended horizontal wells sampled
Horizontal wells sampled
Vertical wells sampled
Wattenberg Field (as defined by the COGCC on July 1, 2013)
Figure 1: The spatial distribution of sampled wells used in this study. Sampled
vertical wells are shown in green, sampled horizontal wells are shown in blue,
and extended horizontal wells are shown in red. The Wattenberg field as defined
by the COGCC on July 1, 2013 is shown in tan.
A total of 1,227 wells are included (Table 1) and categorized
using: A) drilling water consumed; B) hydraulic water con-
sumed; C) total water consumed; D) well type (vertical, hor-
izontal, or extended horizontal); E) hydraulic fracturing stages
or distance; F) hydraulic fracturing fluid; G) well coordinates;
H) year; and I) target formation, if available.
Water use is categorized as either drilling or hydraulic frac-
turing water. Water used to drill the well, prepare the borehole,
Table 1: The count of sampled wells separated by year and well type.
Vertical Horizontal Extended horizontal
2010 181 6 0
2011 408 69 0
2012 227 196 2
2013 5 120 13
Total 821 391 15
and set the casings is defined as drilling water. Water used to
fracture the shale, carry the proppant, and flush the well is de-
fined as hydraulic fracturing water.
Drilling and hydraulic fracturing water consumption records
for each well are collected using Noble Energy’s WellView
software [9] and separated by year. WellView is part of the
Peloton suite of software used for collecting and organizing oil
field data. Drilling and hydraulic fracturing reports are added
to WellView by a Noble employee that is on-location at each
drilling and hydraulic fracturing site. The water consumption
totals are verified by Noble Energy’s accounting department
and any conflict of values between the field operations and the
accounting department are reconciled in WellView. The wa-
ter use data was downloaded from Noble Energy’s WellView
software on July 1, 2013. The drilling and hydraulic fracturing
water use are summed, if both are available, to estimate the total
water consumed.
Wells are by separated by type (vertical, horizontal, or ex-
tended horizontal) using Noble’s well naming system or the
number of hydraulic fracturing stages, if available. Directional
and deviated wells are categorized as vertical wells for this
study because of similar water requirements. Horizontal wells
are separated from extended horizontal wells by Noble’s well
naming system or the number of hydraulic fracturing stages
used when available. A horizontal well will typically be hy-
draulically fractured in 20 stages. Recently, Noble has drilled
and hydraulically fractured longer horizontal wells that can in-
clude over 40 stages to hydraulically fracture. Horizontal wells
that require over 30 hydraulic fracturing stages are defined as
as extended horizontal wells in this study.
The type of hydraulic fracturing fluid used and the number
of hydraulic fracturing stages per well are collected from No-
ble Energy’s WellView software. The well coordinates, year,
and target formation are all collected COGCC’s online facili-
ties database.
An Anderson-Darling test [10] is used to test the normality
of each subset of data. The di↵erence between water use for
each subset of data is tested using a nonparametric Kruskal-
Wallis test. A Dunn- ˘Sid´ak post-hoc comparison [11] is used
to compare any di↵erences between samples that are found us-
ing the Kruskal-Wallis test. A 95% confidence interval is used
throughout the analysis. The number of hydraulic fracturing
stages is correlated using a simple linear regression. A coef-
ficient of determination is used to measure how well the re-
gression correlates the hydraulic fracturing water use and the
number of stages. Spatial autocorrelations are measured with
ArcGIS Spatial Analyst tool [12] using Moran’s I with inverse
2
0 2 4 6 8
0
0.1
0.2
0.3
0.4
0.5
0.6
0.7
0.8
0.9
Water use (million gallons)
Density
Total water use by well type
Vertical wells
Horizontal wells
Extended horizontal wellsdistance weighting and a 95% confidence interval.
942 wells have both drilling or hydraulic fracturing water
and are included in the study. Wells that are drilled but not
hydraulically fractured (260 sampled wells) are typically con-
ventional wells recovering from an oil and gas trap. Wells that
are hydraulically fractured but not drilled (25 sampled wells)
are typically existing wells that are reworked or restimulated
using hydraulic fracturing.
3. Results
A Kruskal-Wallis test reveals there is a significant di↵er-
ence between the median total water use for vertical, horizon-
tal, and extended horizontal wells ( 2
(2)=609, p<0.05). Dunn-
˘Sid´ak post-hoc comparisons of the total water for the three well
groups indicates that vertical wells (Mdn=360,000) use signif-
icantly less total water than either horizontal (Mdn=2,891,000)
or extended horizontal wells (Mdn=6,578,000). There is not a
significant di↵erence between the total water use between hor-
izontal and extended horizontal wells.
0 2 4 6 8
0
0.1
0.2
0.3
0.4
0.5
0.6
0.7
0.8
0.9
Water use (million gallons)
Density
Total water use by well type
Vertical wells
Horizontal wells
Extended horizontal wells
Figure 2: The distribution of drilling and hydraulic fracturing water use for ver-
tical, horizontal, and extended horizontal wells is illustrated with a histogram.
Vertical wells are shown in green, horizontal wells are shown in blue, and ex-
tended horizontal wells are shown in red.
Table 2: Descriptive statistics for total water use separated by well type.
Total Vertical Horizontal Extended horizontal
Q1 332,900 2,607,000 6,391,000
Q2 360,000 2,891,000 6,578,000
Q3 462,900 3,168,000 7,096,000
IQR 129,000 561,600 704,800
Skewness 9.1 2.9 -2.0
Kurtosis 99 20 5.0
Hydraulic fracturing uses the majority of the total water for
all of the well types. For vertical wells, a median value of 81%
(Q1=77%, Q3=85%) of the total water is used for hydraulic
fracturing. Horizontal and extended horizontal wells use a me-
dian value of 96% (Q1=95%, Q3=96%) and 98% (Q1=97%,
Q3=98%) for hydraulic fracturing, respectively.
The total water use for horizontal and extended horizon-
tal wells correlates (r2
=0.66) to the number of stages used to
hydraulically fracture each well (Figure 3). Wells defined as
horizontal wells (less than 30 stages) are shown in blue re-
gion and the wells defined as extended horizontal wells are
shown in the red region. A linear regression using a least-
squares linear fit is shown as a red line (Total water use in gal-
lons=156,000x(Number of stages)-144,000).
5 10 15 20 25 30 35 40 45
0
1
2
3
4
5
6
7
8
Number of hydraulic fracturing stages
Hydraulicfracturingwateruse(millionsofgallons)
Horizontal wells Extended
horizontal wells
Figure 3: A simple linear regression between the number of hydraulic fracturing
stages and the volume of hydraulic fracturing water used is shown with the red
line. Horizontal wells (less than 30 stages) are shown in the blue region and
extended horizontal wells are shown in the red region.
When the total water use for horizontal and extended hor-
izontal wells are normalized to the number of hydraulic frac-
turing stages, the distribution of the total water per hydraulic
fracturing stage is similar (Figure 4). When vertical wells are
normalized to the vertical distance of the hydraulic fracturing
there is not a correlation between the total water use (r2
=0.081)
or hydraulic fracturing water use (r2
=0.073).
Vertical wells are significantly influenced by the type of hy-
draulic fracturing fluid used. The normalized hydraulic fractur-
ing water use is significantly less for gelled fractures (Mdn=544
gallons per foot) than slickwater fractures (Mdn=1,340 gallons
per foot) for vertical wells ( 2
(1)=42.4, p<0.05). Horizontal
wells do not have enough slickwater data to compare gelled and
slickwater hydraulic fracturing water use.
Only the total water use for vertical wells shows any sig-
nificant temporal variation ( 2
(3)=13.09, p<0.05) . The to-
tal water use for vertical wells has decreased slightly from
2011 (Mdn=362,000) to 2012 (Mdn=352,000). Horizontal
( 2
(3)=6.03, p=.01103) or extended horizontal ( 2
(3)=2.45,
p=0.117) wells do not show any significant temporal variation.
The spatial distribution of the total water use is shown in Fig-
ure 6. Vertical wells are shown in green, horizontal wells are
3
Water Use0
1
2
3
4
5
6
7
8
Wateruse(milliongallons)
Drilling and hydraulic fracturing water by well type
Drilling
Hydraulic
fracturing
Drilling
Hydraulic
fracturing
Drilling
Hydraulic
fracturing
Vertical
wells
Horizontal
wells
Extended
horiozontal wells
Figure 7: The distribution of drilling and hydraulic fracturing water use for
vertical, horizontal, and extended horizontal wells. The interquartile range is
defined by the blue box, the median is defined by the red line, and outliers
extending beyond the 10th and 90th percentile are shown with red pluses.
Table 3: Descriptive statistics for drilling and hydraulic fracturing water use
separated by well type.
Drilling Vertical Horizontal Extended horizontal
Q1 62,160 94,500 148,300
Q2 74,760 116,300 180,800
Q3 89,040 140,700 202,300
IQR 26,880 46,240 54,020
Skewness 12 0.97 0.40
Kurtosis 240 2.3 0.54
Hydraulic Vertical Horizontal Extended horizontal
Fracturing
Q1 269,400 2,490,000 6,127,000
Q2 278,900 2,792,000 6,517,000
Q3 395,000 3,033,000 6,883,000
IQR 125,700 543,000 757,300
Skewness 9.2 2.9 -2.1
Kurtosis 100 20 5.3
continue to in the future Table 1.
The number of hydraulic fracturing stages should be the pri-
mary consideration when estimating the total water use of hor-
ter has remained constant or decreased slightly since 2010 for
both vertical and horizontal wells. The majority of wells target
the Niobrara formation and several vertical wells target multiple
formations including the Niobrara. The water use is not statis-
tically significant between target formations. Significant spatial
autocorrelations do not show any obvious spatial patterns.
The type of hydraulic fracturing fluid influences the volume
of water required to hydraulically fracture a vertical well. Hy-
draulic fracturing with slickwater requires nearly two times the
water per hydraulic fracturing distance than using gelled fluids.
It is also important to consider the volume of oil and gas
recovered for each well type when comparing the total water
use. Water use is often normalized to the amount of energy
recovered with the water and is defined as the water intensity.
This measure is an important value to consider for best water
management practices. Although extended horizontal wells use
the most water, it is likely they also recover much more oil and
gas. An analysis of the water intensity for each well in the
future will be important to optimizing water management.
This study did not include flowback or produced water es-
timates for each well. Flowback is the water that returns to
the surface before production. This water is characterized by
high solids content and closely resembles the hydraulic frac-
turing fluid. Produced water is the water that returns with the
oil and gas. This water is characterized by high concentrations
of salts and closely resembles the formation water. E↵orts are
being made to treat and reuse this water and further reduce the
demands on water resources. As water reuse becomes more
prevalent in the Wattenberg field, the net water use should be
considered.
The majority of the total water use for horizontal and ex-
tended horizontal wells consists of hydraulic fracturing water.
This results in large volumes of flowback water from horizon-
tal and extended horizontal wells. The impact of water reuse for
these wells becomes much more considerable than with vertical
wells.
5. Conclusions
As horizontal wells become more prevalent in the future, wa-
ter demand predictions should be based on the number of hy-
draulic fracturing stages rather than the number of wells. The
number of hydraulic fracturing stages can range from three to
45 and the total water use can vary from a few hundred thou-
sand gallons up to nearly eight million gallons per well. It is
a mistake to simply assume that all of the wells use a specific
volume of water, particularly as the lateral lengths of horizon-
tal wells are becoming longer to minimize surface impacts and
0
1
2
3
4
5
6
7
8
Wateruse(milliongallons)
Drilling and hydraulic fracturing water by well type
Drilling
Hydraulic
fracturing
Drilling
Hydraulic
fracturing
Drilling
Hydraulic
fracturing
Vertical
wells
Horizontal
wells
Extended
horiozontal wells
7
8
9
Spatial Distribution of Water Use
1Q: Horizontal wells
2Q: Horizontal wells
3Q: Horizontal wells
4Q: Horizontal wells
1Q: Vertical wells
2Q: Vertical wells
3Q: Vertical wells
4Q: Vertical wells
1Q: Extended horizontal wells
2Q: Extended horizontal wells
3Q: Extended horizontal wells
4Q: Extended horizontal wells
Spatial Autocorrelation
Spatially autocorrelated horizontal wells
Spatially autocorrelated vertical wells
Moran’s I used at 95 percent confidence interval
with inverse distance weighting
Total Water Use by Year
0
1
2
3
4
5
6
7
8
2010 2011 2012 2013
Vertical wells
Totalwateruse(milliongallons)
0
1
2
3
4
5
6
7
8
2010 2011 2012 2013
Horizontal wells
10
11
12
Water Use by Year
0
0.1
0.2
0.3
0.4
0.5
2010 2011 2012 2013
Drilling water
Vertical wells
Wateruse(milliongallons)
0
2
4
6
8
10
2010 2011 2012 2013
Hydraulic fracturing water
Vertical wells
0
0.1
0.2
0.3
0.4
0.5
2010 2011 2012 2013
Drilling water
Horizontal wells
Wateruse(milliongallons)
0
2
4
6
8
10
2010 2011 2012 2013
Hydraulic fracturing water
Horizontal wells
0
0.1
0.2
0.3
0.4
0.5
2010 2011 2012 2013
Drilling water
Horizontal wells
Wateruse(milliongallons)
0
2
4
6
8
10
2010 2011 2012 2013
Hydraulic fracturing water
Horizontal wells
Total Water Use Normalized by the
Number of Hydraulic Fracturing Stages
5 10 15 20 25 30 35 40 45
0
1
2
3
4
5
6
7
8
Number of hydraulic fracturing stages
Hydraulicfracturingwateruse(millionsofgallons)
Horizontal wells Extended
horizontal wells r2=0.66
Total Water Use Normalized by the
Number of Hydraulic Fracturing Stages
0 0.1 0.2 0.3 0.4
0
0.2
0.4
Density
Ratio of total water use and number of hydraulic fracturing stages
Extended horizontal wells
0 0.1 0.2 0.3 0.4
0
0.2
0.4
Total water use per hydraulic fracturing stage (million gallons)
Density
Horizontal wells
13
14
15
How efficiently is the
water used?
Water Intensity
Drilling
Water
Hydraulic
Fracturing
Water
Flowback
Water
Produced
Water
Formation
Oil Gas Water
Deep
Well
Injection
Drilling
Energy
Hydrualic
Fracturing
Energy
Oil
Recovered
Gas
Recovered
Water
Treatment
Water
Reuse
Treatment
Energy
Water Intensity
Transportation
Energy Water
Intensity
Net Water Consumed (Gallons)
Net Energy Recovered (MMBtu)
=
Water Use per Well (First Study, 2010-2011)
ydraulic Fracturing Water Total
0.00672 0.07224
0.0084 0.07392
0.00798 0.07476
0.01722 0.08274
0.0084 0.08484
0.00882 0.0861
0.01176 0.08694
0.00588 0.08694
0.0084 0.08694
0.01302 0.08736
0.0084 0.08736
0.0042 0.0882
0.01932 0.08883
0.00756 0.09072
0.00882 0.09618
0.051492 0.121212
0.057456 0.166026
0.112476 0.169596
0.11655 0.17241
0.11592 0.1911
0.15162 0.20916
0.147042 0.222222
0.156156 0.227976
0.166908 0.232428
0.148218 0.238308
0.155022 0.243852
0.244734 0.290934
0.227724 0.293244
0.11403 0.29463
0.22806 0.29715
0.241458 0.304458
0.271614 0.307314
0.270312 0.307692
0.27594 0.30954
0.251202 0.310632
0.273924 0.312144
0.271026 0.313866
0.250194 0.314454
0.273126 0.314706
0.27972 0.31479
0.275898 0.315588
0.230202 0.315882
0.270312 0.316512
0.267834 0.317814
0.275478 0.319788
0.264138 0.321678
0.2604 0.32256
0.273 0.32256
0.268254 0.322854
0.270186 0.323106
0.274848 0.323988
0.267456 0.326256
0.277872 0.326382
1
2
3
4
5
0 100 200 300 400
WaterConsumption(milliongallons)
Noble Well Water Consumption Ranking
Horizontal Drilling Water
Horizontal Hydraulic Fracturing Water
Vertical Drilling Water
Vertical Hydraulic Fracturing Water
(Gallons)
Drilling Water
Hydraulic
Fracturing Water
Total Water
(Gallons)(Gallons)(Gallons)
Horizontal
Well
Vertical
Well
129,000 2,720,000 2,840,000
76,800 305,000 382,000
445 NOBLE WELLS: 386 VERTICAL AND 59 HORIZONTAL
16
17
18
Water and Energy Consumption
0
0.5
1
1.5
2
2.5
3
3.5
Drilling Water Hydraulic Fracturing Water Total Water
WaterConsumed(MMgal)
Water Use for Sampled Wells
Student Version of MATLAB
Water Intensity
Drilling
Water
Hydraulic
Fracturing
Water
Flowback
Water
Produced
Water
Formation
Oil Gas Water
Deep
Well
Injection
Drilling
Energy
Hydrualic
Fracturing
Energy
Oil
Recovered
Gas
Recovered
Water
Treatment
Water
Reuse
Treatment
Energy
Water Intensity
Transportation
Energy Water
Intensity
Net Water Consumed (Gallons)
Net Energy Recovered (MMBtu)
=
Estimated Ultimate Recovery
15 20 25 30 35
32640 33290 33670 33910 34090 34220
52340 53630 54360 54850 55190 55450
61720 196880 225980 251270 273890 294490
97020 362300 416330 463290 505280 545550
Gas
Production
(mcf)
0 5 10 15 20 25 30 35
Low b=0.6
Median b=0.6
Median b=1.8
High b=1.8
0 175310 188140 193510 196580 198610 200060 201160
0 258790 276460 283840 288050 290820 292810 294320
0 583900 833900 1020700 1175400 1309800 1430100 1539700
0 930400 1399700 1754400 2049600 2306800 2537300 2747600
Gas
Production
(boe)
0 5 10 15 20 25 30 35
Low b=0.6
Median b=0.6
Median b=1.8
High b=1.8
0 29218 31357 32252 32763 33102 33343 33527
0 43132 46077 47307 48008 48470 48802 49053
0 97317 138983 170117 195900 218300 238350 256617
0 155067 233283 292400 341600 384467 422883 457933
15 20 25 30 35
32640 33290 33670 33910 34090 34220
19700 20340 20690 20940 21100 21230
09380 143250 171620 196420 218700 239040
35300 165420 190350 212020 231390 251060
0
100,000
200,000
300,000
0 5 10 15 20 25 30 35
Oil EUR of Sampled Wells
EstimatedUltimateRecovery(BOE)
Well Lifespan (Years)
Gas
Production
(boe)
Sectioned
0 5 10 15 20 25 30 35
Low b=0.6
Median b=0.6
Median b=1.8
High b=1.8
0 29218 31357 32252 32763 33102 33343 33527
0 13913 14720 15055 15245 15368 15458 15527
0 54185 92907 122810 147892 169830 189548 207563
0 57750 94300 122283 145700 166167 184533 201317
0 5 10 15 20 25 30 35
Gas EUR of Sampled Wells
Well Lifespan (Years)
Percentile Total
Energy
(BOE)
5th
50th
95th
1945
228
0
g
15 20 25 30 35
3790 3810 3830 3830 3840 3840
8500 8500 8500 8600 8600 8600
69170 83190 94790 104860 113860 120000
05400 367400 418600 463200 503000 539300
15 20 25 30 35
59180 160020 160860 160860 161280 161280
57000 357000 357000 361200 361200 361200
Flowback and
Produced
(gallons)
Sectioned
0 5 10 15 20 25 30 35
Low b=0.6
Median b=0.6
Median b=1.8
High b=1.8
132678 289758 291858 292698 293538 293538 293958 293958
132678 324198 330498 329658 328818 333018 332598 332598
132678 1898778 2680818 3269658 3756858 4175598 4553598 4811478
132678 7346178 10054338 12069498 13732698 15182958 16476558 17743278
Total (MMBtu) 0 5 10 15 20 25 30 35
Low b=0.6
Median b=0.6
Median b=1.8
High b=1.8
0 359981 382443 391732 397090 400568 403102 404986
0 551103 587279 602337 610892 616578 620593 623651
0 1263689 1793659 2189287 2516826 2801435 3056087 3288043
0 2169569 3158467 3901126 4517475 5053820 5533937 5983307
19
20
21
Estimated Ultimate Water Recovery
30 35
161280 161280
361200 361200
4782120 5040000
21126000 22650600
30 35
161280 161280
199920 199920
4420920 4678800
16343880 17610600
0
1,200,000
2,400,000
3,600,000
4,800,000
6,000,000
0 5 10 15 20 25 30 35
Flowback and Produced Water EUR of Sampled Wells
FlowbackandProducedWater(Gallons)
Well Lifespan (Years)
25 30 35
2826978 2826558 2826558
2626638 2626638 2626638
-1416282 -1794282 -2052162
-16466562 -18138162 -19662762
25 30 35
3830 3840 3840
8600 8600 8600
104860 113860 120000
463200 503000 539300
25 30 35
160860 161280 161280
361200 361200 361200
4404120 4782120 5040000
19454400 21126000 22650600
25 30 35
2907408 2907198 2907198
2807238 2807238 2807238
785778 596778 467838
-6739362 -7575162 -8337462
Net Water
Use (100%
reuse)
Sectioned
0 5 10 15 20 25 30 35
Low b=0.6
Median b=0.6
Median b=1.8
High b=1.8
2987838 -6340362 -9838962 -12442962 -14593362 -16466562 -18138162 -19662762
2987838 873138 82698 -506142 -993342 -1416282 -1794282 -2052162
2987838 2639238 2630838 2630838 2630838 2626638 2626638 2626638
2987838 2830758 2828658 2827818 2826978 2826978 2826558 2826558
Net Water
Use (100%
reuse)
Sectioned
0 5 10 15 20 25 30 35
Low b=0.6
Median b=0.6
Median b=1.8
High b=1.8
2987838 -6340362 -9838962 -12442962 -14593362 -16466562 -18138162 -19662762
0 7213500 9921660 11936820 13600020 15050280 16343880 17610600
0 1766100 2548140 3136980 3624180 4042920 4420920 4678800
0 191520 197820 196980 196140 200340 199920 199920
0 5 10 15 20 25 30 35
Net Water Use with 100 Percent Reuse
Well Lifespan (Years)
Net Water
Use (50%
reuse)
Sectioned
0 5 10 15 20 25 30 35
Low b=0.6
Median b=0.6
Median b=1.8
High b=1.8
2987838 -1676262 -3425562 -4727562 -5802762 -6739362 -7575162 -8337462
2987838 1930488 1535268 1240848 997248 785778 596778 467838
2987838 2813538 2809338 2809338 2809338 2807238 2807238 2807238
2987838 2909298 2908248 2907828 2907408 2907408 2907198 2907198
Net Water
Use (50%
reuse)
Sectioned
0 5 10 15 20 25 30 35
Low b=0.6
Median b=0.6
Median b=1.8
High b=1.8
2987838 -1676262 -3425562 -4727562 -5802762 -6739362 -7575162 -8337462
0 3606750 4960830 5968410 6800010 7525140 8171940 8805300
0 883050 1274070 1568490 1812090 2021460 2210460 2339400
0 95760 98910 98490 98070 100170 99960 99960
-3,000,000
-2,250,000
-1,500,000
-750,000
0
750,000
1,500,000
2,250,000
3,000,000
0 5 10 15 20 25 30 35
Net Water Use with 50 Percent Reuse
Well Lifespan (Years)
30 35
403102 404986
620593 623651
3056087 3288043
5533937 5983307
30 35
7.4 7.4
4.8 4.8
1.0 0.9
0.5 0.5
30 35
3 3
4 4
0 0
1 0
30 35
1 0
0 0
4 4
3 3
Estimated Water Intensity (0% Water Reuse)
Water
Intensity
(100% Reuse)
0 5 10 15 20 25 30 35
Low b=0.6
Median b=0.6
Median b=1.8
High b=1.8
7.9 7.4 7.2 7.1 7.1 7.0 7.0
4.8 4.5 4.4 4.3 4.3 4.2 4.2
0.7 0.0 -0.2 -0.4 -0.5 -0.6 -0.6
-2.9 -3.1 -3.2 -3.2 -3.3 -3.3 -3.3
Water
Intensity (0%
Reuse)
0 5 10 15 20 25 30 35
Low b=0.6
Median b=0.6
Median b=1.8
High b=1.8
3 3 3 3 3 3 3
4 4 5 5 5 5 5
4 3 3 3 3 3 3
-3 -3 -3 -3 -3 -3 -3
Water
Intensity (0%
Reuse)
0 5 10 15 20 25 30 35
Low b=0.6
Median b=0.6
Median b=1.8
High b=1.8
-3 -3 -3 -3 -3 -3 -3
4 3 3 3 3 3 3
4 4 5 5 5 5 5
3 3 3 3 3 3 3
Estimated Water Intensity (100% Water Reuse)
Water Neutrality Water Neutrality
Water
Intensity (50%
Reuse)
0 5 10 15 20 25 30 35
Low b=0.6
Median b=0.6
Median b=1.8
High b=1.8
8.3 7.6 7.4 7.3 7.3 7.2 7.2
5.4 4.8 4.7 4.6 4.6 4.5 4.5
2.4 1.1 0.7 0.5 0.4 0.3 0.2
1.4 -0.5 -0.9 -1.0 -1.1 -1.2 -1.3
How does the
water intensity
compare?
0
15
30
45
60
SurfaceMining
UndergroundMining
U.S.WeightedAverage
Preparation
Synfuel:CoalGasification
Synfuel:FisherTropsch
Conventional
NorthernColoradoShaleGas(0%Reuse)
NorthernColoradoShaleGas(50%Reuse)
NorthernColoradoShaleGas(100%Reuse)
Preparation
Gas-to-Liquids
Primary
ConventionalFlooding
SaudiArabiaAverage
OilSands
OilShale
U.S.On-ShoreAverage
EnhancedOilRecovery
ConventionalRefining
OilShaleProcessing
OilSandsProcessing
Mining
Enrichment
Extraction and Processing Water Intensity by Fuel Source
ConsumptiveWaterIntensity(gal/MMBtu)
3.5
19
51
1.5
2.9
2.4
1.8
1
42
1.5
14
22
35
39
58
58
10
39
48
3.5
6
Ethanol from Irrigated Corn
Extraction: 16,000
Processing: 60
Biodiesel from Soy
Extraction: 45,000
Processing: 300
Biodiesel from Rapeseed
Extraction: 16,000
Processing: 300
Coal OilNatural Gas
Extraction Processing
Uranium
Extraction Processing Extraction Processing
Wind (Turbine)
0
Solar (Photovoltaic)
0
22
23
24
Water Consumption of Energy Resource Extraction, Processing, and Conversion
reserve estimates ranging from 2.1 to 6.7 MMBtu (2.0 to 6.5 BCF) per well, giving a company-
wide range of 0.6 to 1.8 gal/MMBtu (See Table 2-2). (Chesapeake Energy 2010)
Table 2-2: Estimates of water consumption for different shale plays (Chesapeake Energy 2010)
Water consumption per well (million gal) Gas reserves per well Water
intensity
Shale play
Drilling Hydraulic
Fracturing
Total BCF MMBtu
(million)
gal/MMBtu
Barnett 0.3 3.8 4.1 2.7 2.7 1.5
Fayetteville 0.1 4.0 4.1 2.4 2.5 1.7
Haynesville 0.6 5.0 5.6 6.5 6.7 0.8
Marcellus 0.1 5.5 5.6 4.2 4.3 1.3
Typical min 1.0 3.5 4.5 6.5 6.7 0.6
Typical max 0.1 3.5 3.6 2.0 2.1 1.8
Average 1.3
The estimates are specific to one company’s operations (i.e. Chesapeake Energy) and reflect
typical water-intensity across its asset portfolio, not necessarily a representative range of water-
intensity for the industry as a whole. But alternative estimates for Marcellus and Barnett provide
comfort that the order of magnitude is appropriate, especially in the context of comparable water-
intensity of alternative fossil fuels.
Marcellus data
The U.S. Geological Survey published a factsheet on water issues relating to the Marcellus shale
gas developments (Soeder and Kappel 2009), summarized in Table 2-4. The USGS estimates
show a similar average water-intensity to the Chesapeake Energy data, at 1.2 and 1.3 gal/MMBtu
respectively, albeit with lower water-consumption per well and lower estimated recoverable
reserves per well (roughly half the Chesapeake Energy estimates).
Table 2-3: USGS estimates for Marcellus shale (2009)
Reserves per well (BCF) 2.5
Reserves per well (million MMBtu) 2.6
Hydraulic fracturing (million gal) 3.0
Average (gal/MMBtu) 1.2
The Susquehanna River Basin Commission (SRBC) regulates water access for a significant
portion of the Marcellus shale, covering parts of Pennsylvania, New York, and Maryland. The
SRBC estimated in January of 2010 that a typical Marcellus shale stimulation uses between four
and seven million gal of water over a two to five-day period, with about 15% of the water flowing
back to the surface in the first two months (Susquehanna River Basin Commission 2010),
comparable to the Chesapeake estimates. However, based on actual data from approximately 200
wells drilled between June 2008 and March 2009, the SRBC estimates that the average well
18
Water Intensity Comparison
Source: E. Mielke, L. D. Anadon, and V. Narayanamurti. Water consumption of energy resource extraction, processing, and
conversion. Discussion Paper 2010-15, Harvard Kennedy School Belfer Center for Science and International Affairs, 79 JFK
Street, Cambridge, MA 02138, October 2010.
Water Intensity Comparison
Source: Chesapeake Energy. Water use in deep shale gas exploration. Fact Sheet, September 2011.
Once-Through Cooling
Closed-Loop Cooling
Closed-Loop Cooling
with Carbon Capture
Dry Cooling
IGCC: Closed-Loop
Cooling
IGCC: Closed-Loop
Cooling with Carbon
Capture
IGCC: Wet Tower
IGCC: Wet Tower with
Carbon Capture
Combined-Cycle Gas
Turbine: Once-
Through Cooling
Combined-Cycle Gas
Turbine: Closed-Loop
Cooling
Combined-Cycle Gas
Turbine: Closed-Loop
Cooling with Carbon
Capture
Combined-Cycle Gas
Turbine: Dry Cooling
Combined-Cycle Gas
Turbine: Cooling Pond
Combined-Cycle Gas
Turbine: Wet Tower
Combined-Cycle Gas
Turbine: Wet Tower
with Carbon Capture
Once-Through Cooling
Closed-Loop Cooling
Closed-Loop Cooling
with Carbon Capture
Dry Cooling
Cooling Pond
Wet Tower
Parabolic Troughs:
Wet Cooling
Parabolic Troughs: Dry
Cooling
Tower: Wet Cooling
U.S. Weighted Average
of Large-Scale
Concentrating Solar
Power
Dish: Stirling Cycle
Photovoltaics
Concentrated Solar
Photovoltaics
Wind
315
405
420
15
369
330
760
500
115
195
190
15
240
130
500
415
575
590
15
680
850
910
80
820
800
10
2
2
0
0
250
500
750
1000
Once-ThroughCooling
Closed-LoopCooling
Closed-LoopCoolingwithCarbonCapture
DryCooling
IGCC:Closed-LoopCooling
IGCC:Closed-LoopCoolingwithCarbonCapture
IGCC:WetTower
IGCC:WetTowerwithCarbonCapture
Combined-CycleGasTurbine:Once-ThroughCooling
Combined-CycleGasTurbine:Closed-LoopCooling
Combined-CycleGasTurbine:Closed-LoopCoolingwithCarbonCapture
Combined-CycleGasTurbine:DryCooling
Combined-CycleGasTurbine:CoolingPond
Combined-CycleGasTurbine:WetTower
Combined-CycleGasTurbine:WetTowerwithCarbonCapture
Once-ThroughCooling
Closed-LoopCooling
Closed-LoopCoolingwithCarbonCapture
DryCooling
CoolingPond
WetTower
ParabolicTroughs:WetCooling
ParabolicTroughs:DryCooling
Tower:WetCooling
U.S.WeightedAverageofLarge-ScaleConcentratingSolarPower
Dish:StirlingCycle
Photovoltaics
ConcentratedSolarPhotovoltaics
Wind
Electricity Generation Water Intensity by Fuel Source
ConsumptiveWaterIntensity(gal/MWh)
Coal Natural Gas Uranium Solar Wind
Geothermal
Electricity Generation: 3,600
Hydropower
Electricity Generation: 4,500
25
26
27
Once-Through Cooling
Closed-Loop Cooling
Closed-Loop Cooling
with Carbon Capture
Dry Cooling
IGCC: Closed-Loop
Cooling
IGCC: Closed-Loop
Cooling with Carbon
Capture
IGCC: Wet Tower
IGCC: Wet Tower with
Carbon Capture
Combined-Cycle Gas
Turbine: Once-
Through Cooling
Combined-Cycle Gas
Turbine: Closed-Loop
Cooling
Combined-Cycle Gas
Turbine: Closed-Loop
Cooling with Carbon
Capture
Combined-Cycle Gas
Turbine: Dry Cooling
Combined-Cycle Gas
Turbine: Cooling Pond
Combined-Cycle Gas
Turbine: Wet Tower
Combined-Cycle Gas
Turbine: Wet Tower
with Carbon Capture
Once-Through Cooling
Closed-Loop Cooling
Closed-Loop Cooling
with Carbon Capture
Dry Cooling
Cooling Pond
Wet Tower
Parabolic Troughs:
Wet Cooling
Parabolic Troughs: Dry
Cooling
Tower: Wet Cooling
U.S. Weighted Average
of Large-Scale
Concentrating Solar
Power
Dish: Stirling Cycle
Photovoltaics
Concentrated Solar
Photovoltaics
Wind
35030
480
420
30
389
376
750
620
13780
260
217
30
150
560
42530
830
590
30
800
950
910
80
820
800
10
2
2
0
0
12500
25000
37500
50000
Once-ThroughCooling
Closed-LoopCooling
Closed-LoopCoolingwithCarbonCapture
DryCooling
IGCC:Closed-LoopCooling
IGCC:Closed-LoopCoolingwithCarbonCapture
IGCC:WetTower
IGCC:WetTowerwithCarbonCapture
Combined-CycleGasTurbine:Once-ThroughCooling
Combined-CycleGasTurbine:Closed-LoopCooling
Combined-CycleGasTurbine:Closed-LoopCoolingwithCarbonCapture
Combined-CycleGasTurbine:DryCooling
Combined-CycleGasTurbine:CoolingPond
Combined-CycleGasTurbine:WetTower
Combined-CycleGasTurbine:WetTowerwithCarbonCapture
Once-ThroughCooling
Closed-LoopCooling
Closed-LoopCoolingwithCarbonCapture
DryCooling
CoolingPond
WetTower
ParabolicTroughs:WetCooling
ParabolicTroughs:DryCooling
Tower:WetCooling
U.S.WeightedAverageofLarge-ScaleConcentratingSolarPower
Dish:StirlingCycle
Photovoltaics
ConcentratedSolarPhotovoltaics
Wind
Electricity Generation Water Intensity by Fuel Source
WithdrawnWaterIntensity(gal/MWh)
Coal Natural Gas Uranium Solar Wind
Geothermal
Electricity Generation: 3,600
els
1.5
25
0
12.5
25
37.5
50
ElectricVehicle(PHEV/EV):WindanPhotovoltaic
BiodieselfromNonirrigatedSoybeans
CNGusingNaturalGasforCompression
HydrogenFuelCellwithElectrolysisviaWindandPhotovoltaic
HydrogenfromNaturalGas
CNGusingElectricityforCompression
Diesel
Gasoline
ElectricVehicle(PHEV/EV):U.S.Grid
Plug-InHybridElectricVehicle
EthanolfromNonirrigatedCorn
OilShaleGasoline
SynDieselfromNaturalGas
ElectricVehicle
OilShaleGasoline
HydrogenFuelCellwithElectrolysisviaU.S.Grid
SynDieselfromCoal
HydrogenviaElectrolysis
Coal
Oil
Natural Gas
Solar and Wind
Biofuels
ConsumptiveWaterIntensity(gallonsper100milesdriven)
Water Intensity of Transportation
Carey W. King and Michael E. Webber
Environmental Science and Tehcnology 2008 42 (21), 7866-7872
Stephen Goodwin
stephen.goodwin@colostate.edu
Department of Civil and Environmental Engineering
Colorado State University
cewc.colostate.edu
Questions?
28
29
30

More Related Content

What's hot

Jwrhe10065 20150204-144509-1366-46826
Jwrhe10065 20150204-144509-1366-46826Jwrhe10065 20150204-144509-1366-46826
Jwrhe10065 20150204-144509-1366-46826yimer mulate
 
adewale_SADIQ_seminar_submitted
adewale_SADIQ_seminar_submittedadewale_SADIQ_seminar_submitted
adewale_SADIQ_seminar_submittedadewale SADIQ
 
Heinemann zoltán e[1]._-_petroleum_recovery_
Heinemann zoltán e[1]._-_petroleum_recovery_Heinemann zoltán e[1]._-_petroleum_recovery_
Heinemann zoltán e[1]._-_petroleum_recovery_Hanhndcnm
 
Large Dia Well Tests
Large Dia Well TestsLarge Dia Well Tests
Large Dia Well TestsAnand A.V.S.S
 
Spatial analysis of groundwater quality using GIS system
Spatial analysis of groundwater quality using GIS systemSpatial analysis of groundwater quality using GIS system
Spatial analysis of groundwater quality using GIS systemPavan Grandhi
 
Application of Buckley-Leverett Equation in Modeling the Radius of Invasion i...
Application of Buckley-Leverett Equation in Modeling the Radius of Invasion i...Application of Buckley-Leverett Equation in Modeling the Radius of Invasion i...
Application of Buckley-Leverett Equation in Modeling the Radius of Invasion i...IJERD Editor
 
Data Requirements for Groundwater Modelling
Data Requirements for Groundwater ModellingData Requirements for Groundwater Modelling
Data Requirements for Groundwater ModellingC. P. Kumar
 
Effect of physico-chemical pretreatment on the removal [Read-Only] [Compatibi...
Effect of physico-chemical pretreatment on the removal [Read-Only] [Compatibi...Effect of physico-chemical pretreatment on the removal [Read-Only] [Compatibi...
Effect of physico-chemical pretreatment on the removal [Read-Only] [Compatibi...MUNANURA JAMES
 
Senior Design Final Presentation
Senior Design Final PresentationSenior Design Final Presentation
Senior Design Final PresentationKatherine Knight
 
A review on managed aquifer recharge by check dams a case study near chennai,...
A review on managed aquifer recharge by check dams a case study near chennai,...A review on managed aquifer recharge by check dams a case study near chennai,...
A review on managed aquifer recharge by check dams a case study near chennai,...eSAT Publishing House
 
The effect of hydraulic structure on aeration performance
 The effect of hydraulic structure on aeration performance  The effect of hydraulic structure on aeration performance
The effect of hydraulic structure on aeration performance Alexander Decker
 
Discharge and Sediment Transport Modeling Buck Creek Proposal
Discharge and Sediment Transport Modeling Buck Creek ProposalDischarge and Sediment Transport Modeling Buck Creek Proposal
Discharge and Sediment Transport Modeling Buck Creek ProposalJames Blumenschein
 
Reynold Chow - Jan 2016
Reynold Chow - Jan 2016Reynold Chow - Jan 2016
Reynold Chow - Jan 2016Reynold Chow
 
Climate change impact assessment on hydrology on river basins
Climate change impact assessment on hydrology on river basinsClimate change impact assessment on hydrology on river basins
Climate change impact assessment on hydrology on river basinsAbhiram Kanigolla
 
UiOlunchSeminar
UiOlunchSeminarUiOlunchSeminar
UiOlunchSeminarHong Li
 

What's hot (20)

SeniorThesis2
SeniorThesis2SeniorThesis2
SeniorThesis2
 
Jwrhe10065 20150204-144509-1366-46826
Jwrhe10065 20150204-144509-1366-46826Jwrhe10065 20150204-144509-1366-46826
Jwrhe10065 20150204-144509-1366-46826
 
adewale_SADIQ_seminar_submitted
adewale_SADIQ_seminar_submittedadewale_SADIQ_seminar_submitted
adewale_SADIQ_seminar_submitted
 
361
361361
361
 
Chapter10
Chapter10Chapter10
Chapter10
 
Heinemann zoltán e[1]._-_petroleum_recovery_
Heinemann zoltán e[1]._-_petroleum_recovery_Heinemann zoltán e[1]._-_petroleum_recovery_
Heinemann zoltán e[1]._-_petroleum_recovery_
 
Large Dia Well Tests
Large Dia Well TestsLarge Dia Well Tests
Large Dia Well Tests
 
Spatial analysis of groundwater quality using GIS system
Spatial analysis of groundwater quality using GIS systemSpatial analysis of groundwater quality using GIS system
Spatial analysis of groundwater quality using GIS system
 
Application of Buckley-Leverett Equation in Modeling the Radius of Invasion i...
Application of Buckley-Leverett Equation in Modeling the Radius of Invasion i...Application of Buckley-Leverett Equation in Modeling the Radius of Invasion i...
Application of Buckley-Leverett Equation in Modeling the Radius of Invasion i...
 
T0 numtq0ndy=
T0 numtq0ndy=T0 numtq0ndy=
T0 numtq0ndy=
 
Data Requirements for Groundwater Modelling
Data Requirements for Groundwater ModellingData Requirements for Groundwater Modelling
Data Requirements for Groundwater Modelling
 
Effect of physico-chemical pretreatment on the removal [Read-Only] [Compatibi...
Effect of physico-chemical pretreatment on the removal [Read-Only] [Compatibi...Effect of physico-chemical pretreatment on the removal [Read-Only] [Compatibi...
Effect of physico-chemical pretreatment on the removal [Read-Only] [Compatibi...
 
Senior Design Final Presentation
Senior Design Final PresentationSenior Design Final Presentation
Senior Design Final Presentation
 
A review on managed aquifer recharge by check dams a case study near chennai,...
A review on managed aquifer recharge by check dams a case study near chennai,...A review on managed aquifer recharge by check dams a case study near chennai,...
A review on managed aquifer recharge by check dams a case study near chennai,...
 
The effect of hydraulic structure on aeration performance
 The effect of hydraulic structure on aeration performance  The effect of hydraulic structure on aeration performance
The effect of hydraulic structure on aeration performance
 
LSRWA Update July 2012
LSRWA Update July 2012LSRWA Update July 2012
LSRWA Update July 2012
 
Discharge and Sediment Transport Modeling Buck Creek Proposal
Discharge and Sediment Transport Modeling Buck Creek ProposalDischarge and Sediment Transport Modeling Buck Creek Proposal
Discharge and Sediment Transport Modeling Buck Creek Proposal
 
Reynold Chow - Jan 2016
Reynold Chow - Jan 2016Reynold Chow - Jan 2016
Reynold Chow - Jan 2016
 
Climate change impact assessment on hydrology on river basins
Climate change impact assessment on hydrology on river basinsClimate change impact assessment on hydrology on river basins
Climate change impact assessment on hydrology on river basins
 
UiOlunchSeminar
UiOlunchSeminarUiOlunchSeminar
UiOlunchSeminar
 

Similar to Water Use and Intensity Analysis for Oil and Gas Development

Use of hydraulic phenomena in enhancement of dissolved oxygen concentration
Use of hydraulic phenomena in enhancement of dissolved oxygen concentrationUse of hydraulic phenomena in enhancement of dissolved oxygen concentration
Use of hydraulic phenomena in enhancement of dissolved oxygen concentrationeSAT Journals
 
Thesis_presentation_June2023.pptx
Thesis_presentation_June2023.pptxThesis_presentation_June2023.pptx
Thesis_presentation_June2023.pptxANSHUMANMISHRA72015
 
Reservoir Water Supply Planning for an Uncertain Future
Reservoir Water Supply Planning for an Uncertain FutureReservoir Water Supply Planning for an Uncertain Future
Reservoir Water Supply Planning for an Uncertain FutureDave Campbell
 
Coupling of Surface water and Groundwater Models
Coupling of Surface water and Groundwater Models Coupling of Surface water and Groundwater Models
Coupling of Surface water and Groundwater Models TIPU SULTAN BADAGAN
 
Overview of water panning in queensland, kaylene power
Overview of water panning in queensland, kaylene powerOverview of water panning in queensland, kaylene power
Overview of water panning in queensland, kaylene powerInternational WaterCentre
 
Water measurement
Water measurementWater measurement
Water measurementHina Bhatu
 
Impact of the Hydrographic Changing in the Open Drains Cross Sections on the ...
Impact of the Hydrographic Changing in the Open Drains Cross Sections on the ...Impact of the Hydrographic Changing in the Open Drains Cross Sections on the ...
Impact of the Hydrographic Changing in the Open Drains Cross Sections on the ...IJMER
 
Stormwater BMP Poster
Stormwater BMP PosterStormwater BMP Poster
Stormwater BMP PosterRob Mooney
 
IRJET- Parameters Affecting the Clogging of Recharge Wells in Different Soil ...
IRJET- Parameters Affecting the Clogging of Recharge Wells in Different Soil ...IRJET- Parameters Affecting the Clogging of Recharge Wells in Different Soil ...
IRJET- Parameters Affecting the Clogging of Recharge Wells in Different Soil ...IRJET Journal
 
2150602 hwre 150113106007-008 (HYDROLOGY & WATER RESOURCE ENGINEERING)
2150602 hwre 150113106007-008 (HYDROLOGY & WATER RESOURCE ENGINEERING)2150602 hwre 150113106007-008 (HYDROLOGY & WATER RESOURCE ENGINEERING)
2150602 hwre 150113106007-008 (HYDROLOGY & WATER RESOURCE ENGINEERING)Jaydeep Dave
 
HYDROLOGICAL AND WATER QUALITY MODELLING USING SWAT FOR DONI RIVER
HYDROLOGICAL AND WATER QUALITY MODELLING USING SWAT FOR DONI RIVERHYDROLOGICAL AND WATER QUALITY MODELLING USING SWAT FOR DONI RIVER
HYDROLOGICAL AND WATER QUALITY MODELLING USING SWAT FOR DONI RIVERIRJET Journal
 
flow_through_linear_weir in analysis of the
flow_through_linear_weir in analysis of the flow_through_linear_weir in analysis of the
flow_through_linear_weir in analysis of the huamrajak
 
Estimated Recoverable Storage: What it does, doesn't and might mean for plann...
Estimated Recoverable Storage: What it does, doesn't and might mean for plann...Estimated Recoverable Storage: What it does, doesn't and might mean for plann...
Estimated Recoverable Storage: What it does, doesn't and might mean for plann...Texas Alliance of Groundwater Districts
 
APPLICATIONS OF ARC SWAT MODEL FOR HYDROLOGICAL MODELLING
APPLICATIONS OF ARC SWAT MODEL FOR HYDROLOGICAL MODELLINGAPPLICATIONS OF ARC SWAT MODEL FOR HYDROLOGICAL MODELLING
APPLICATIONS OF ARC SWAT MODEL FOR HYDROLOGICAL MODELLINGAbhiram Kanigolla
 
Suspended Sediment Rating Curve for Tigris River Upstream Al- Betera Regulator
Suspended Sediment Rating Curve for Tigris River Upstream Al- Betera RegulatorSuspended Sediment Rating Curve for Tigris River Upstream Al- Betera Regulator
Suspended Sediment Rating Curve for Tigris River Upstream Al- Betera RegulatorIJRES Journal
 
Hall, Ryan_DWRC Poster
Hall, Ryan_DWRC PosterHall, Ryan_DWRC Poster
Hall, Ryan_DWRC PosterRyan Hall
 

Similar to Water Use and Intensity Analysis for Oil and Gas Development (20)

Use of hydraulic phenomena in enhancement of dissolved oxygen concentration
Use of hydraulic phenomena in enhancement of dissolved oxygen concentrationUse of hydraulic phenomena in enhancement of dissolved oxygen concentration
Use of hydraulic phenomena in enhancement of dissolved oxygen concentration
 
Thesis_presentation_June2023.pptx
Thesis_presentation_June2023.pptxThesis_presentation_June2023.pptx
Thesis_presentation_June2023.pptx
 
Modflow Nepal
Modflow NepalModflow Nepal
Modflow Nepal
 
Reservoir Water Supply Planning for an Uncertain Future
Reservoir Water Supply Planning for an Uncertain FutureReservoir Water Supply Planning for an Uncertain Future
Reservoir Water Supply Planning for an Uncertain Future
 
Procedure for conducting pumping tests
Procedure for conducting pumping testsProcedure for conducting pumping tests
Procedure for conducting pumping tests
 
Coupling of Surface water and Groundwater Models
Coupling of Surface water and Groundwater Models Coupling of Surface water and Groundwater Models
Coupling of Surface water and Groundwater Models
 
Overview of water panning in queensland, kaylene power
Overview of water panning in queensland, kaylene powerOverview of water panning in queensland, kaylene power
Overview of water panning in queensland, kaylene power
 
Water measurement
Water measurementWater measurement
Water measurement
 
Impact of the Hydrographic Changing in the Open Drains Cross Sections on the ...
Impact of the Hydrographic Changing in the Open Drains Cross Sections on the ...Impact of the Hydrographic Changing in the Open Drains Cross Sections on the ...
Impact of the Hydrographic Changing in the Open Drains Cross Sections on the ...
 
Stormwater BMP Poster
Stormwater BMP PosterStormwater BMP Poster
Stormwater BMP Poster
 
IRJET- Parameters Affecting the Clogging of Recharge Wells in Different Soil ...
IRJET- Parameters Affecting the Clogging of Recharge Wells in Different Soil ...IRJET- Parameters Affecting the Clogging of Recharge Wells in Different Soil ...
IRJET- Parameters Affecting the Clogging of Recharge Wells in Different Soil ...
 
Chapter10
Chapter10Chapter10
Chapter10
 
Hydrology.pdf
Hydrology.pdfHydrology.pdf
Hydrology.pdf
 
2150602 hwre 150113106007-008 (HYDROLOGY & WATER RESOURCE ENGINEERING)
2150602 hwre 150113106007-008 (HYDROLOGY & WATER RESOURCE ENGINEERING)2150602 hwre 150113106007-008 (HYDROLOGY & WATER RESOURCE ENGINEERING)
2150602 hwre 150113106007-008 (HYDROLOGY & WATER RESOURCE ENGINEERING)
 
HYDROLOGICAL AND WATER QUALITY MODELLING USING SWAT FOR DONI RIVER
HYDROLOGICAL AND WATER QUALITY MODELLING USING SWAT FOR DONI RIVERHYDROLOGICAL AND WATER QUALITY MODELLING USING SWAT FOR DONI RIVER
HYDROLOGICAL AND WATER QUALITY MODELLING USING SWAT FOR DONI RIVER
 
flow_through_linear_weir in analysis of the
flow_through_linear_weir in analysis of the flow_through_linear_weir in analysis of the
flow_through_linear_weir in analysis of the
 
Estimated Recoverable Storage: What it does, doesn't and might mean for plann...
Estimated Recoverable Storage: What it does, doesn't and might mean for plann...Estimated Recoverable Storage: What it does, doesn't and might mean for plann...
Estimated Recoverable Storage: What it does, doesn't and might mean for plann...
 
APPLICATIONS OF ARC SWAT MODEL FOR HYDROLOGICAL MODELLING
APPLICATIONS OF ARC SWAT MODEL FOR HYDROLOGICAL MODELLINGAPPLICATIONS OF ARC SWAT MODEL FOR HYDROLOGICAL MODELLING
APPLICATIONS OF ARC SWAT MODEL FOR HYDROLOGICAL MODELLING
 
Suspended Sediment Rating Curve for Tigris River Upstream Al- Betera Regulator
Suspended Sediment Rating Curve for Tigris River Upstream Al- Betera RegulatorSuspended Sediment Rating Curve for Tigris River Upstream Al- Betera Regulator
Suspended Sediment Rating Curve for Tigris River Upstream Al- Betera Regulator
 
Hall, Ryan_DWRC Poster
Hall, Ryan_DWRC PosterHall, Ryan_DWRC Poster
Hall, Ryan_DWRC Poster
 

More from Ashwin Dhanasekar

Shale Gas - Risks & Overview
Shale Gas - Risks & OverviewShale Gas - Risks & Overview
Shale Gas - Risks & OverviewAshwin Dhanasekar
 
Water Quality Treatment - Produced Water & Flowback
Water Quality Treatment - Produced Water & FlowbackWater Quality Treatment - Produced Water & Flowback
Water Quality Treatment - Produced Water & FlowbackAshwin Dhanasekar
 
Water Production from Shale Oil and Gas Wells
Water Production from Shale Oil and Gas WellsWater Production from Shale Oil and Gas Wells
Water Production from Shale Oil and Gas WellsAshwin Dhanasekar
 
ESRI International User Conference Presentation
ESRI International User Conference PresentationESRI International User Conference Presentation
ESRI International User Conference PresentationAshwin Dhanasekar
 
Adsorption of copper on raw, and activated 1
Adsorption of copper on raw, and activated 1Adsorption of copper on raw, and activated 1
Adsorption of copper on raw, and activated 1Ashwin Dhanasekar
 
Waterborne engineering (csu) design report
Waterborne engineering (csu) design reportWaterborne engineering (csu) design report
Waterborne engineering (csu) design reportAshwin Dhanasekar
 
Final presentation (waterborne engineering)
Final presentation (waterborne engineering)Final presentation (waterborne engineering)
Final presentation (waterborne engineering)Ashwin Dhanasekar
 
Development of a GIS based Chemistry tool to Optimize Produced Water Treatment
Development of a GIS based Chemistry tool to Optimize Produced Water TreatmentDevelopment of a GIS based Chemistry tool to Optimize Produced Water Treatment
Development of a GIS based Chemistry tool to Optimize Produced Water TreatmentAshwin Dhanasekar
 
Development of a GIS based Chemistry Tool to Predict Produced Water Treatment…
Development of a GIS based Chemistry Tool to Predict Produced Water Treatment…Development of a GIS based Chemistry Tool to Predict Produced Water Treatment…
Development of a GIS based Chemistry Tool to Predict Produced Water Treatment…Ashwin Dhanasekar
 

More from Ashwin Dhanasekar (11)

Shale Gas - Risks & Overview
Shale Gas - Risks & OverviewShale Gas - Risks & Overview
Shale Gas - Risks & Overview
 
Water Quality Treatment - Produced Water & Flowback
Water Quality Treatment - Produced Water & FlowbackWater Quality Treatment - Produced Water & Flowback
Water Quality Treatment - Produced Water & Flowback
 
Water Production from Shale Oil and Gas Wells
Water Production from Shale Oil and Gas WellsWater Production from Shale Oil and Gas Wells
Water Production from Shale Oil and Gas Wells
 
ESRI International User Conference Presentation
ESRI International User Conference PresentationESRI International User Conference Presentation
ESRI International User Conference Presentation
 
Abstract ACM
Abstract ACMAbstract ACM
Abstract ACM
 
Final report cive 540 1
Final report cive 540 1Final report cive 540 1
Final report cive 540 1
 
Adsorption of copper on raw, and activated 1
Adsorption of copper on raw, and activated 1Adsorption of copper on raw, and activated 1
Adsorption of copper on raw, and activated 1
 
Waterborne engineering (csu) design report
Waterborne engineering (csu) design reportWaterborne engineering (csu) design report
Waterborne engineering (csu) design report
 
Final presentation (waterborne engineering)
Final presentation (waterborne engineering)Final presentation (waterborne engineering)
Final presentation (waterborne engineering)
 
Development of a GIS based Chemistry tool to Optimize Produced Water Treatment
Development of a GIS based Chemistry tool to Optimize Produced Water TreatmentDevelopment of a GIS based Chemistry tool to Optimize Produced Water Treatment
Development of a GIS based Chemistry tool to Optimize Produced Water Treatment
 
Development of a GIS based Chemistry Tool to Predict Produced Water Treatment…
Development of a GIS based Chemistry Tool to Predict Produced Water Treatment…Development of a GIS based Chemistry Tool to Predict Produced Water Treatment…
Development of a GIS based Chemistry Tool to Predict Produced Water Treatment…
 

Recently uploaded

_Math 4-Q4 Week 5.pptx Steps in Collecting Data
_Math 4-Q4 Week 5.pptx Steps in Collecting Data_Math 4-Q4 Week 5.pptx Steps in Collecting Data
_Math 4-Q4 Week 5.pptx Steps in Collecting DataJhengPantaleon
 
URLs and Routing in the Odoo 17 Website App
URLs and Routing in the Odoo 17 Website AppURLs and Routing in the Odoo 17 Website App
URLs and Routing in the Odoo 17 Website AppCeline George
 
Contemporary philippine arts from the regions_PPT_Module_12 [Autosaved] (1).pptx
Contemporary philippine arts from the regions_PPT_Module_12 [Autosaved] (1).pptxContemporary philippine arts from the regions_PPT_Module_12 [Autosaved] (1).pptx
Contemporary philippine arts from the regions_PPT_Module_12 [Autosaved] (1).pptxRoyAbrique
 
PSYCHIATRIC History collection FORMAT.pptx
PSYCHIATRIC   History collection FORMAT.pptxPSYCHIATRIC   History collection FORMAT.pptx
PSYCHIATRIC History collection FORMAT.pptxPoojaSen20
 
Hybridoma Technology ( Production , Purification , and Application )
Hybridoma Technology  ( Production , Purification , and Application  ) Hybridoma Technology  ( Production , Purification , and Application  )
Hybridoma Technology ( Production , Purification , and Application ) Sakshi Ghasle
 
Employee wellbeing at the workplace.pptx
Employee wellbeing at the workplace.pptxEmployee wellbeing at the workplace.pptx
Employee wellbeing at the workplace.pptxNirmalaLoungPoorunde1
 
The basics of sentences session 2pptx copy.pptx
The basics of sentences session 2pptx copy.pptxThe basics of sentences session 2pptx copy.pptx
The basics of sentences session 2pptx copy.pptxheathfieldcps1
 
Presiding Officer Training module 2024 lok sabha elections
Presiding Officer Training module 2024 lok sabha electionsPresiding Officer Training module 2024 lok sabha elections
Presiding Officer Training module 2024 lok sabha electionsanshu789521
 
A Critique of the Proposed National Education Policy Reform
A Critique of the Proposed National Education Policy ReformA Critique of the Proposed National Education Policy Reform
A Critique of the Proposed National Education Policy ReformChameera Dedduwage
 
Presentation by Andreas Schleicher Tackling the School Absenteeism Crisis 30 ...
Presentation by Andreas Schleicher Tackling the School Absenteeism Crisis 30 ...Presentation by Andreas Schleicher Tackling the School Absenteeism Crisis 30 ...
Presentation by Andreas Schleicher Tackling the School Absenteeism Crisis 30 ...EduSkills OECD
 
How to Make a Pirate ship Primary Education.pptx
How to Make a Pirate ship Primary Education.pptxHow to Make a Pirate ship Primary Education.pptx
How to Make a Pirate ship Primary Education.pptxmanuelaromero2013
 
Science 7 - LAND and SEA BREEZE and its Characteristics
Science 7 - LAND and SEA BREEZE and its CharacteristicsScience 7 - LAND and SEA BREEZE and its Characteristics
Science 7 - LAND and SEA BREEZE and its CharacteristicsKarinaGenton
 
Call Girls in Dwarka Mor Delhi Contact Us 9654467111
Call Girls in Dwarka Mor Delhi Contact Us 9654467111Call Girls in Dwarka Mor Delhi Contact Us 9654467111
Call Girls in Dwarka Mor Delhi Contact Us 9654467111Sapana Sha
 
Q4-W6-Restating Informational Text Grade 3
Q4-W6-Restating Informational Text Grade 3Q4-W6-Restating Informational Text Grade 3
Q4-W6-Restating Informational Text Grade 3JemimahLaneBuaron
 
Paris 2024 Olympic Geographies - an activity
Paris 2024 Olympic Geographies - an activityParis 2024 Olympic Geographies - an activity
Paris 2024 Olympic Geographies - an activityGeoBlogs
 
Micromeritics - Fundamental and Derived Properties of Powders
Micromeritics - Fundamental and Derived Properties of PowdersMicromeritics - Fundamental and Derived Properties of Powders
Micromeritics - Fundamental and Derived Properties of PowdersChitralekhaTherkar
 
Measures of Central Tendency: Mean, Median and Mode
Measures of Central Tendency: Mean, Median and ModeMeasures of Central Tendency: Mean, Median and Mode
Measures of Central Tendency: Mean, Median and ModeThiyagu K
 
Grant Readiness 101 TechSoup and Remy Consulting
Grant Readiness 101 TechSoup and Remy ConsultingGrant Readiness 101 TechSoup and Remy Consulting
Grant Readiness 101 TechSoup and Remy ConsultingTechSoup
 
Separation of Lanthanides/ Lanthanides and Actinides
Separation of Lanthanides/ Lanthanides and ActinidesSeparation of Lanthanides/ Lanthanides and Actinides
Separation of Lanthanides/ Lanthanides and ActinidesFatimaKhan178732
 

Recently uploaded (20)

_Math 4-Q4 Week 5.pptx Steps in Collecting Data
_Math 4-Q4 Week 5.pptx Steps in Collecting Data_Math 4-Q4 Week 5.pptx Steps in Collecting Data
_Math 4-Q4 Week 5.pptx Steps in Collecting Data
 
URLs and Routing in the Odoo 17 Website App
URLs and Routing in the Odoo 17 Website AppURLs and Routing in the Odoo 17 Website App
URLs and Routing in the Odoo 17 Website App
 
Contemporary philippine arts from the regions_PPT_Module_12 [Autosaved] (1).pptx
Contemporary philippine arts from the regions_PPT_Module_12 [Autosaved] (1).pptxContemporary philippine arts from the regions_PPT_Module_12 [Autosaved] (1).pptx
Contemporary philippine arts from the regions_PPT_Module_12 [Autosaved] (1).pptx
 
PSYCHIATRIC History collection FORMAT.pptx
PSYCHIATRIC   History collection FORMAT.pptxPSYCHIATRIC   History collection FORMAT.pptx
PSYCHIATRIC History collection FORMAT.pptx
 
Hybridoma Technology ( Production , Purification , and Application )
Hybridoma Technology  ( Production , Purification , and Application  ) Hybridoma Technology  ( Production , Purification , and Application  )
Hybridoma Technology ( Production , Purification , and Application )
 
Employee wellbeing at the workplace.pptx
Employee wellbeing at the workplace.pptxEmployee wellbeing at the workplace.pptx
Employee wellbeing at the workplace.pptx
 
The basics of sentences session 2pptx copy.pptx
The basics of sentences session 2pptx copy.pptxThe basics of sentences session 2pptx copy.pptx
The basics of sentences session 2pptx copy.pptx
 
Presiding Officer Training module 2024 lok sabha elections
Presiding Officer Training module 2024 lok sabha electionsPresiding Officer Training module 2024 lok sabha elections
Presiding Officer Training module 2024 lok sabha elections
 
A Critique of the Proposed National Education Policy Reform
A Critique of the Proposed National Education Policy ReformA Critique of the Proposed National Education Policy Reform
A Critique of the Proposed National Education Policy Reform
 
Model Call Girl in Bikash Puri Delhi reach out to us at 🔝9953056974🔝
Model Call Girl in Bikash Puri  Delhi reach out to us at 🔝9953056974🔝Model Call Girl in Bikash Puri  Delhi reach out to us at 🔝9953056974🔝
Model Call Girl in Bikash Puri Delhi reach out to us at 🔝9953056974🔝
 
Presentation by Andreas Schleicher Tackling the School Absenteeism Crisis 30 ...
Presentation by Andreas Schleicher Tackling the School Absenteeism Crisis 30 ...Presentation by Andreas Schleicher Tackling the School Absenteeism Crisis 30 ...
Presentation by Andreas Schleicher Tackling the School Absenteeism Crisis 30 ...
 
How to Make a Pirate ship Primary Education.pptx
How to Make a Pirate ship Primary Education.pptxHow to Make a Pirate ship Primary Education.pptx
How to Make a Pirate ship Primary Education.pptx
 
Science 7 - LAND and SEA BREEZE and its Characteristics
Science 7 - LAND and SEA BREEZE and its CharacteristicsScience 7 - LAND and SEA BREEZE and its Characteristics
Science 7 - LAND and SEA BREEZE and its Characteristics
 
Call Girls in Dwarka Mor Delhi Contact Us 9654467111
Call Girls in Dwarka Mor Delhi Contact Us 9654467111Call Girls in Dwarka Mor Delhi Contact Us 9654467111
Call Girls in Dwarka Mor Delhi Contact Us 9654467111
 
Q4-W6-Restating Informational Text Grade 3
Q4-W6-Restating Informational Text Grade 3Q4-W6-Restating Informational Text Grade 3
Q4-W6-Restating Informational Text Grade 3
 
Paris 2024 Olympic Geographies - an activity
Paris 2024 Olympic Geographies - an activityParis 2024 Olympic Geographies - an activity
Paris 2024 Olympic Geographies - an activity
 
Micromeritics - Fundamental and Derived Properties of Powders
Micromeritics - Fundamental and Derived Properties of PowdersMicromeritics - Fundamental and Derived Properties of Powders
Micromeritics - Fundamental and Derived Properties of Powders
 
Measures of Central Tendency: Mean, Median and Mode
Measures of Central Tendency: Mean, Median and ModeMeasures of Central Tendency: Mean, Median and Mode
Measures of Central Tendency: Mean, Median and Mode
 
Grant Readiness 101 TechSoup and Remy Consulting
Grant Readiness 101 TechSoup and Remy ConsultingGrant Readiness 101 TechSoup and Remy Consulting
Grant Readiness 101 TechSoup and Remy Consulting
 
Separation of Lanthanides/ Lanthanides and Actinides
Separation of Lanthanides/ Lanthanides and ActinidesSeparation of Lanthanides/ Lanthanides and Actinides
Separation of Lanthanides/ Lanthanides and Actinides
 

Water Use and Intensity Analysis for Oil and Gas Development

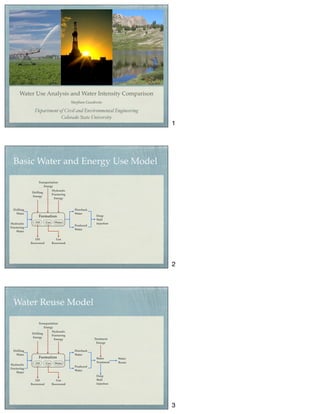
  • 1. Water Use Analysis and Water Intensity Comparison Stephen Goodwin Department of Civil and Environmental Engineering Colorado State University Basic Water and Energy Use Model Formation Oil Gas Water Drilling Water Hydraulic Fracturing Water Flowback Water Produced Water Deep Well Injection Oil Recovered Gas Recovered Drilling Energy Hydrualic Fracturing Energy Transportation Energy Water Reuse Model Water Treatment Drilling Water Hydraulic Fracturing Water Flowback Water Produced Water Formation Oil Gas Water Drilling Energy Hydrualic Fracturing Energy Oil Recovered Gas Recovered Transportation Energy Deep Well Injection Water Reuse Treatment Energy 1 2 3
  • 2. Water Intensity Drilling Water Hydraulic Fracturing Water Flowback Water Produced Water Formation Oil Gas Water Deep Well Injection Drilling Energy Hydrualic Fracturing Energy Oil Recovered Gas Recovered Water Treatment Water Reuse Treatment Energy Water Intensity Transportation Energy Water Intensity Net Water Consumed (Gallons) Net Energy Recovered (MMBtu) = Reducing Water Intensity Optimize water management with transportation, piping, and locating permanent and mobile treatment facility. (Ashwin Dhanasekar) Temporal and spatial characterization of flowback and produced water quality and volumes to determine what water can be treated. (Bing Bai) Optimize treatment approaches and dilution with modeling and bench-scale testing. (Ryan Hutcherson and Nasim Esmaeilirad) Reduce water use for drilling and hydraulic fracturing Reduce energy use for drilling and hydraulic fracturing Increase energy recovery CSU’s Center for Energy Water Sustainability Research Other Possibilities Indirectly Addressed by CSU Research How much water is required to drill and hydraulically fracture a well in Northern Colorado? 4 5 6
  • 3. Water Use: Sampling WELD LARIMER ADAMS MORGAN BOULDER ARAPAHOE JEFFERSON GILPIN DENVER CLEAR CREEK GRAND BROOMFIELD Legend Extended horizontal wells sampled Horizontal wells sampled Vertical wells sampled Wattenberg Field (as defined by the COGCC on July 1, 2013) WELD LARIMER ADAMS MORGAN BOULDER ARAPAHOE JEFFERSON GILPIN DENVER CLEAR CREEK GRAND BROOMFIELD Legend Extended horizontal wells sampled Horizontal wells sampled Vertical wells sampled Wattenberg Field (as defined by the COGCC on July 1, 2013) ADAMS MORGAN BOULDER ARAPAHOE JEFFERSON GILPIN DENVER CLEAR CREEK GRAND BROOMFIELD Legend Extended horizontal wells sampled Horizontal wells sampled Vertical wells sampled Wattenberg Field (as defined by the COGCC on July 1, 2013) ADAMS MORGAN BOULDER ARAPAHOE JEFFERSON GILPIN DENVER CLEAR CREEK GRAND BROOMFIELD Legend Extended horizontal wells sampled Horizontal wells sampled Vertical wells sampled Wattenberg Field (as defined by the COGCC on July 1, 2013) decisions regarding future water and energy development. The objective of this study is to provide a detailed assessment of current water use and to determine the factors that have the strongest influence on the total water use per well. These factors include the well type (vertical, horizontal, or extended horizon- tal), number of hydraulic fracturing stages, water use (drilling or hydraulic fracturing), temporal, and spatial distribution. 2. Method The wells included in the water use analysis are limited to wells located in the Wattenberg field, drilled between January 1, 2010 to July 1, 2013, and operated by Noble Energy, Inc. (Noble) with complete water use records available. For this study, the Wattenberg field is defined by the Colorado Oil Gas Conservation Commission’s (COGCC) GIS shape file accessed on July 1, 2013 (Figure 1). To best assess current water require- ments and predict future demands only wells drilled after 2010 are included in the study. Noble is the largest operator in the Wattenberg field. WELD LARIMER ADAMS MORGAN BOULDER ARAPAHOE JEFFERSON GILPIN DENVER CLEAR CREEK GRAND BROOMFIELD Legend Extended horizontal wells sampled Horizontal wells sampled Vertical wells sampled Wattenberg Field (as defined by the COGCC on July 1, 2013) WELD LARIMER ADAMS MORGAN BOULDER ARAPAHOE JEFFERSON GILPIN DENVER CLEAR CREEK GRAND BROOMFIELD Legend Extended horizontal wells sampled Horizontal wells sampled Vertical wells sampled Wattenberg Field (as defined by the COGCC on July 1, 2013) Figure 1: The spatial distribution of sampled wells used in this study. Sampled vertical wells are shown in green, sampled horizontal wells are shown in blue, and extended horizontal wells are shown in red. The Wattenberg field as defined by the COGCC on July 1, 2013 is shown in tan. A total of 1,227 wells are included (Table 1) and categorized using: A) drilling water consumed; B) hydraulic water con- sumed; C) total water consumed; D) well type (vertical, hor- izontal, or extended horizontal); E) hydraulic fracturing stages or distance; F) hydraulic fracturing fluid; G) well coordinates; H) year; and I) target formation, if available. Water use is categorized as either drilling or hydraulic frac- turing water. Water used to drill the well, prepare the borehole, Table 1: The count of sampled wells separated by year and well type. Vertical Horizontal Extended horizontal 2010 181 6 0 2011 408 69 0 2012 227 196 2 2013 5 120 13 Total 821 391 15 and set the casings is defined as drilling water. Water used to fracture the shale, carry the proppant, and flush the well is de- fined as hydraulic fracturing water. Drilling and hydraulic fracturing water consumption records for each well are collected using Noble Energy’s WellView software [9] and separated by year. WellView is part of the Peloton suite of software used for collecting and organizing oil field data. Drilling and hydraulic fracturing reports are added to WellView by a Noble employee that is on-location at each drilling and hydraulic fracturing site. The water consumption totals are verified by Noble Energy’s accounting department and any conflict of values between the field operations and the accounting department are reconciled in WellView. The wa- ter use data was downloaded from Noble Energy’s WellView software on July 1, 2013. The drilling and hydraulic fracturing water use are summed, if both are available, to estimate the total water consumed. Wells are by separated by type (vertical, horizontal, or ex- tended horizontal) using Noble’s well naming system or the number of hydraulic fracturing stages, if available. Directional and deviated wells are categorized as vertical wells for this study because of similar water requirements. Horizontal wells are separated from extended horizontal wells by Noble’s well naming system or the number of hydraulic fracturing stages used when available. A horizontal well will typically be hy- draulically fractured in 20 stages. Recently, Noble has drilled and hydraulically fractured longer horizontal wells that can in- clude over 40 stages to hydraulically fracture. Horizontal wells that require over 30 hydraulic fracturing stages are defined as as extended horizontal wells in this study. The type of hydraulic fracturing fluid used and the number of hydraulic fracturing stages per well are collected from No- ble Energy’s WellView software. The well coordinates, year, and target formation are all collected COGCC’s online facili- ties database. An Anderson-Darling test [10] is used to test the normality of each subset of data. The di↵erence between water use for each subset of data is tested using a nonparametric Kruskal- Wallis test. A Dunn- ˘Sid´ak post-hoc comparison [11] is used to compare any di↵erences between samples that are found us- ing the Kruskal-Wallis test. A 95% confidence interval is used throughout the analysis. The number of hydraulic fracturing stages is correlated using a simple linear regression. A coef- ficient of determination is used to measure how well the re- gression correlates the hydraulic fracturing water use and the number of stages. Spatial autocorrelations are measured with ArcGIS Spatial Analyst tool [12] using Moran’s I with inverse 2 0 2 4 6 8 0 0.1 0.2 0.3 0.4 0.5 0.6 0.7 0.8 0.9 Water use (million gallons) Density Total water use by well type Vertical wells Horizontal wells Extended horizontal wellsdistance weighting and a 95% confidence interval. 942 wells have both drilling or hydraulic fracturing water and are included in the study. Wells that are drilled but not hydraulically fractured (260 sampled wells) are typically con- ventional wells recovering from an oil and gas trap. Wells that are hydraulically fractured but not drilled (25 sampled wells) are typically existing wells that are reworked or restimulated using hydraulic fracturing. 3. Results A Kruskal-Wallis test reveals there is a significant di↵er- ence between the median total water use for vertical, horizon- tal, and extended horizontal wells ( 2 (2)=609, p<0.05). Dunn- ˘Sid´ak post-hoc comparisons of the total water for the three well groups indicates that vertical wells (Mdn=360,000) use signif- icantly less total water than either horizontal (Mdn=2,891,000) or extended horizontal wells (Mdn=6,578,000). There is not a significant di↵erence between the total water use between hor- izontal and extended horizontal wells. 0 2 4 6 8 0 0.1 0.2 0.3 0.4 0.5 0.6 0.7 0.8 0.9 Water use (million gallons) Density Total water use by well type Vertical wells Horizontal wells Extended horizontal wells Figure 2: The distribution of drilling and hydraulic fracturing water use for ver- tical, horizontal, and extended horizontal wells is illustrated with a histogram. Vertical wells are shown in green, horizontal wells are shown in blue, and ex- tended horizontal wells are shown in red. Table 2: Descriptive statistics for total water use separated by well type. Total Vertical Horizontal Extended horizontal Q1 332,900 2,607,000 6,391,000 Q2 360,000 2,891,000 6,578,000 Q3 462,900 3,168,000 7,096,000 IQR 129,000 561,600 704,800 Skewness 9.1 2.9 -2.0 Kurtosis 99 20 5.0 Hydraulic fracturing uses the majority of the total water for all of the well types. For vertical wells, a median value of 81% (Q1=77%, Q3=85%) of the total water is used for hydraulic fracturing. Horizontal and extended horizontal wells use a me- dian value of 96% (Q1=95%, Q3=96%) and 98% (Q1=97%, Q3=98%) for hydraulic fracturing, respectively. The total water use for horizontal and extended horizon- tal wells correlates (r2 =0.66) to the number of stages used to hydraulically fracture each well (Figure 3). Wells defined as horizontal wells (less than 30 stages) are shown in blue re- gion and the wells defined as extended horizontal wells are shown in the red region. A linear regression using a least- squares linear fit is shown as a red line (Total water use in gal- lons=156,000x(Number of stages)-144,000). 5 10 15 20 25 30 35 40 45 0 1 2 3 4 5 6 7 8 Number of hydraulic fracturing stages Hydraulicfracturingwateruse(millionsofgallons) Horizontal wells Extended horizontal wells Figure 3: A simple linear regression between the number of hydraulic fracturing stages and the volume of hydraulic fracturing water used is shown with the red line. Horizontal wells (less than 30 stages) are shown in the blue region and extended horizontal wells are shown in the red region. When the total water use for horizontal and extended hor- izontal wells are normalized to the number of hydraulic frac- turing stages, the distribution of the total water per hydraulic fracturing stage is similar (Figure 4). When vertical wells are normalized to the vertical distance of the hydraulic fracturing there is not a correlation between the total water use (r2 =0.081) or hydraulic fracturing water use (r2 =0.073). Vertical wells are significantly influenced by the type of hy- draulic fracturing fluid used. The normalized hydraulic fractur- ing water use is significantly less for gelled fractures (Mdn=544 gallons per foot) than slickwater fractures (Mdn=1,340 gallons per foot) for vertical wells ( 2 (1)=42.4, p<0.05). Horizontal wells do not have enough slickwater data to compare gelled and slickwater hydraulic fracturing water use. Only the total water use for vertical wells shows any sig- nificant temporal variation ( 2 (3)=13.09, p<0.05) . The to- tal water use for vertical wells has decreased slightly from 2011 (Mdn=362,000) to 2012 (Mdn=352,000). Horizontal ( 2 (3)=6.03, p=.01103) or extended horizontal ( 2 (3)=2.45, p=0.117) wells do not show any significant temporal variation. The spatial distribution of the total water use is shown in Fig- ure 6. Vertical wells are shown in green, horizontal wells are 3 Water Use0 1 2 3 4 5 6 7 8 Wateruse(milliongallons) Drilling and hydraulic fracturing water by well type Drilling Hydraulic fracturing Drilling Hydraulic fracturing Drilling Hydraulic fracturing Vertical wells Horizontal wells Extended horiozontal wells Figure 7: The distribution of drilling and hydraulic fracturing water use for vertical, horizontal, and extended horizontal wells. The interquartile range is defined by the blue box, the median is defined by the red line, and outliers extending beyond the 10th and 90th percentile are shown with red pluses. Table 3: Descriptive statistics for drilling and hydraulic fracturing water use separated by well type. Drilling Vertical Horizontal Extended horizontal Q1 62,160 94,500 148,300 Q2 74,760 116,300 180,800 Q3 89,040 140,700 202,300 IQR 26,880 46,240 54,020 Skewness 12 0.97 0.40 Kurtosis 240 2.3 0.54 Hydraulic Vertical Horizontal Extended horizontal Fracturing Q1 269,400 2,490,000 6,127,000 Q2 278,900 2,792,000 6,517,000 Q3 395,000 3,033,000 6,883,000 IQR 125,700 543,000 757,300 Skewness 9.2 2.9 -2.1 Kurtosis 100 20 5.3 continue to in the future Table 1. The number of hydraulic fracturing stages should be the pri- mary consideration when estimating the total water use of hor- ter has remained constant or decreased slightly since 2010 for both vertical and horizontal wells. The majority of wells target the Niobrara formation and several vertical wells target multiple formations including the Niobrara. The water use is not statis- tically significant between target formations. Significant spatial autocorrelations do not show any obvious spatial patterns. The type of hydraulic fracturing fluid influences the volume of water required to hydraulically fracture a vertical well. Hy- draulic fracturing with slickwater requires nearly two times the water per hydraulic fracturing distance than using gelled fluids. It is also important to consider the volume of oil and gas recovered for each well type when comparing the total water use. Water use is often normalized to the amount of energy recovered with the water and is defined as the water intensity. This measure is an important value to consider for best water management practices. Although extended horizontal wells use the most water, it is likely they also recover much more oil and gas. An analysis of the water intensity for each well in the future will be important to optimizing water management. This study did not include flowback or produced water es- timates for each well. Flowback is the water that returns to the surface before production. This water is characterized by high solids content and closely resembles the hydraulic frac- turing fluid. Produced water is the water that returns with the oil and gas. This water is characterized by high concentrations of salts and closely resembles the formation water. E↵orts are being made to treat and reuse this water and further reduce the demands on water resources. As water reuse becomes more prevalent in the Wattenberg field, the net water use should be considered. The majority of the total water use for horizontal and ex- tended horizontal wells consists of hydraulic fracturing water. This results in large volumes of flowback water from horizon- tal and extended horizontal wells. The impact of water reuse for these wells becomes much more considerable than with vertical wells. 5. Conclusions As horizontal wells become more prevalent in the future, wa- ter demand predictions should be based on the number of hy- draulic fracturing stages rather than the number of wells. The number of hydraulic fracturing stages can range from three to 45 and the total water use can vary from a few hundred thou- sand gallons up to nearly eight million gallons per well. It is a mistake to simply assume that all of the wells use a specific volume of water, particularly as the lateral lengths of horizon- tal wells are becoming longer to minimize surface impacts and 0 1 2 3 4 5 6 7 8 Wateruse(milliongallons) Drilling and hydraulic fracturing water by well type Drilling Hydraulic fracturing Drilling Hydraulic fracturing Drilling Hydraulic fracturing Vertical wells Horizontal wells Extended horiozontal wells 7 8 9
  • 4. Spatial Distribution of Water Use 1Q: Horizontal wells 2Q: Horizontal wells 3Q: Horizontal wells 4Q: Horizontal wells 1Q: Vertical wells 2Q: Vertical wells 3Q: Vertical wells 4Q: Vertical wells 1Q: Extended horizontal wells 2Q: Extended horizontal wells 3Q: Extended horizontal wells 4Q: Extended horizontal wells Spatial Autocorrelation Spatially autocorrelated horizontal wells Spatially autocorrelated vertical wells Moran’s I used at 95 percent confidence interval with inverse distance weighting Total Water Use by Year 0 1 2 3 4 5 6 7 8 2010 2011 2012 2013 Vertical wells Totalwateruse(milliongallons) 0 1 2 3 4 5 6 7 8 2010 2011 2012 2013 Horizontal wells 10 11 12
  • 5. Water Use by Year 0 0.1 0.2 0.3 0.4 0.5 2010 2011 2012 2013 Drilling water Vertical wells Wateruse(milliongallons) 0 2 4 6 8 10 2010 2011 2012 2013 Hydraulic fracturing water Vertical wells 0 0.1 0.2 0.3 0.4 0.5 2010 2011 2012 2013 Drilling water Horizontal wells Wateruse(milliongallons) 0 2 4 6 8 10 2010 2011 2012 2013 Hydraulic fracturing water Horizontal wells 0 0.1 0.2 0.3 0.4 0.5 2010 2011 2012 2013 Drilling water Horizontal wells Wateruse(milliongallons) 0 2 4 6 8 10 2010 2011 2012 2013 Hydraulic fracturing water Horizontal wells Total Water Use Normalized by the Number of Hydraulic Fracturing Stages 5 10 15 20 25 30 35 40 45 0 1 2 3 4 5 6 7 8 Number of hydraulic fracturing stages Hydraulicfracturingwateruse(millionsofgallons) Horizontal wells Extended horizontal wells r2=0.66 Total Water Use Normalized by the Number of Hydraulic Fracturing Stages 0 0.1 0.2 0.3 0.4 0 0.2 0.4 Density Ratio of total water use and number of hydraulic fracturing stages Extended horizontal wells 0 0.1 0.2 0.3 0.4 0 0.2 0.4 Total water use per hydraulic fracturing stage (million gallons) Density Horizontal wells 13 14 15
  • 6. How efficiently is the water used? Water Intensity Drilling Water Hydraulic Fracturing Water Flowback Water Produced Water Formation Oil Gas Water Deep Well Injection Drilling Energy Hydrualic Fracturing Energy Oil Recovered Gas Recovered Water Treatment Water Reuse Treatment Energy Water Intensity Transportation Energy Water Intensity Net Water Consumed (Gallons) Net Energy Recovered (MMBtu) = Water Use per Well (First Study, 2010-2011) ydraulic Fracturing Water Total 0.00672 0.07224 0.0084 0.07392 0.00798 0.07476 0.01722 0.08274 0.0084 0.08484 0.00882 0.0861 0.01176 0.08694 0.00588 0.08694 0.0084 0.08694 0.01302 0.08736 0.0084 0.08736 0.0042 0.0882 0.01932 0.08883 0.00756 0.09072 0.00882 0.09618 0.051492 0.121212 0.057456 0.166026 0.112476 0.169596 0.11655 0.17241 0.11592 0.1911 0.15162 0.20916 0.147042 0.222222 0.156156 0.227976 0.166908 0.232428 0.148218 0.238308 0.155022 0.243852 0.244734 0.290934 0.227724 0.293244 0.11403 0.29463 0.22806 0.29715 0.241458 0.304458 0.271614 0.307314 0.270312 0.307692 0.27594 0.30954 0.251202 0.310632 0.273924 0.312144 0.271026 0.313866 0.250194 0.314454 0.273126 0.314706 0.27972 0.31479 0.275898 0.315588 0.230202 0.315882 0.270312 0.316512 0.267834 0.317814 0.275478 0.319788 0.264138 0.321678 0.2604 0.32256 0.273 0.32256 0.268254 0.322854 0.270186 0.323106 0.274848 0.323988 0.267456 0.326256 0.277872 0.326382 1 2 3 4 5 0 100 200 300 400 WaterConsumption(milliongallons) Noble Well Water Consumption Ranking Horizontal Drilling Water Horizontal Hydraulic Fracturing Water Vertical Drilling Water Vertical Hydraulic Fracturing Water (Gallons) Drilling Water Hydraulic Fracturing Water Total Water (Gallons)(Gallons)(Gallons) Horizontal Well Vertical Well 129,000 2,720,000 2,840,000 76,800 305,000 382,000 445 NOBLE WELLS: 386 VERTICAL AND 59 HORIZONTAL 16 17 18
  • 7. Water and Energy Consumption 0 0.5 1 1.5 2 2.5 3 3.5 Drilling Water Hydraulic Fracturing Water Total Water WaterConsumed(MMgal) Water Use for Sampled Wells Student Version of MATLAB Water Intensity Drilling Water Hydraulic Fracturing Water Flowback Water Produced Water Formation Oil Gas Water Deep Well Injection Drilling Energy Hydrualic Fracturing Energy Oil Recovered Gas Recovered Water Treatment Water Reuse Treatment Energy Water Intensity Transportation Energy Water Intensity Net Water Consumed (Gallons) Net Energy Recovered (MMBtu) = Estimated Ultimate Recovery 15 20 25 30 35 32640 33290 33670 33910 34090 34220 52340 53630 54360 54850 55190 55450 61720 196880 225980 251270 273890 294490 97020 362300 416330 463290 505280 545550 Gas Production (mcf) 0 5 10 15 20 25 30 35 Low b=0.6 Median b=0.6 Median b=1.8 High b=1.8 0 175310 188140 193510 196580 198610 200060 201160 0 258790 276460 283840 288050 290820 292810 294320 0 583900 833900 1020700 1175400 1309800 1430100 1539700 0 930400 1399700 1754400 2049600 2306800 2537300 2747600 Gas Production (boe) 0 5 10 15 20 25 30 35 Low b=0.6 Median b=0.6 Median b=1.8 High b=1.8 0 29218 31357 32252 32763 33102 33343 33527 0 43132 46077 47307 48008 48470 48802 49053 0 97317 138983 170117 195900 218300 238350 256617 0 155067 233283 292400 341600 384467 422883 457933 15 20 25 30 35 32640 33290 33670 33910 34090 34220 19700 20340 20690 20940 21100 21230 09380 143250 171620 196420 218700 239040 35300 165420 190350 212020 231390 251060 0 100,000 200,000 300,000 0 5 10 15 20 25 30 35 Oil EUR of Sampled Wells EstimatedUltimateRecovery(BOE) Well Lifespan (Years) Gas Production (boe) Sectioned 0 5 10 15 20 25 30 35 Low b=0.6 Median b=0.6 Median b=1.8 High b=1.8 0 29218 31357 32252 32763 33102 33343 33527 0 13913 14720 15055 15245 15368 15458 15527 0 54185 92907 122810 147892 169830 189548 207563 0 57750 94300 122283 145700 166167 184533 201317 0 5 10 15 20 25 30 35 Gas EUR of Sampled Wells Well Lifespan (Years) Percentile Total Energy (BOE) 5th 50th 95th 1945 228 0 g 15 20 25 30 35 3790 3810 3830 3830 3840 3840 8500 8500 8500 8600 8600 8600 69170 83190 94790 104860 113860 120000 05400 367400 418600 463200 503000 539300 15 20 25 30 35 59180 160020 160860 160860 161280 161280 57000 357000 357000 361200 361200 361200 Flowback and Produced (gallons) Sectioned 0 5 10 15 20 25 30 35 Low b=0.6 Median b=0.6 Median b=1.8 High b=1.8 132678 289758 291858 292698 293538 293538 293958 293958 132678 324198 330498 329658 328818 333018 332598 332598 132678 1898778 2680818 3269658 3756858 4175598 4553598 4811478 132678 7346178 10054338 12069498 13732698 15182958 16476558 17743278 Total (MMBtu) 0 5 10 15 20 25 30 35 Low b=0.6 Median b=0.6 Median b=1.8 High b=1.8 0 359981 382443 391732 397090 400568 403102 404986 0 551103 587279 602337 610892 616578 620593 623651 0 1263689 1793659 2189287 2516826 2801435 3056087 3288043 0 2169569 3158467 3901126 4517475 5053820 5533937 5983307 19 20 21
  • 8. Estimated Ultimate Water Recovery 30 35 161280 161280 361200 361200 4782120 5040000 21126000 22650600 30 35 161280 161280 199920 199920 4420920 4678800 16343880 17610600 0 1,200,000 2,400,000 3,600,000 4,800,000 6,000,000 0 5 10 15 20 25 30 35 Flowback and Produced Water EUR of Sampled Wells FlowbackandProducedWater(Gallons) Well Lifespan (Years) 25 30 35 2826978 2826558 2826558 2626638 2626638 2626638 -1416282 -1794282 -2052162 -16466562 -18138162 -19662762 25 30 35 3830 3840 3840 8600 8600 8600 104860 113860 120000 463200 503000 539300 25 30 35 160860 161280 161280 361200 361200 361200 4404120 4782120 5040000 19454400 21126000 22650600 25 30 35 2907408 2907198 2907198 2807238 2807238 2807238 785778 596778 467838 -6739362 -7575162 -8337462 Net Water Use (100% reuse) Sectioned 0 5 10 15 20 25 30 35 Low b=0.6 Median b=0.6 Median b=1.8 High b=1.8 2987838 -6340362 -9838962 -12442962 -14593362 -16466562 -18138162 -19662762 2987838 873138 82698 -506142 -993342 -1416282 -1794282 -2052162 2987838 2639238 2630838 2630838 2630838 2626638 2626638 2626638 2987838 2830758 2828658 2827818 2826978 2826978 2826558 2826558 Net Water Use (100% reuse) Sectioned 0 5 10 15 20 25 30 35 Low b=0.6 Median b=0.6 Median b=1.8 High b=1.8 2987838 -6340362 -9838962 -12442962 -14593362 -16466562 -18138162 -19662762 0 7213500 9921660 11936820 13600020 15050280 16343880 17610600 0 1766100 2548140 3136980 3624180 4042920 4420920 4678800 0 191520 197820 196980 196140 200340 199920 199920 0 5 10 15 20 25 30 35 Net Water Use with 100 Percent Reuse Well Lifespan (Years) Net Water Use (50% reuse) Sectioned 0 5 10 15 20 25 30 35 Low b=0.6 Median b=0.6 Median b=1.8 High b=1.8 2987838 -1676262 -3425562 -4727562 -5802762 -6739362 -7575162 -8337462 2987838 1930488 1535268 1240848 997248 785778 596778 467838 2987838 2813538 2809338 2809338 2809338 2807238 2807238 2807238 2987838 2909298 2908248 2907828 2907408 2907408 2907198 2907198 Net Water Use (50% reuse) Sectioned 0 5 10 15 20 25 30 35 Low b=0.6 Median b=0.6 Median b=1.8 High b=1.8 2987838 -1676262 -3425562 -4727562 -5802762 -6739362 -7575162 -8337462 0 3606750 4960830 5968410 6800010 7525140 8171940 8805300 0 883050 1274070 1568490 1812090 2021460 2210460 2339400 0 95760 98910 98490 98070 100170 99960 99960 -3,000,000 -2,250,000 -1,500,000 -750,000 0 750,000 1,500,000 2,250,000 3,000,000 0 5 10 15 20 25 30 35 Net Water Use with 50 Percent Reuse Well Lifespan (Years) 30 35 403102 404986 620593 623651 3056087 3288043 5533937 5983307 30 35 7.4 7.4 4.8 4.8 1.0 0.9 0.5 0.5 30 35 3 3 4 4 0 0 1 0 30 35 1 0 0 0 4 4 3 3 Estimated Water Intensity (0% Water Reuse) Water Intensity (100% Reuse) 0 5 10 15 20 25 30 35 Low b=0.6 Median b=0.6 Median b=1.8 High b=1.8 7.9 7.4 7.2 7.1 7.1 7.0 7.0 4.8 4.5 4.4 4.3 4.3 4.2 4.2 0.7 0.0 -0.2 -0.4 -0.5 -0.6 -0.6 -2.9 -3.1 -3.2 -3.2 -3.3 -3.3 -3.3 Water Intensity (0% Reuse) 0 5 10 15 20 25 30 35 Low b=0.6 Median b=0.6 Median b=1.8 High b=1.8 3 3 3 3 3 3 3 4 4 5 5 5 5 5 4 3 3 3 3 3 3 -3 -3 -3 -3 -3 -3 -3 Water Intensity (0% Reuse) 0 5 10 15 20 25 30 35 Low b=0.6 Median b=0.6 Median b=1.8 High b=1.8 -3 -3 -3 -3 -3 -3 -3 4 3 3 3 3 3 3 4 4 5 5 5 5 5 3 3 3 3 3 3 3 Estimated Water Intensity (100% Water Reuse) Water Neutrality Water Neutrality Water Neutrality Water Neutrality Water Intensity (50% Reuse) 0 5 10 15 20 25 30 35 Low b=0.6 Median b=0.6 Median b=1.8 High b=1.8 8.3 7.6 7.4 7.3 7.3 7.2 7.2 5.4 4.8 4.7 4.6 4.6 4.5 4.5 2.4 1.1 0.7 0.5 0.4 0.3 0.2 1.4 -0.5 -0.9 -1.0 -1.1 -1.2 -1.3 How does the water intensity compare? 0 15 30 45 60 SurfaceMining UndergroundMining U.S.WeightedAverage Preparation Synfuel:CoalGasification Synfuel:FisherTropsch Conventional NorthernColoradoShaleGas(0%Reuse) NorthernColoradoShaleGas(50%Reuse) NorthernColoradoShaleGas(100%Reuse) Preparation Gas-to-Liquids Primary ConventionalFlooding SaudiArabiaAverage OilSands OilShale U.S.On-ShoreAverage EnhancedOilRecovery ConventionalRefining OilShaleProcessing OilSandsProcessing Mining Enrichment Extraction and Processing Water Intensity by Fuel Source ConsumptiveWaterIntensity(gal/MMBtu) 3.5 19 51 1.5 2.9 2.4 1.8 1 42 1.5 14 22 35 39 58 58 10 39 48 3.5 6 Ethanol from Irrigated Corn Extraction: 16,000 Processing: 60 Biodiesel from Soy Extraction: 45,000 Processing: 300 Biodiesel from Rapeseed Extraction: 16,000 Processing: 300 Coal OilNatural Gas Extraction Processing Uranium Extraction Processing Extraction Processing Wind (Turbine) 0 Solar (Photovoltaic) 0 22 23 24
  • 9. Water Consumption of Energy Resource Extraction, Processing, and Conversion reserve estimates ranging from 2.1 to 6.7 MMBtu (2.0 to 6.5 BCF) per well, giving a company- wide range of 0.6 to 1.8 gal/MMBtu (See Table 2-2). (Chesapeake Energy 2010) Table 2-2: Estimates of water consumption for different shale plays (Chesapeake Energy 2010) Water consumption per well (million gal) Gas reserves per well Water intensity Shale play Drilling Hydraulic Fracturing Total BCF MMBtu (million) gal/MMBtu Barnett 0.3 3.8 4.1 2.7 2.7 1.5 Fayetteville 0.1 4.0 4.1 2.4 2.5 1.7 Haynesville 0.6 5.0 5.6 6.5 6.7 0.8 Marcellus 0.1 5.5 5.6 4.2 4.3 1.3 Typical min 1.0 3.5 4.5 6.5 6.7 0.6 Typical max 0.1 3.5 3.6 2.0 2.1 1.8 Average 1.3 The estimates are specific to one company’s operations (i.e. Chesapeake Energy) and reflect typical water-intensity across its asset portfolio, not necessarily a representative range of water- intensity for the industry as a whole. But alternative estimates for Marcellus and Barnett provide comfort that the order of magnitude is appropriate, especially in the context of comparable water- intensity of alternative fossil fuels. Marcellus data The U.S. Geological Survey published a factsheet on water issues relating to the Marcellus shale gas developments (Soeder and Kappel 2009), summarized in Table 2-4. The USGS estimates show a similar average water-intensity to the Chesapeake Energy data, at 1.2 and 1.3 gal/MMBtu respectively, albeit with lower water-consumption per well and lower estimated recoverable reserves per well (roughly half the Chesapeake Energy estimates). Table 2-3: USGS estimates for Marcellus shale (2009) Reserves per well (BCF) 2.5 Reserves per well (million MMBtu) 2.6 Hydraulic fracturing (million gal) 3.0 Average (gal/MMBtu) 1.2 The Susquehanna River Basin Commission (SRBC) regulates water access for a significant portion of the Marcellus shale, covering parts of Pennsylvania, New York, and Maryland. The SRBC estimated in January of 2010 that a typical Marcellus shale stimulation uses between four and seven million gal of water over a two to five-day period, with about 15% of the water flowing back to the surface in the first two months (Susquehanna River Basin Commission 2010), comparable to the Chesapeake estimates. However, based on actual data from approximately 200 wells drilled between June 2008 and March 2009, the SRBC estimates that the average well 18 Water Intensity Comparison Source: E. Mielke, L. D. Anadon, and V. Narayanamurti. Water consumption of energy resource extraction, processing, and conversion. Discussion Paper 2010-15, Harvard Kennedy School Belfer Center for Science and International Affairs, 79 JFK Street, Cambridge, MA 02138, October 2010. Water Intensity Comparison Source: Chesapeake Energy. Water use in deep shale gas exploration. Fact Sheet, September 2011. Once-Through Cooling Closed-Loop Cooling Closed-Loop Cooling with Carbon Capture Dry Cooling IGCC: Closed-Loop Cooling IGCC: Closed-Loop Cooling with Carbon Capture IGCC: Wet Tower IGCC: Wet Tower with Carbon Capture Combined-Cycle Gas Turbine: Once- Through Cooling Combined-Cycle Gas Turbine: Closed-Loop Cooling Combined-Cycle Gas Turbine: Closed-Loop Cooling with Carbon Capture Combined-Cycle Gas Turbine: Dry Cooling Combined-Cycle Gas Turbine: Cooling Pond Combined-Cycle Gas Turbine: Wet Tower Combined-Cycle Gas Turbine: Wet Tower with Carbon Capture Once-Through Cooling Closed-Loop Cooling Closed-Loop Cooling with Carbon Capture Dry Cooling Cooling Pond Wet Tower Parabolic Troughs: Wet Cooling Parabolic Troughs: Dry Cooling Tower: Wet Cooling U.S. Weighted Average of Large-Scale Concentrating Solar Power Dish: Stirling Cycle Photovoltaics Concentrated Solar Photovoltaics Wind 315 405 420 15 369 330 760 500 115 195 190 15 240 130 500 415 575 590 15 680 850 910 80 820 800 10 2 2 0 0 250 500 750 1000 Once-ThroughCooling Closed-LoopCooling Closed-LoopCoolingwithCarbonCapture DryCooling IGCC:Closed-LoopCooling IGCC:Closed-LoopCoolingwithCarbonCapture IGCC:WetTower IGCC:WetTowerwithCarbonCapture Combined-CycleGasTurbine:Once-ThroughCooling Combined-CycleGasTurbine:Closed-LoopCooling Combined-CycleGasTurbine:Closed-LoopCoolingwithCarbonCapture Combined-CycleGasTurbine:DryCooling Combined-CycleGasTurbine:CoolingPond Combined-CycleGasTurbine:WetTower Combined-CycleGasTurbine:WetTowerwithCarbonCapture Once-ThroughCooling Closed-LoopCooling Closed-LoopCoolingwithCarbonCapture DryCooling CoolingPond WetTower ParabolicTroughs:WetCooling ParabolicTroughs:DryCooling Tower:WetCooling U.S.WeightedAverageofLarge-ScaleConcentratingSolarPower Dish:StirlingCycle Photovoltaics ConcentratedSolarPhotovoltaics Wind Electricity Generation Water Intensity by Fuel Source ConsumptiveWaterIntensity(gal/MWh) Coal Natural Gas Uranium Solar Wind Geothermal Electricity Generation: 3,600 Hydropower Electricity Generation: 4,500 25 26 27
  • 10. Once-Through Cooling Closed-Loop Cooling Closed-Loop Cooling with Carbon Capture Dry Cooling IGCC: Closed-Loop Cooling IGCC: Closed-Loop Cooling with Carbon Capture IGCC: Wet Tower IGCC: Wet Tower with Carbon Capture Combined-Cycle Gas Turbine: Once- Through Cooling Combined-Cycle Gas Turbine: Closed-Loop Cooling Combined-Cycle Gas Turbine: Closed-Loop Cooling with Carbon Capture Combined-Cycle Gas Turbine: Dry Cooling Combined-Cycle Gas Turbine: Cooling Pond Combined-Cycle Gas Turbine: Wet Tower Combined-Cycle Gas Turbine: Wet Tower with Carbon Capture Once-Through Cooling Closed-Loop Cooling Closed-Loop Cooling with Carbon Capture Dry Cooling Cooling Pond Wet Tower Parabolic Troughs: Wet Cooling Parabolic Troughs: Dry Cooling Tower: Wet Cooling U.S. Weighted Average of Large-Scale Concentrating Solar Power Dish: Stirling Cycle Photovoltaics Concentrated Solar Photovoltaics Wind 35030 480 420 30 389 376 750 620 13780 260 217 30 150 560 42530 830 590 30 800 950 910 80 820 800 10 2 2 0 0 12500 25000 37500 50000 Once-ThroughCooling Closed-LoopCooling Closed-LoopCoolingwithCarbonCapture DryCooling IGCC:Closed-LoopCooling IGCC:Closed-LoopCoolingwithCarbonCapture IGCC:WetTower IGCC:WetTowerwithCarbonCapture Combined-CycleGasTurbine:Once-ThroughCooling Combined-CycleGasTurbine:Closed-LoopCooling Combined-CycleGasTurbine:Closed-LoopCoolingwithCarbonCapture Combined-CycleGasTurbine:DryCooling Combined-CycleGasTurbine:CoolingPond Combined-CycleGasTurbine:WetTower Combined-CycleGasTurbine:WetTowerwithCarbonCapture Once-ThroughCooling Closed-LoopCooling Closed-LoopCoolingwithCarbonCapture DryCooling CoolingPond WetTower ParabolicTroughs:WetCooling ParabolicTroughs:DryCooling Tower:WetCooling U.S.WeightedAverageofLarge-ScaleConcentratingSolarPower Dish:StirlingCycle Photovoltaics ConcentratedSolarPhotovoltaics Wind Electricity Generation Water Intensity by Fuel Source WithdrawnWaterIntensity(gal/MWh) Coal Natural Gas Uranium Solar Wind Geothermal Electricity Generation: 3,600 els 1.5 25 0 12.5 25 37.5 50 ElectricVehicle(PHEV/EV):WindanPhotovoltaic BiodieselfromNonirrigatedSoybeans CNGusingNaturalGasforCompression HydrogenFuelCellwithElectrolysisviaWindandPhotovoltaic HydrogenfromNaturalGas CNGusingElectricityforCompression Diesel Gasoline ElectricVehicle(PHEV/EV):U.S.Grid Plug-InHybridElectricVehicle EthanolfromNonirrigatedCorn OilShaleGasoline SynDieselfromNaturalGas ElectricVehicle OilShaleGasoline HydrogenFuelCellwithElectrolysisviaU.S.Grid SynDieselfromCoal HydrogenviaElectrolysis Coal Oil Natural Gas Solar and Wind Biofuels ConsumptiveWaterIntensity(gallonsper100milesdriven) Water Intensity of Transportation Carey W. King and Michael E. Webber Environmental Science and Tehcnology 2008 42 (21), 7866-7872 Stephen Goodwin stephen.goodwin@colostate.edu Department of Civil and Environmental Engineering Colorado State University cewc.colostate.edu Questions? 28 29 30