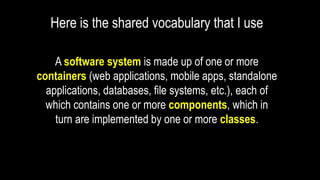
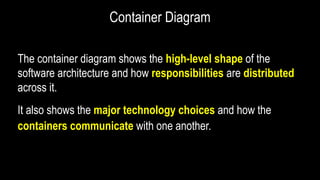
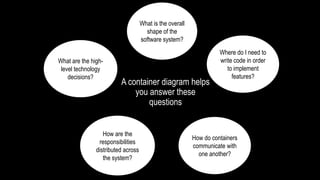
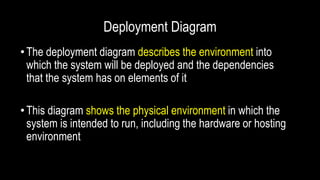
The document discusses service description, which is a software architecture document that visually diagrams components, dependencies, and communication using diagrams and text. It provides key details for understanding the problem and solution domains. The document recommends creating context, container, component, and deployment diagrams to illustrate the software architecture at different levels. These diagrams help technical and non-technical audiences understand the system. Sample diagrams are provided for each type to demonstrate how they can be used to visualize the architecture and answer common questions about the system. Maintaining an up-to-date service description is important to keep it relevant over time.
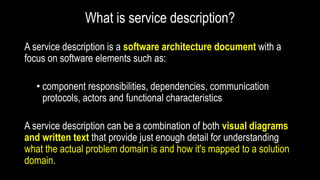

![A Sample Context Diagram
Customer
Event Manager
[ Person ]
[ Person ]
ABC Customer
An event manager manages
events
Event Management System (EMS)
[ Software System ]
EMS manages event definition and its lifecycle
Views events
and buy tickets
Manages events](https://image.slidesharecdn.com/visualizingsoftwarearchitecture-170806171731/85/Visualizing-Software-Architecture-Effectively-in-Service-Description-13-320.jpg)

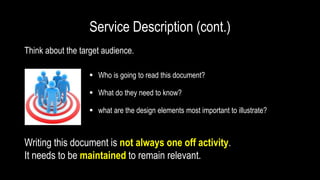
![A Sample Container Diagram
Customer
Event Manager
[ Person ]
[ Person ]
ABC Customer An event manager manages events
Event Management System (EMS) Boundary
Views events and buy tickets
Manages events
Uses
[ REST ]
[ HTTPS ]
Uses
[ REST ]
[ HTTPS ]
RDBMS
[Container: Oracle]
Stores event definition
WEB APPLICATION
[Container: Jetty]
Allows users to manage event
definition and its lifecycle
Reads from
and writes
data to
[ JDBC, port:
3306 ]](https://image.slidesharecdn.com/visualizingsoftwarearchitecture-170806171731/85/Visualizing-Software-Architecture-Effectively-in-Service-Description-17-320.jpg)
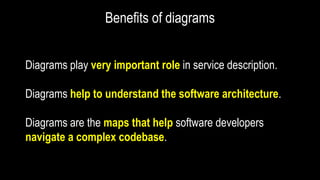
![A Sample Component Diagram
Relational Database
[Container: Oracle]
Stores event definitions
Event Component
[Component: Spring Bean + Spring Data + JPA2 + Spring HATEOAS + Spring
Security + Spring MVC + Hibernate + JDBC]
Manages event’s definition and it’s lifecycle
Ticket Component
[Component: Spring Bean + Spring Data +
Hibernate + JDBC]
Manages ticket details
Logging Component
[Component: SLF4J + Logback]
Provides logging facilities to all
other components
Reads from and writes data to
[ SQL/JDBC, port 3306 ]
Associate events with
the tickets using
Used by all components
Customer Component
[Component: Spring Bean + Spring Data +
Hibernate + JDBC]
Manages customer details
Associate events with
the customers using](https://image.slidesharecdn.com/visualizingsoftwarearchitecture-170806171731/85/Visualizing-Software-Architecture-Effectively-in-Service-Description-21-320.jpg)


![Lect 1 Number systems and base conversions. [Autosaved].pptx](https://cdn.slidesharecdn.com/ss_thumbnails/lect1numbersystemsandbaseconversions-260111134109-67c2d865-thumbnail.jpg?width=640&height=640&fit=bounds)


