Download to read offline
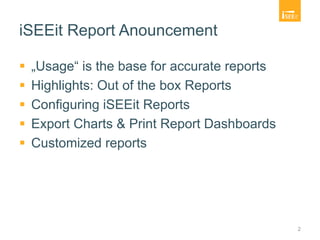
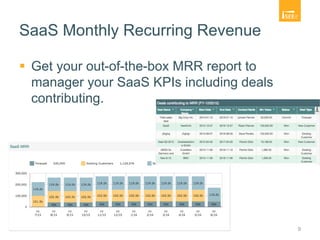
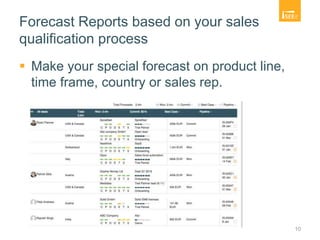
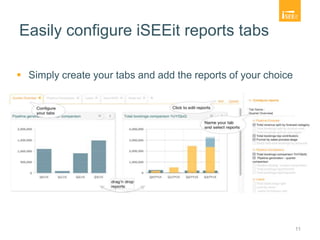
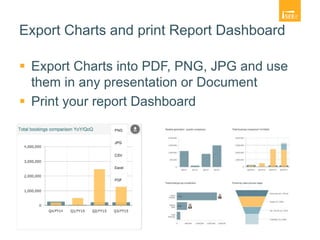

The document discusses the features of the iseeit sales CRM, highlighting its high user adoption rate and the accuracy of real-time data reports. It emphasizes the capability for customized and out-of-the-box reports to track sales KPIs, lead generation, and forecast reports. Additionally, users can easily export charts and configure reports to suit their needs.


