Downloaded 13 times
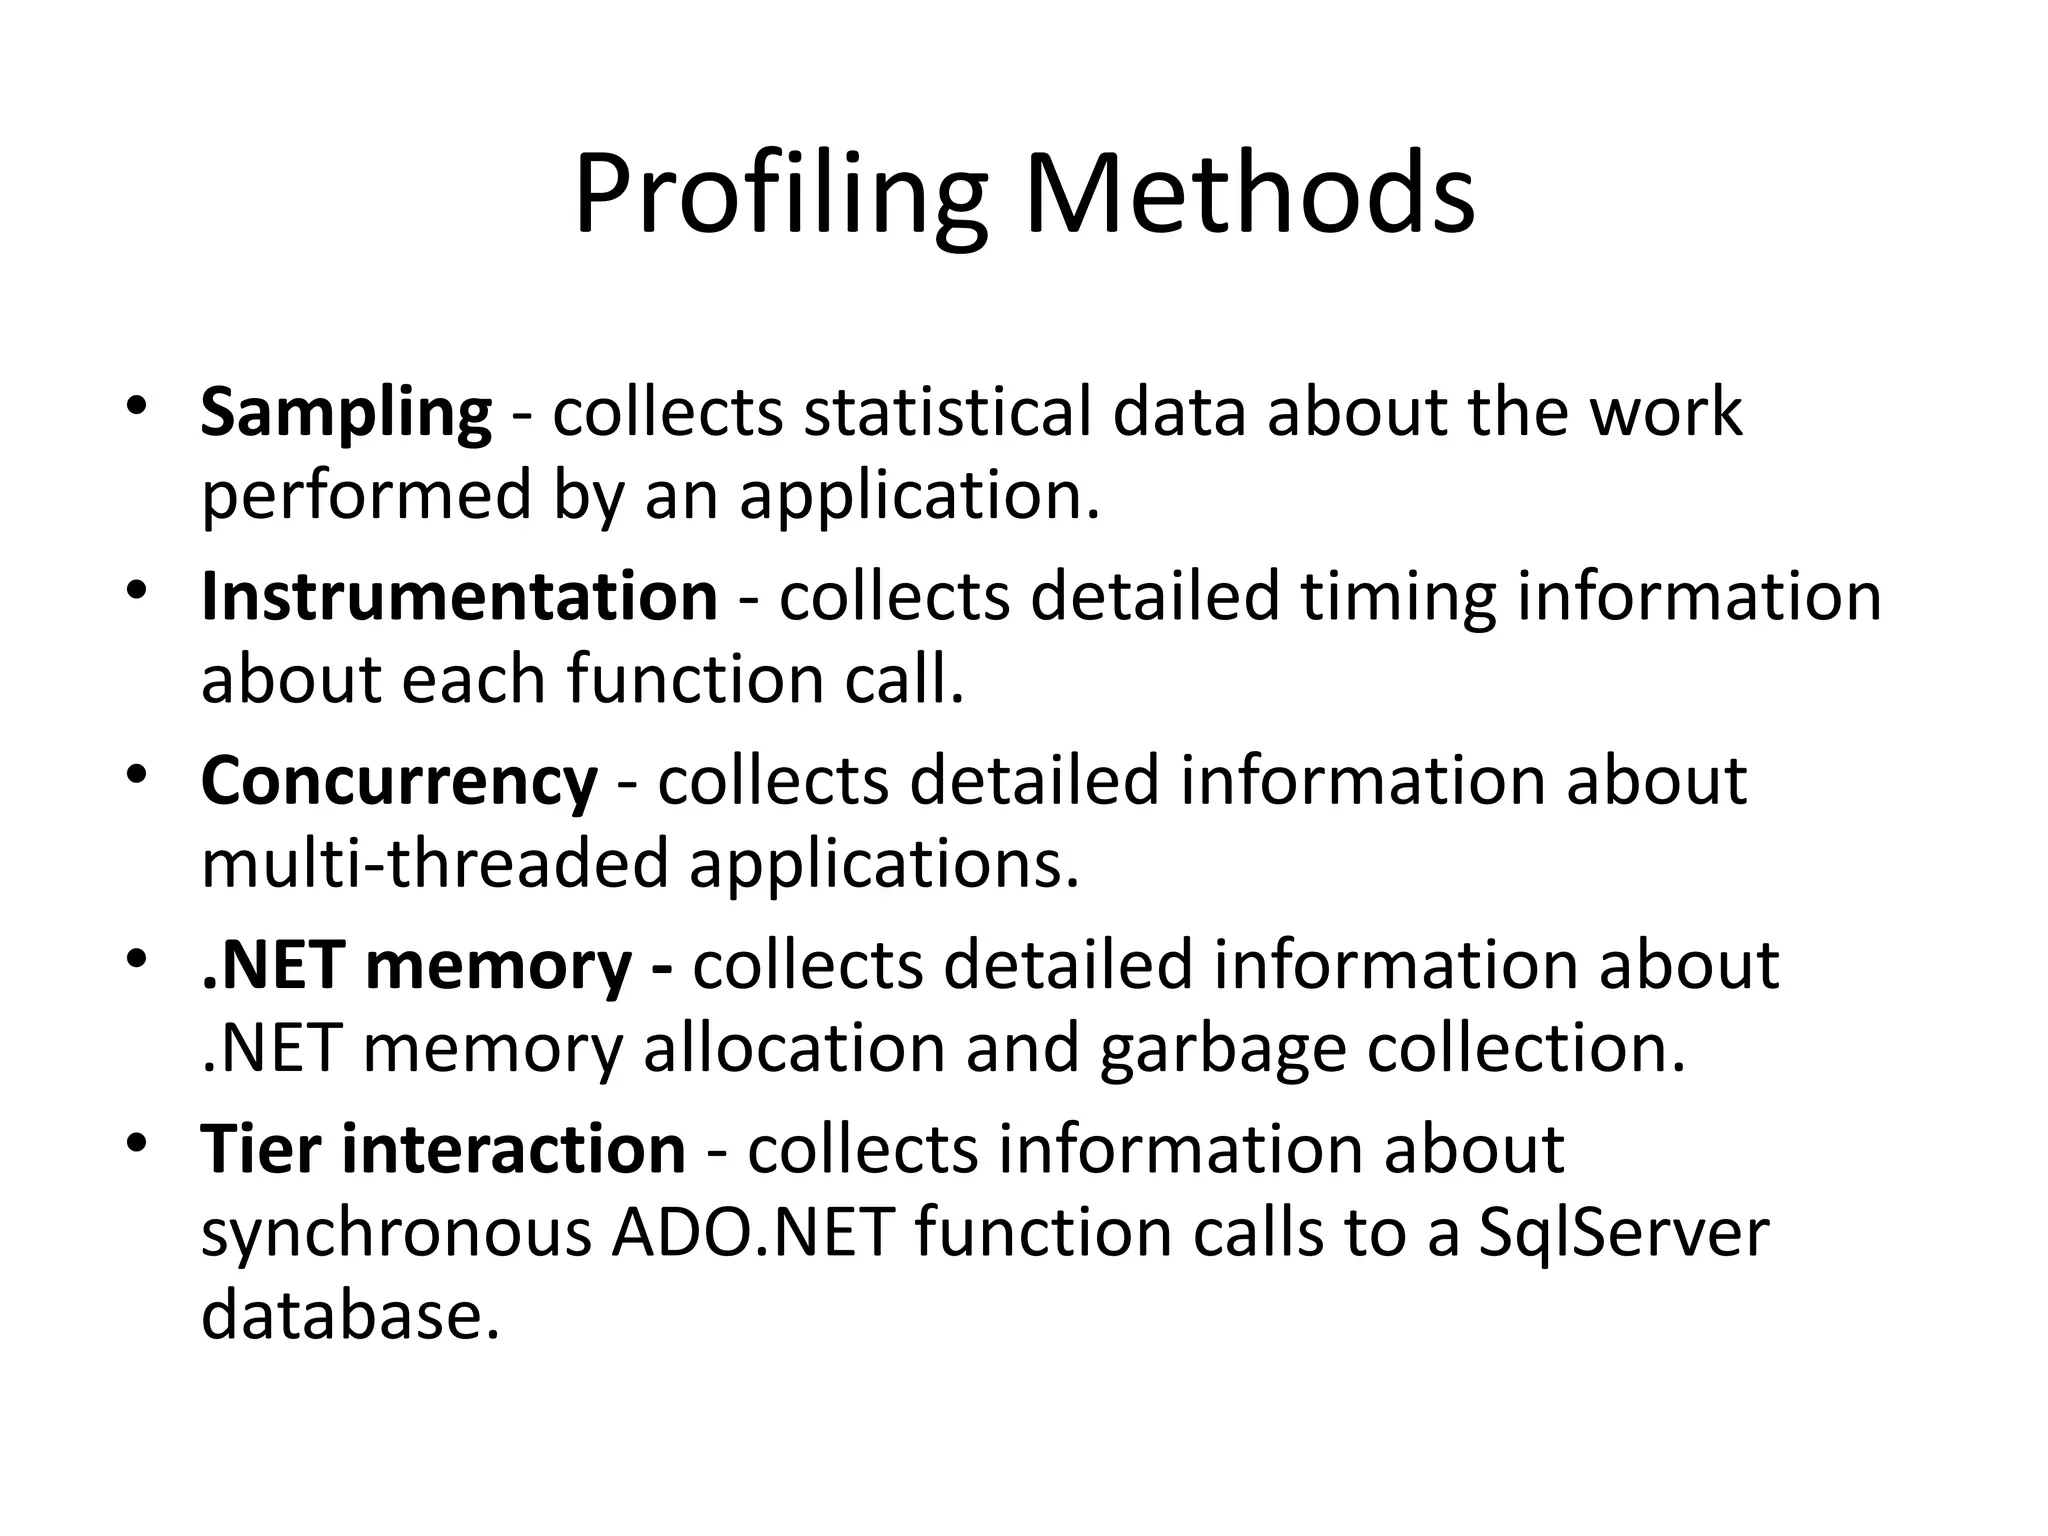
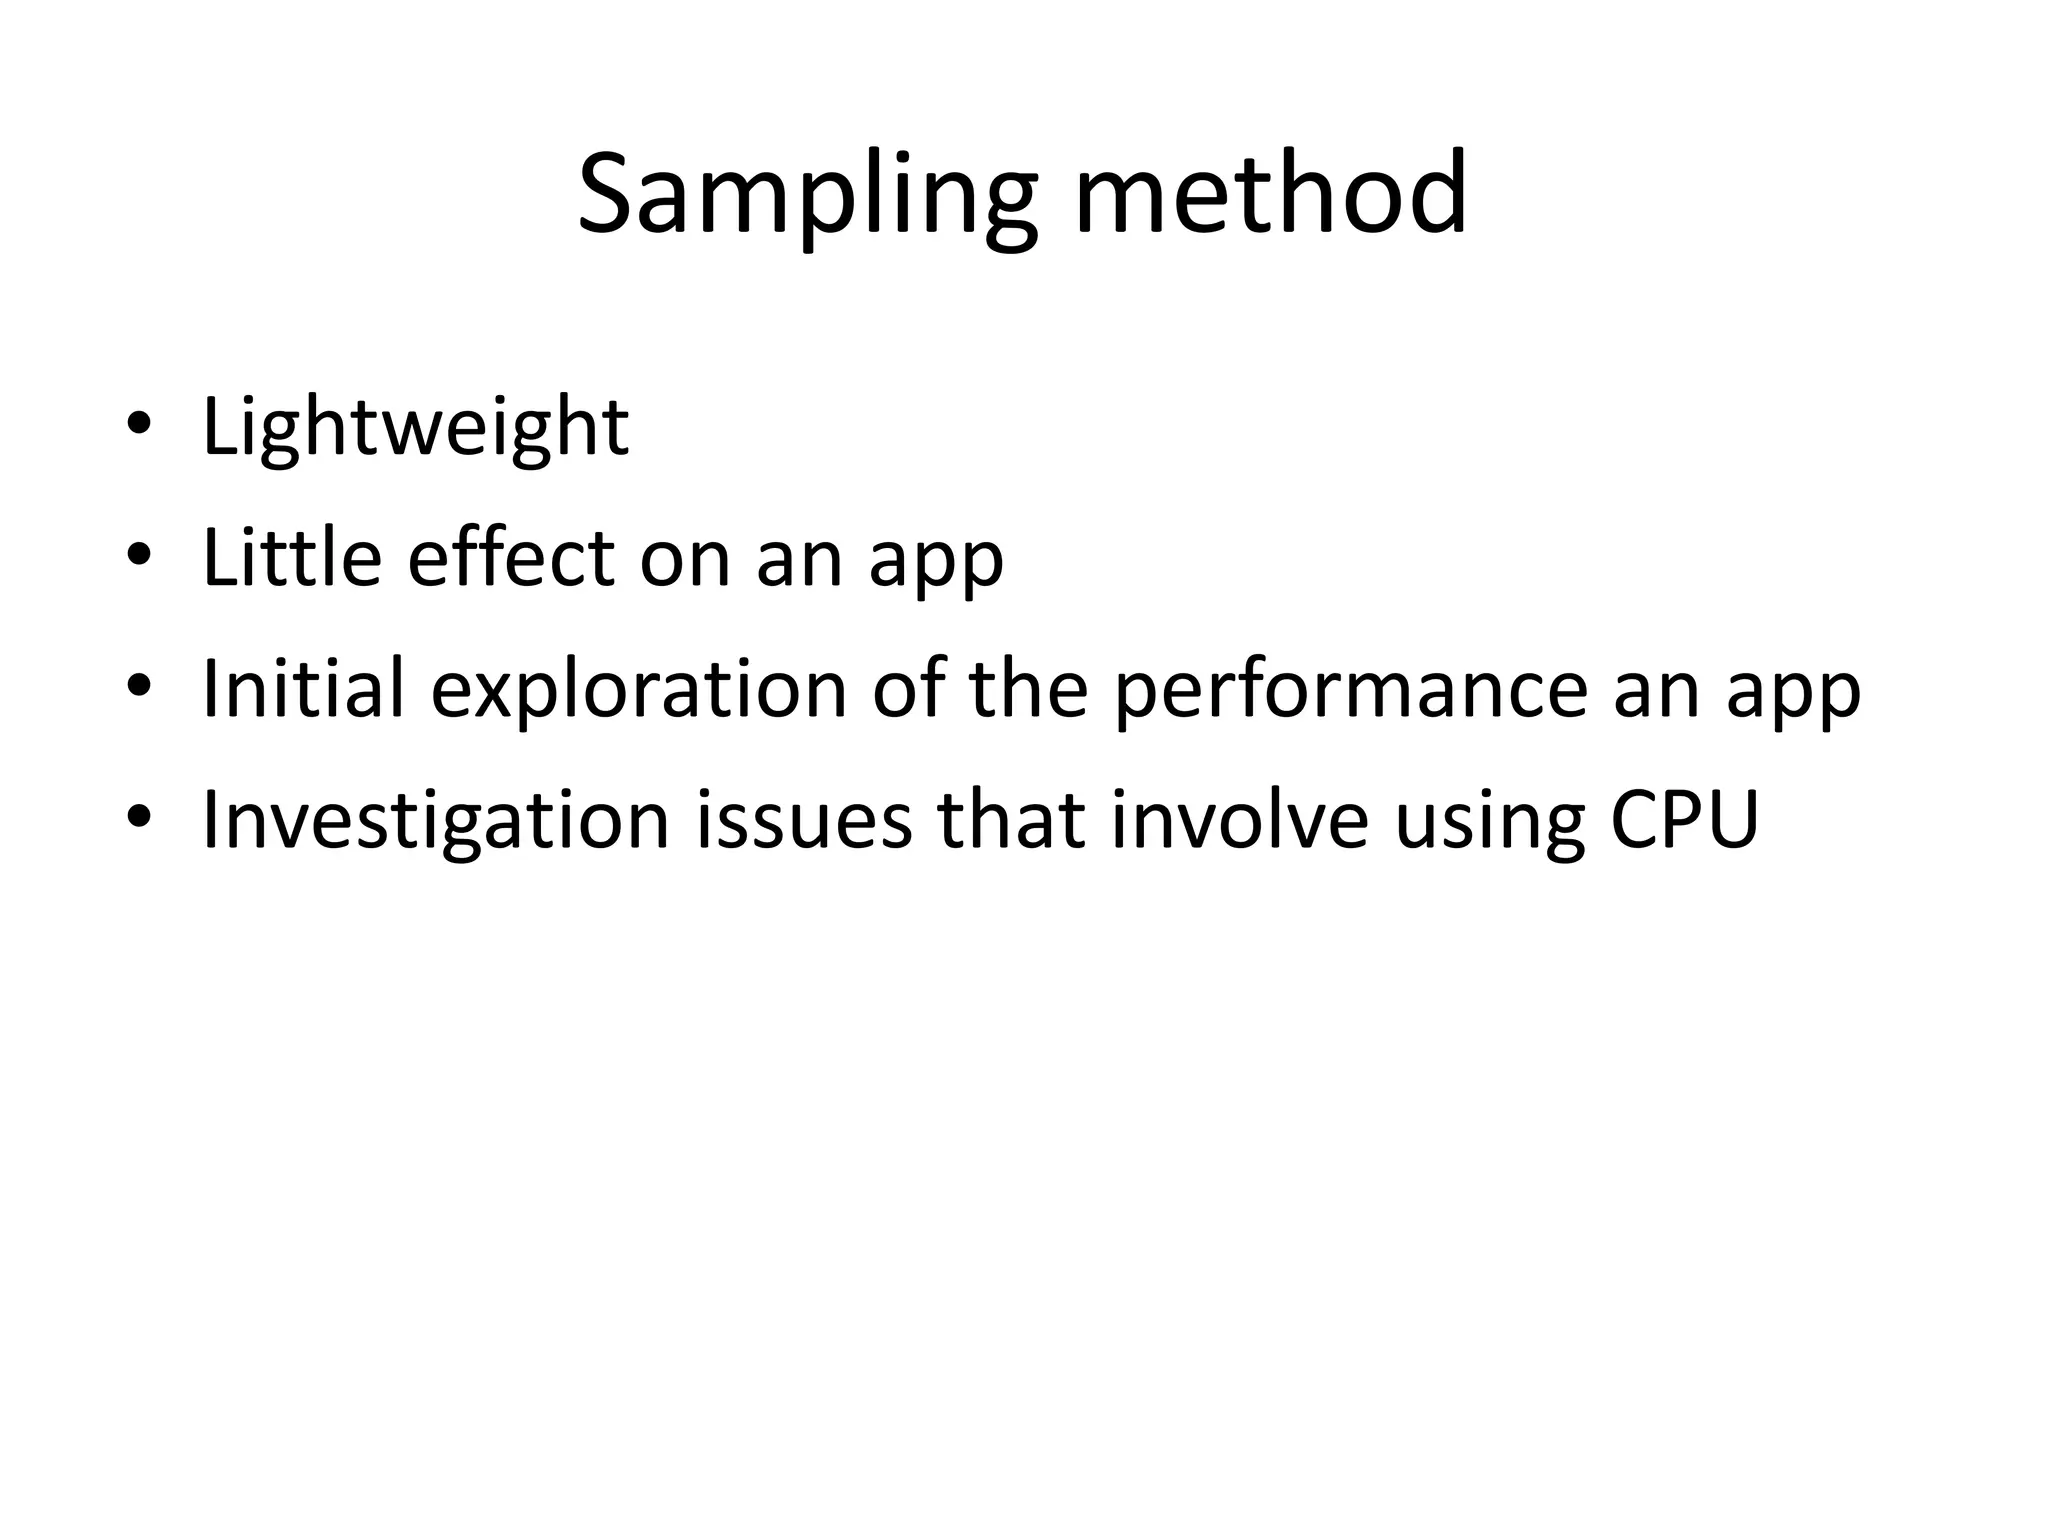
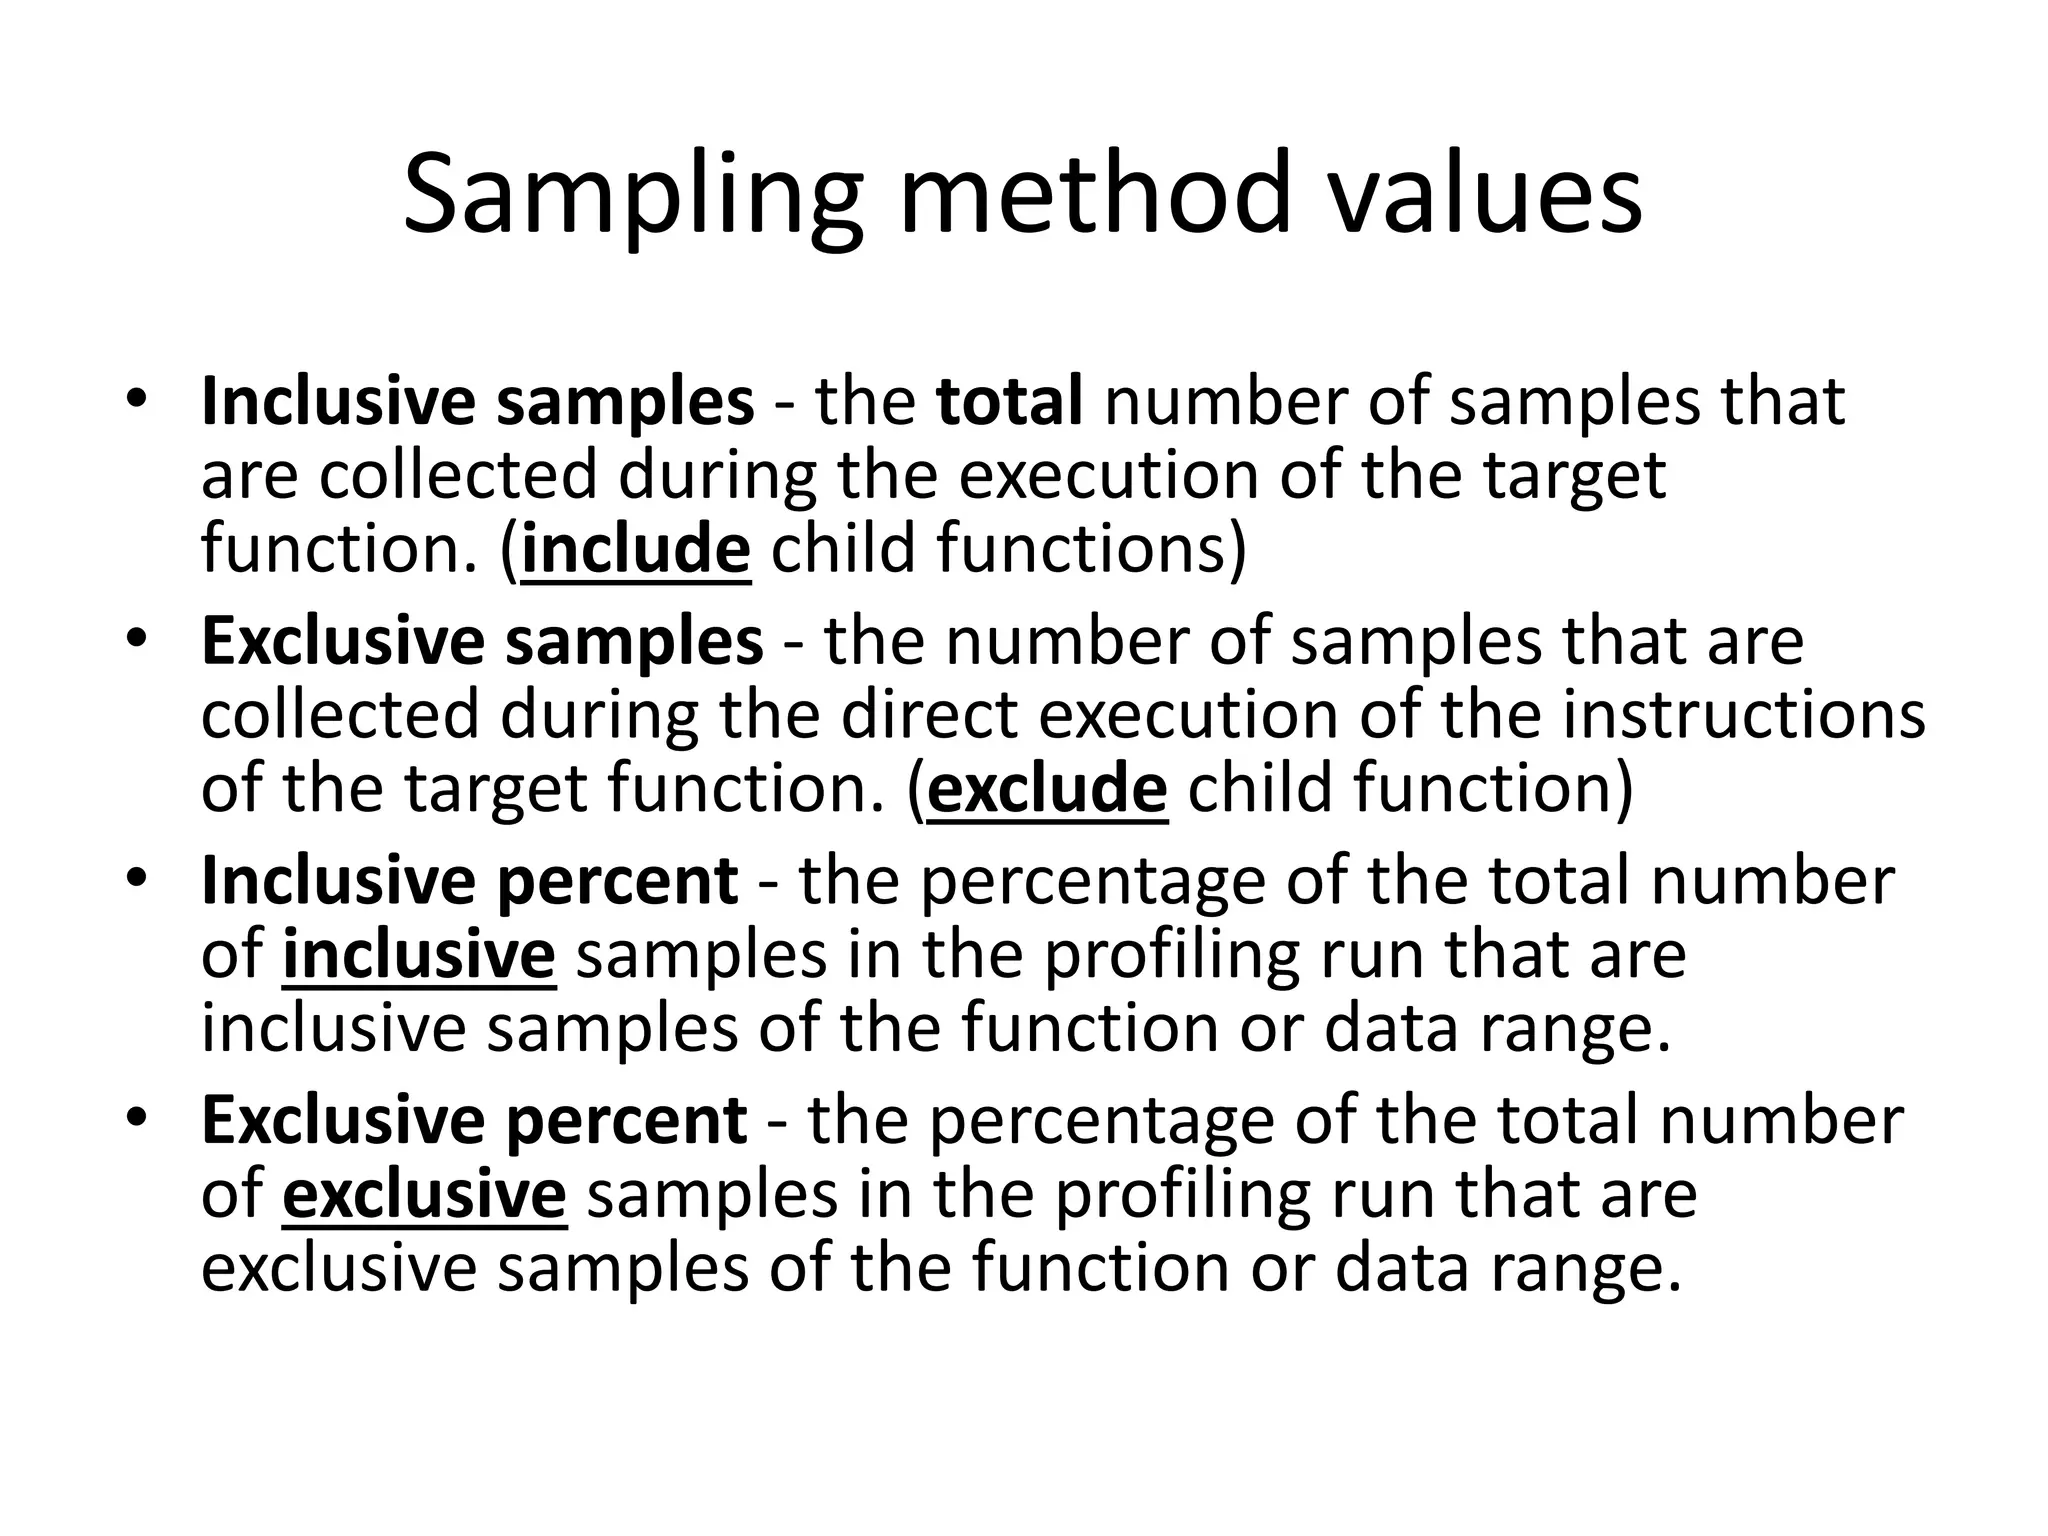
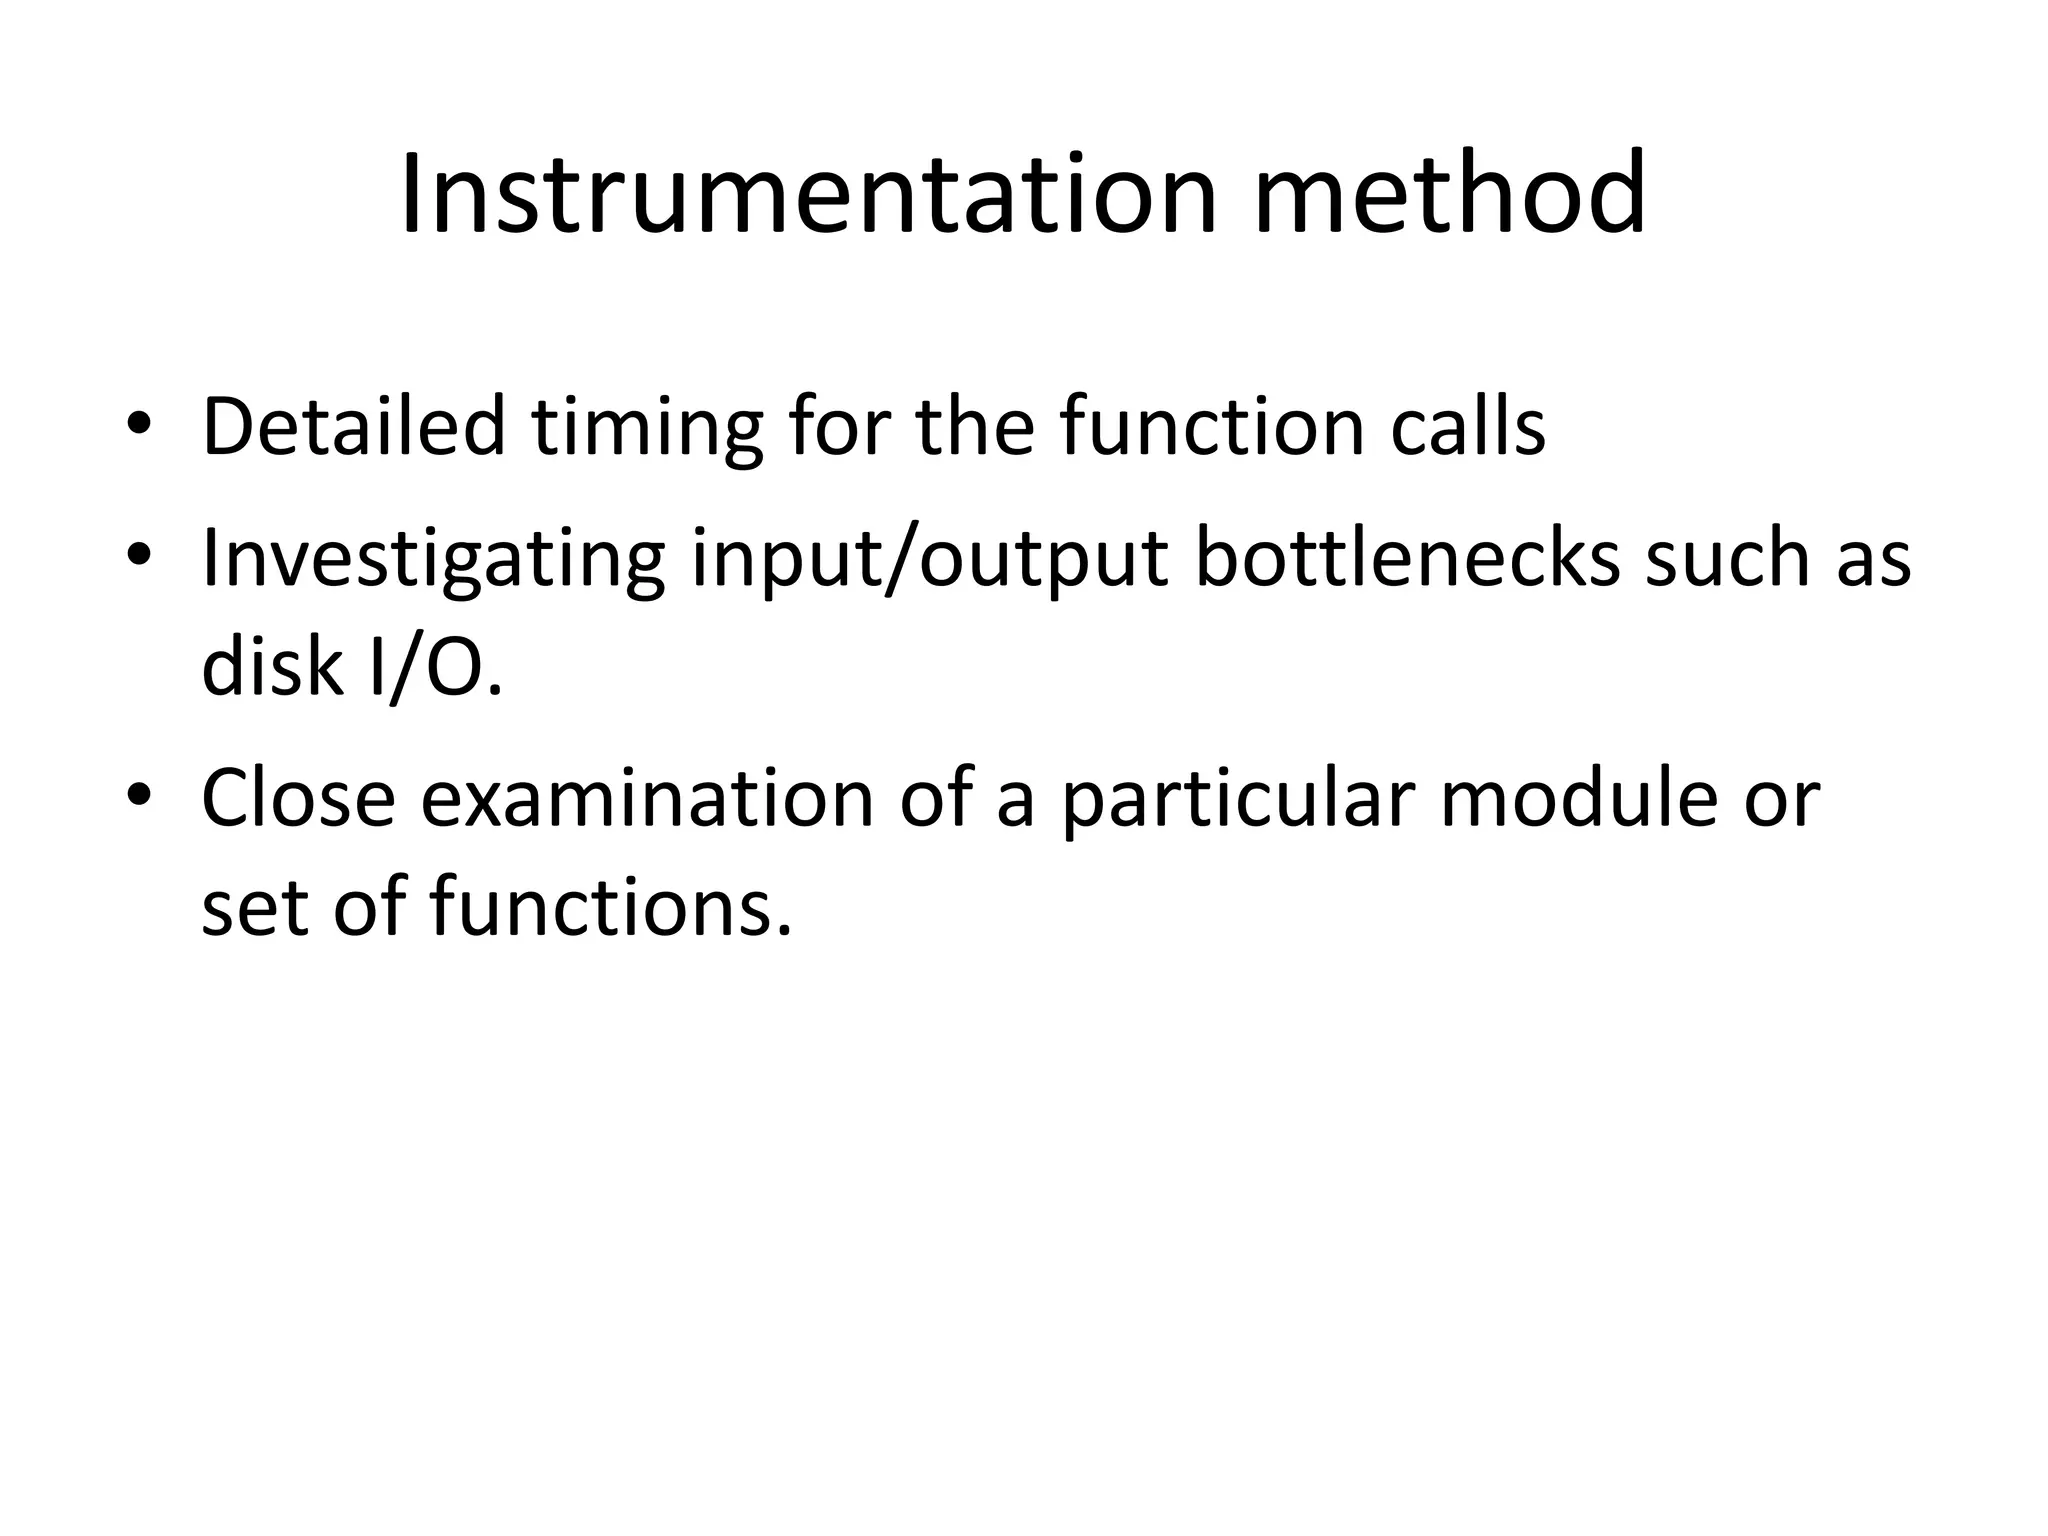
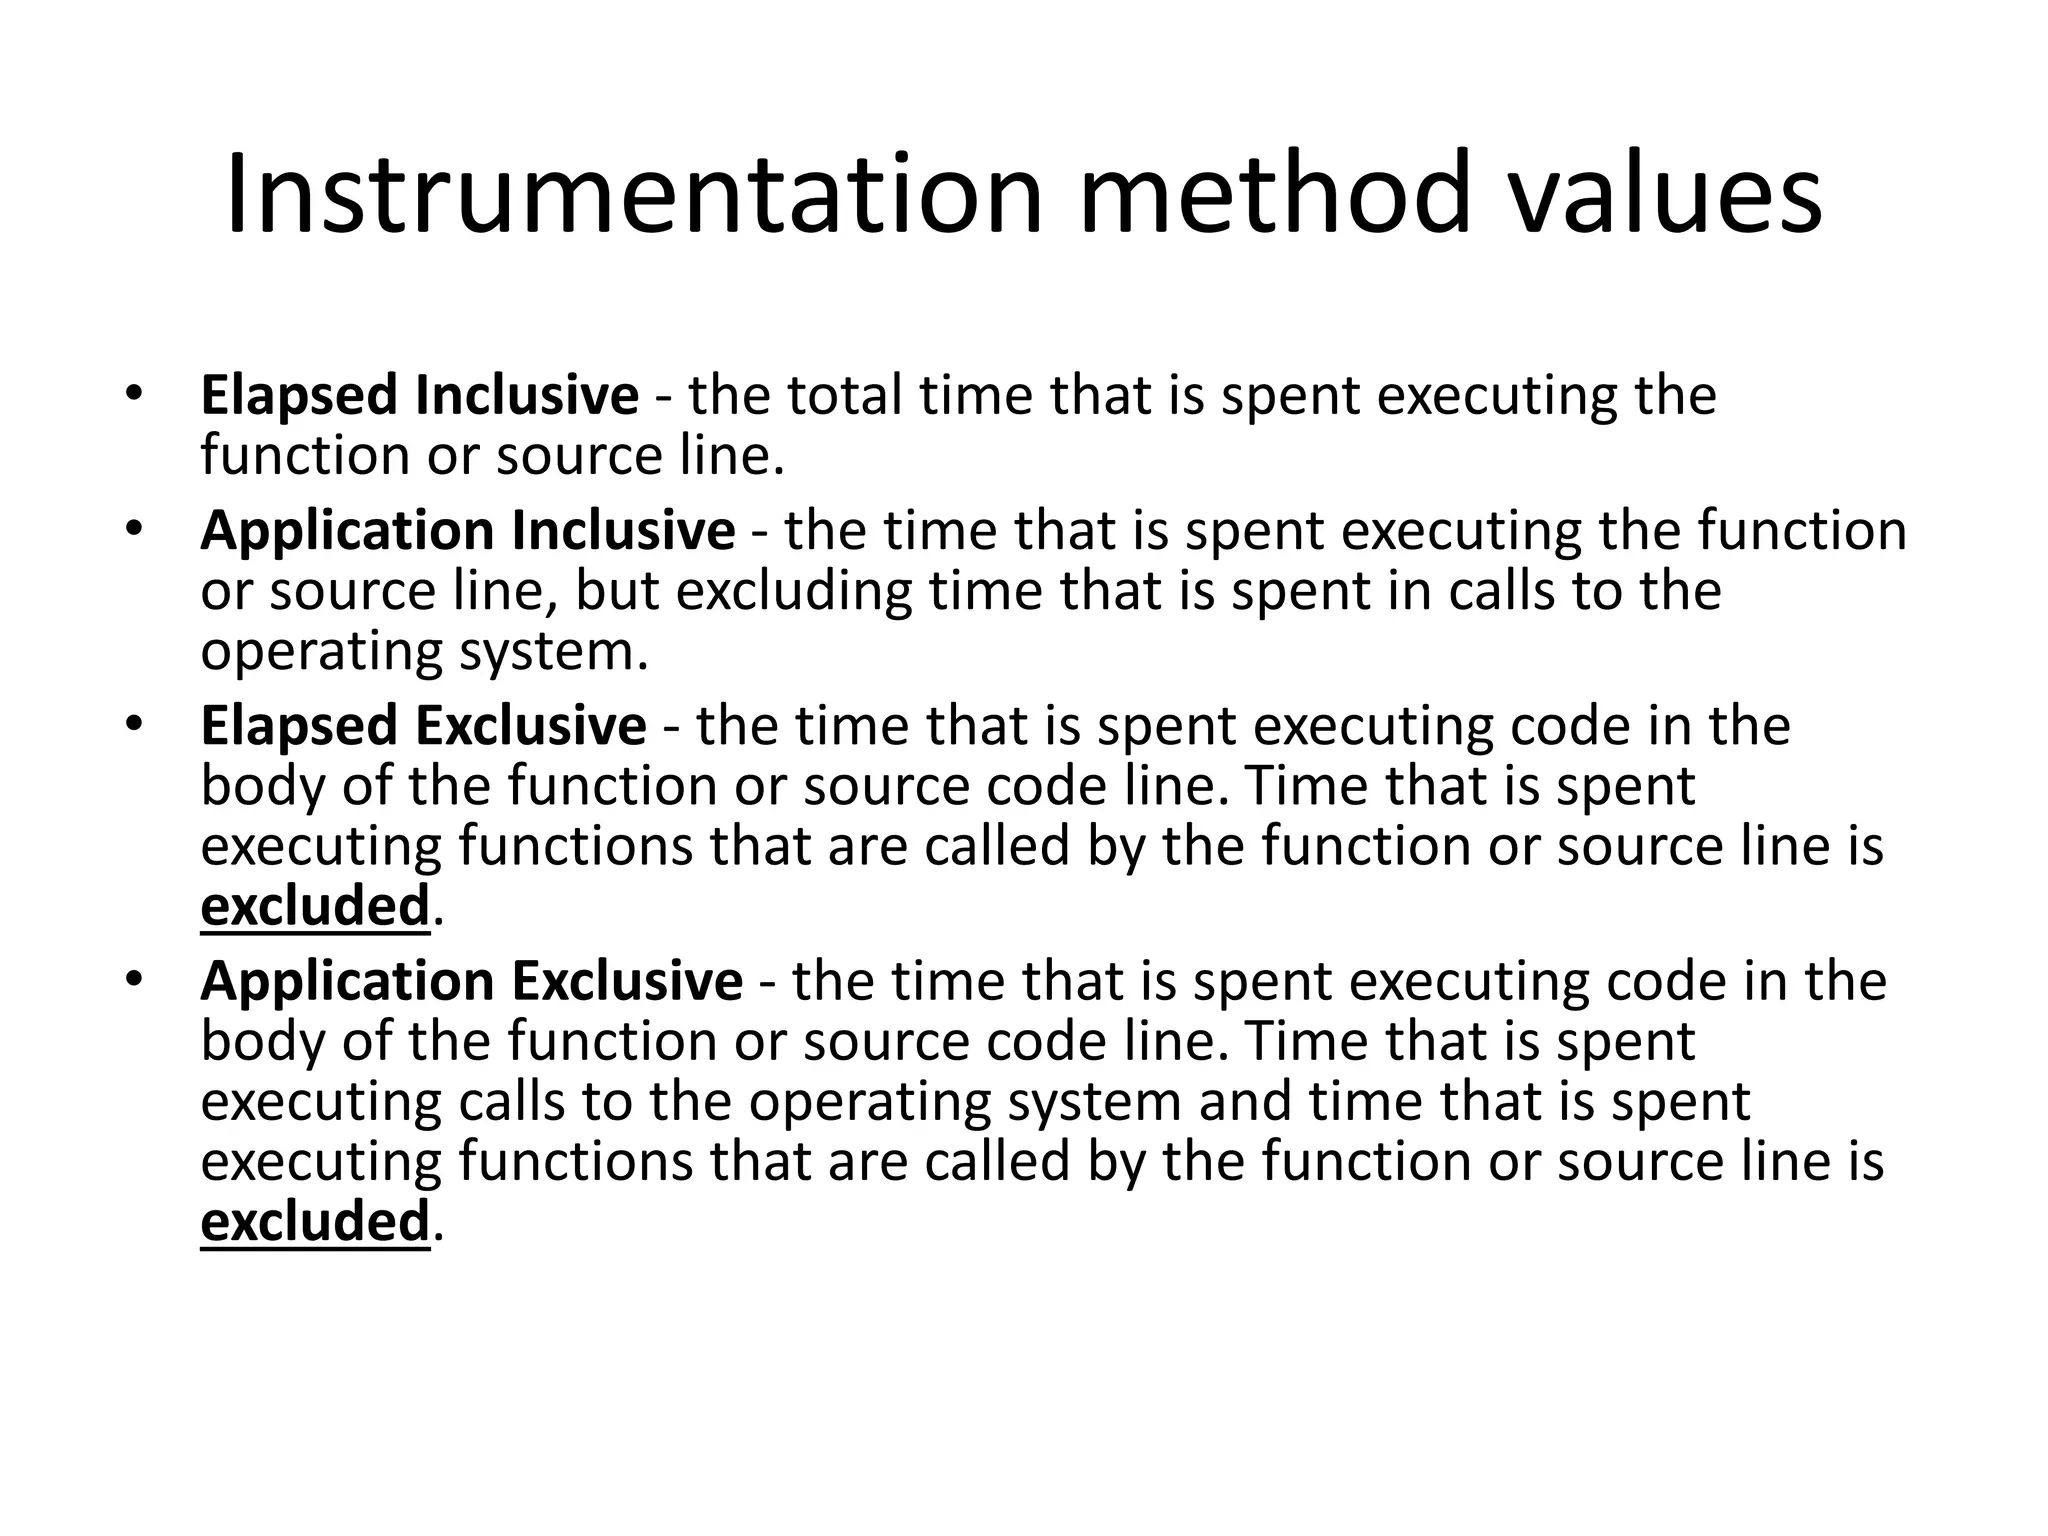
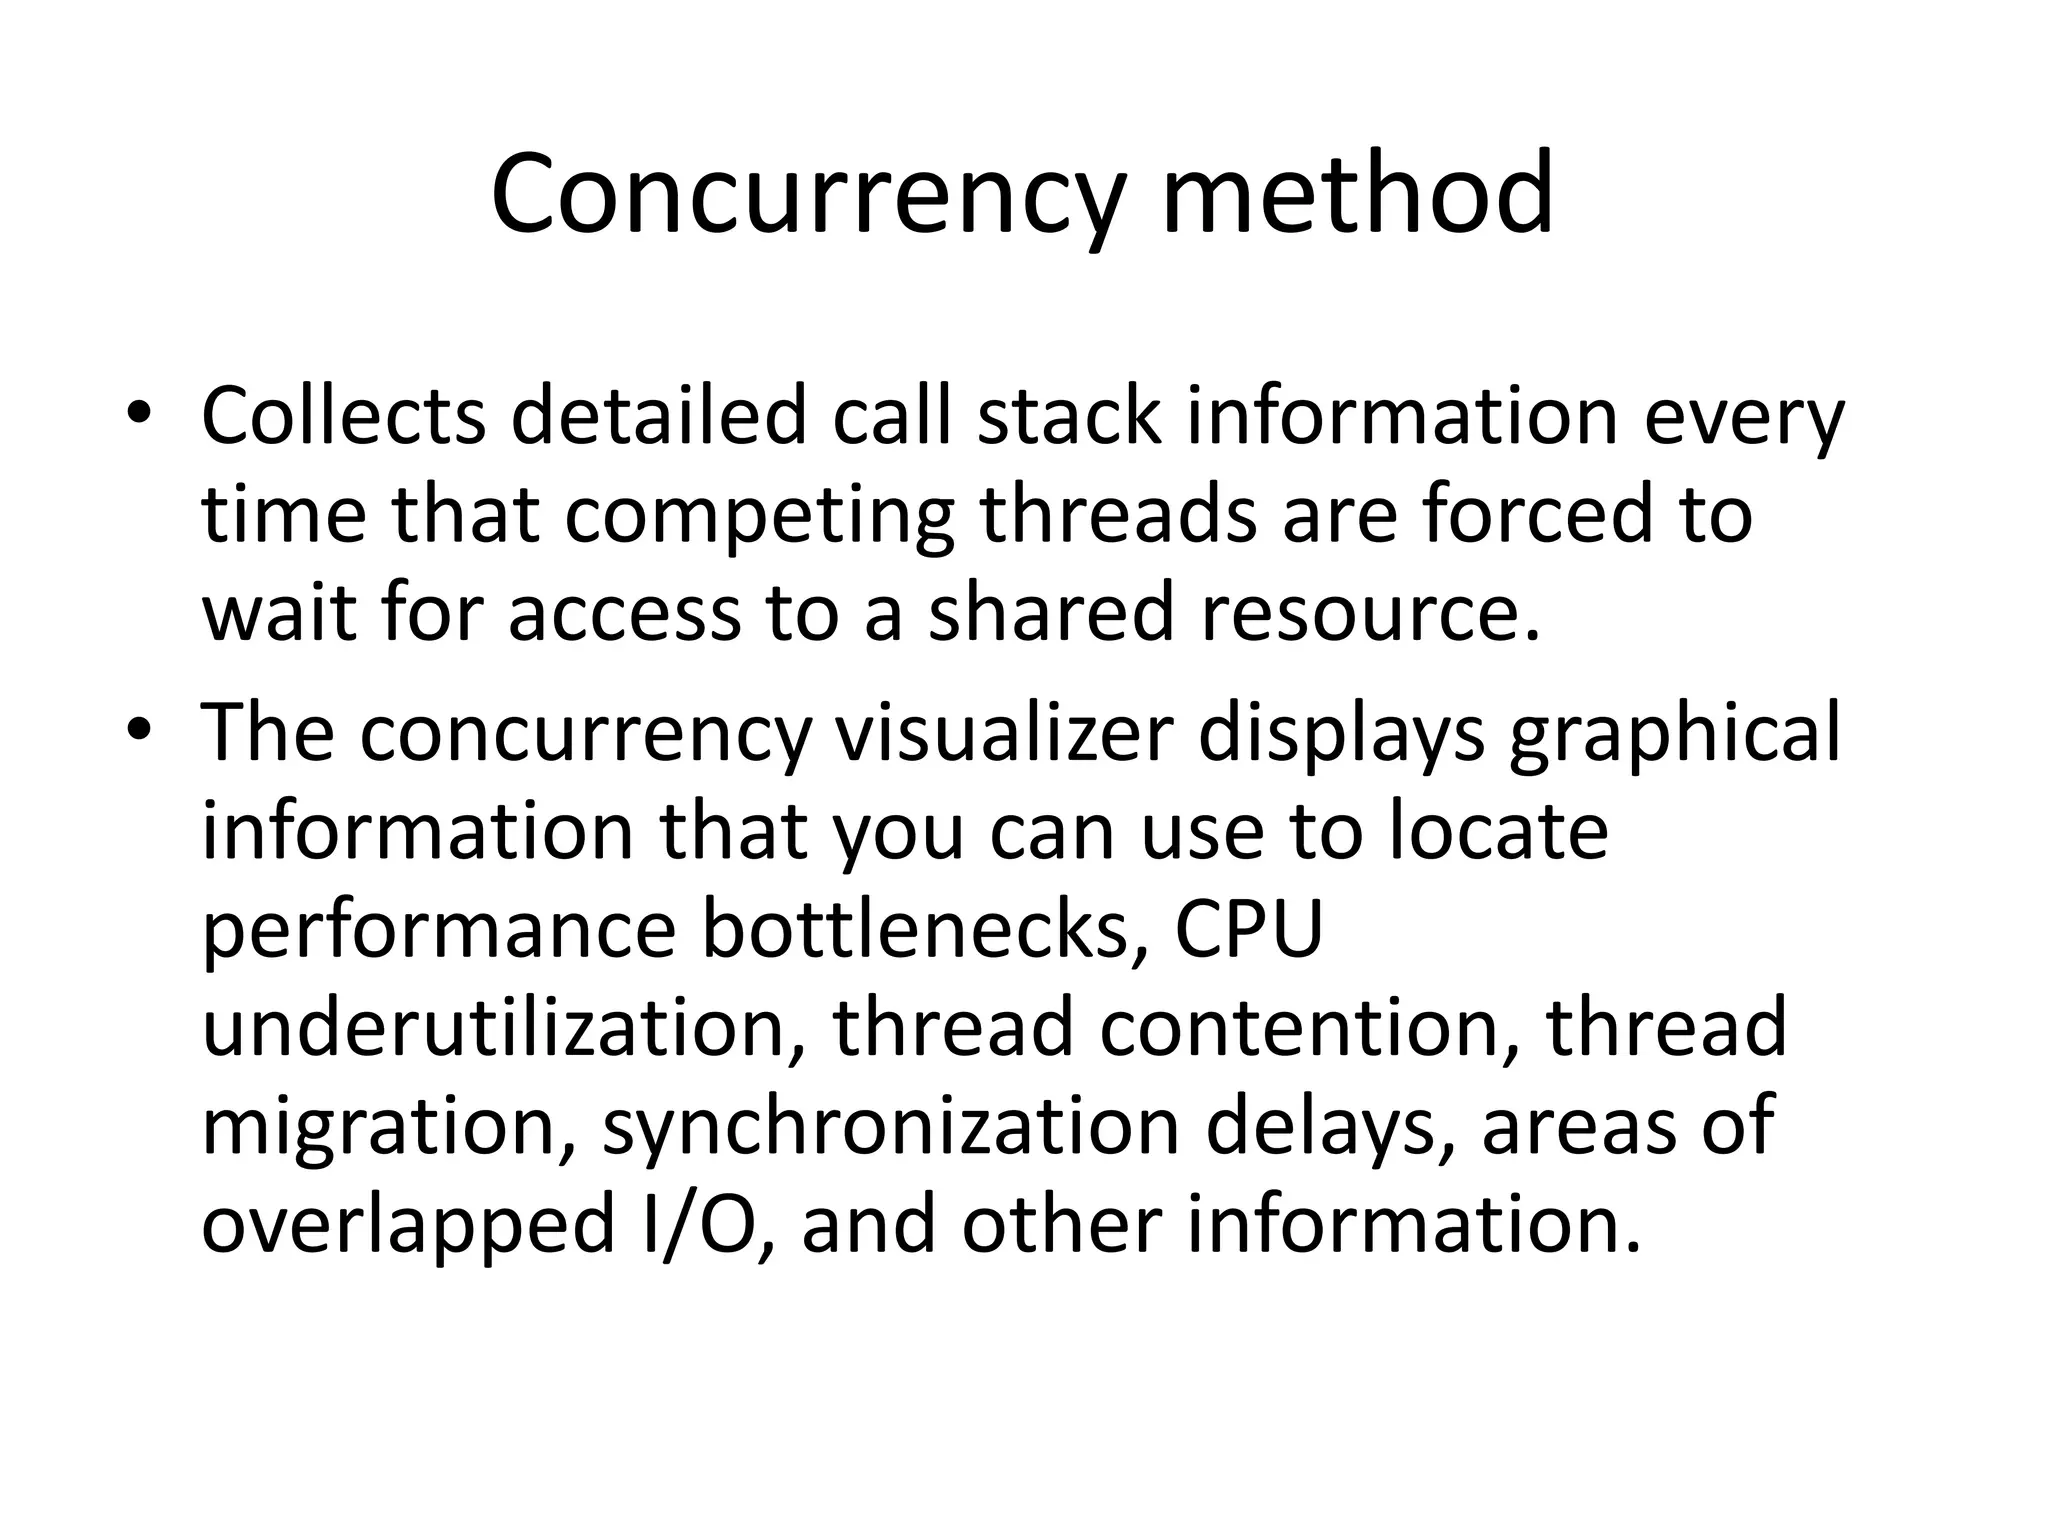
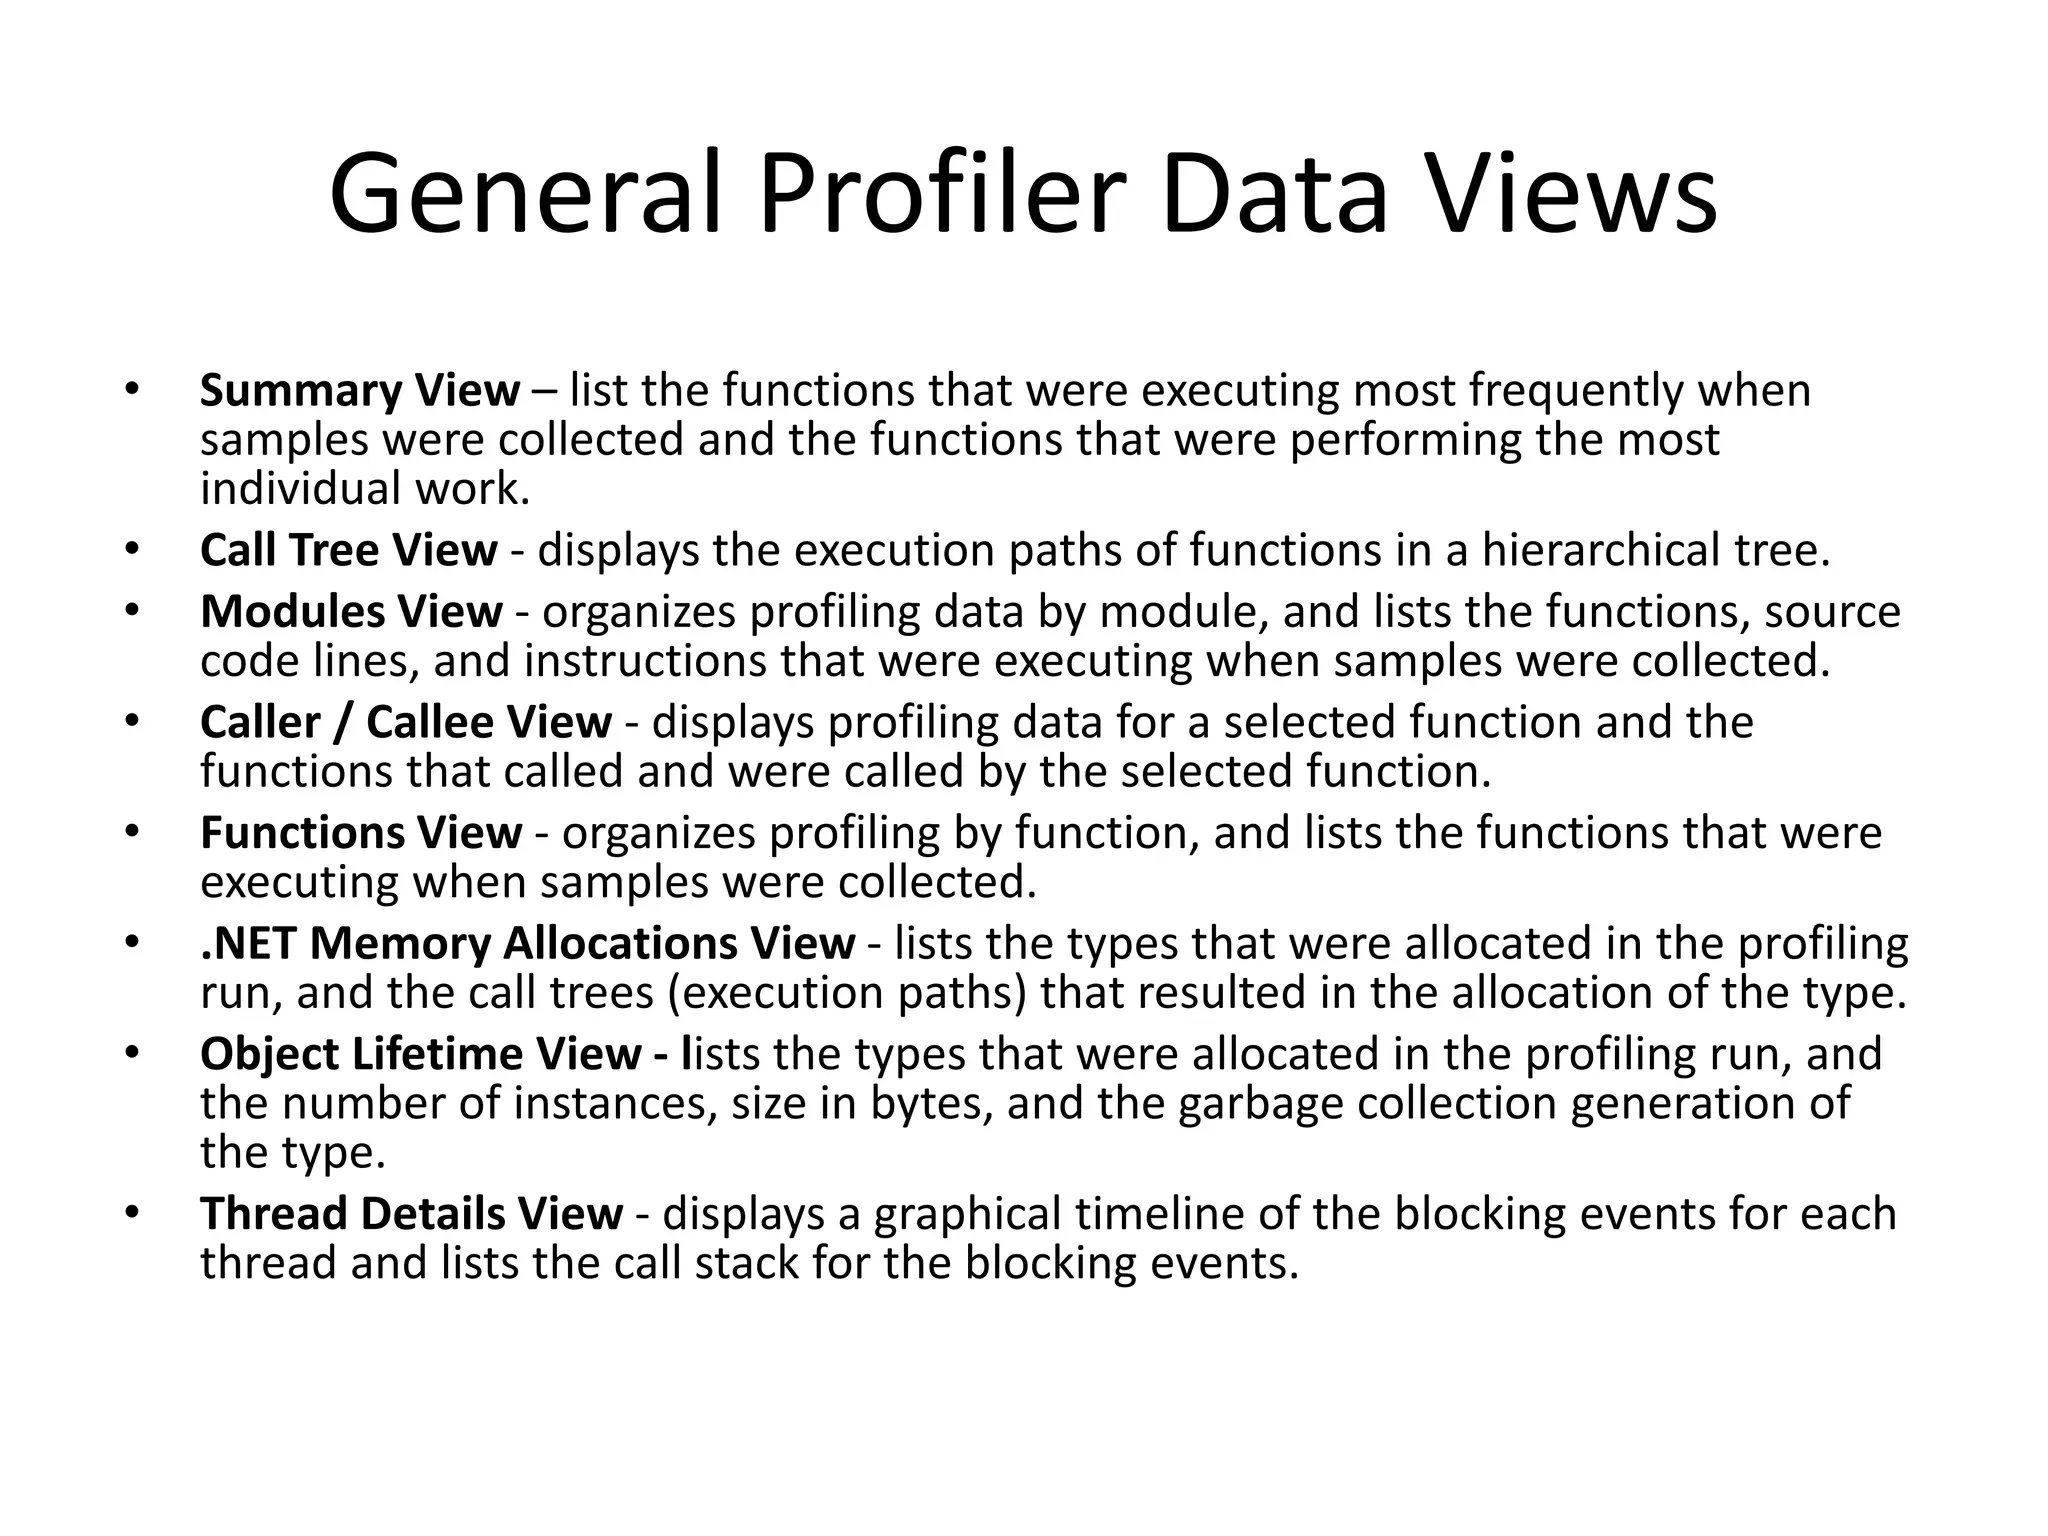
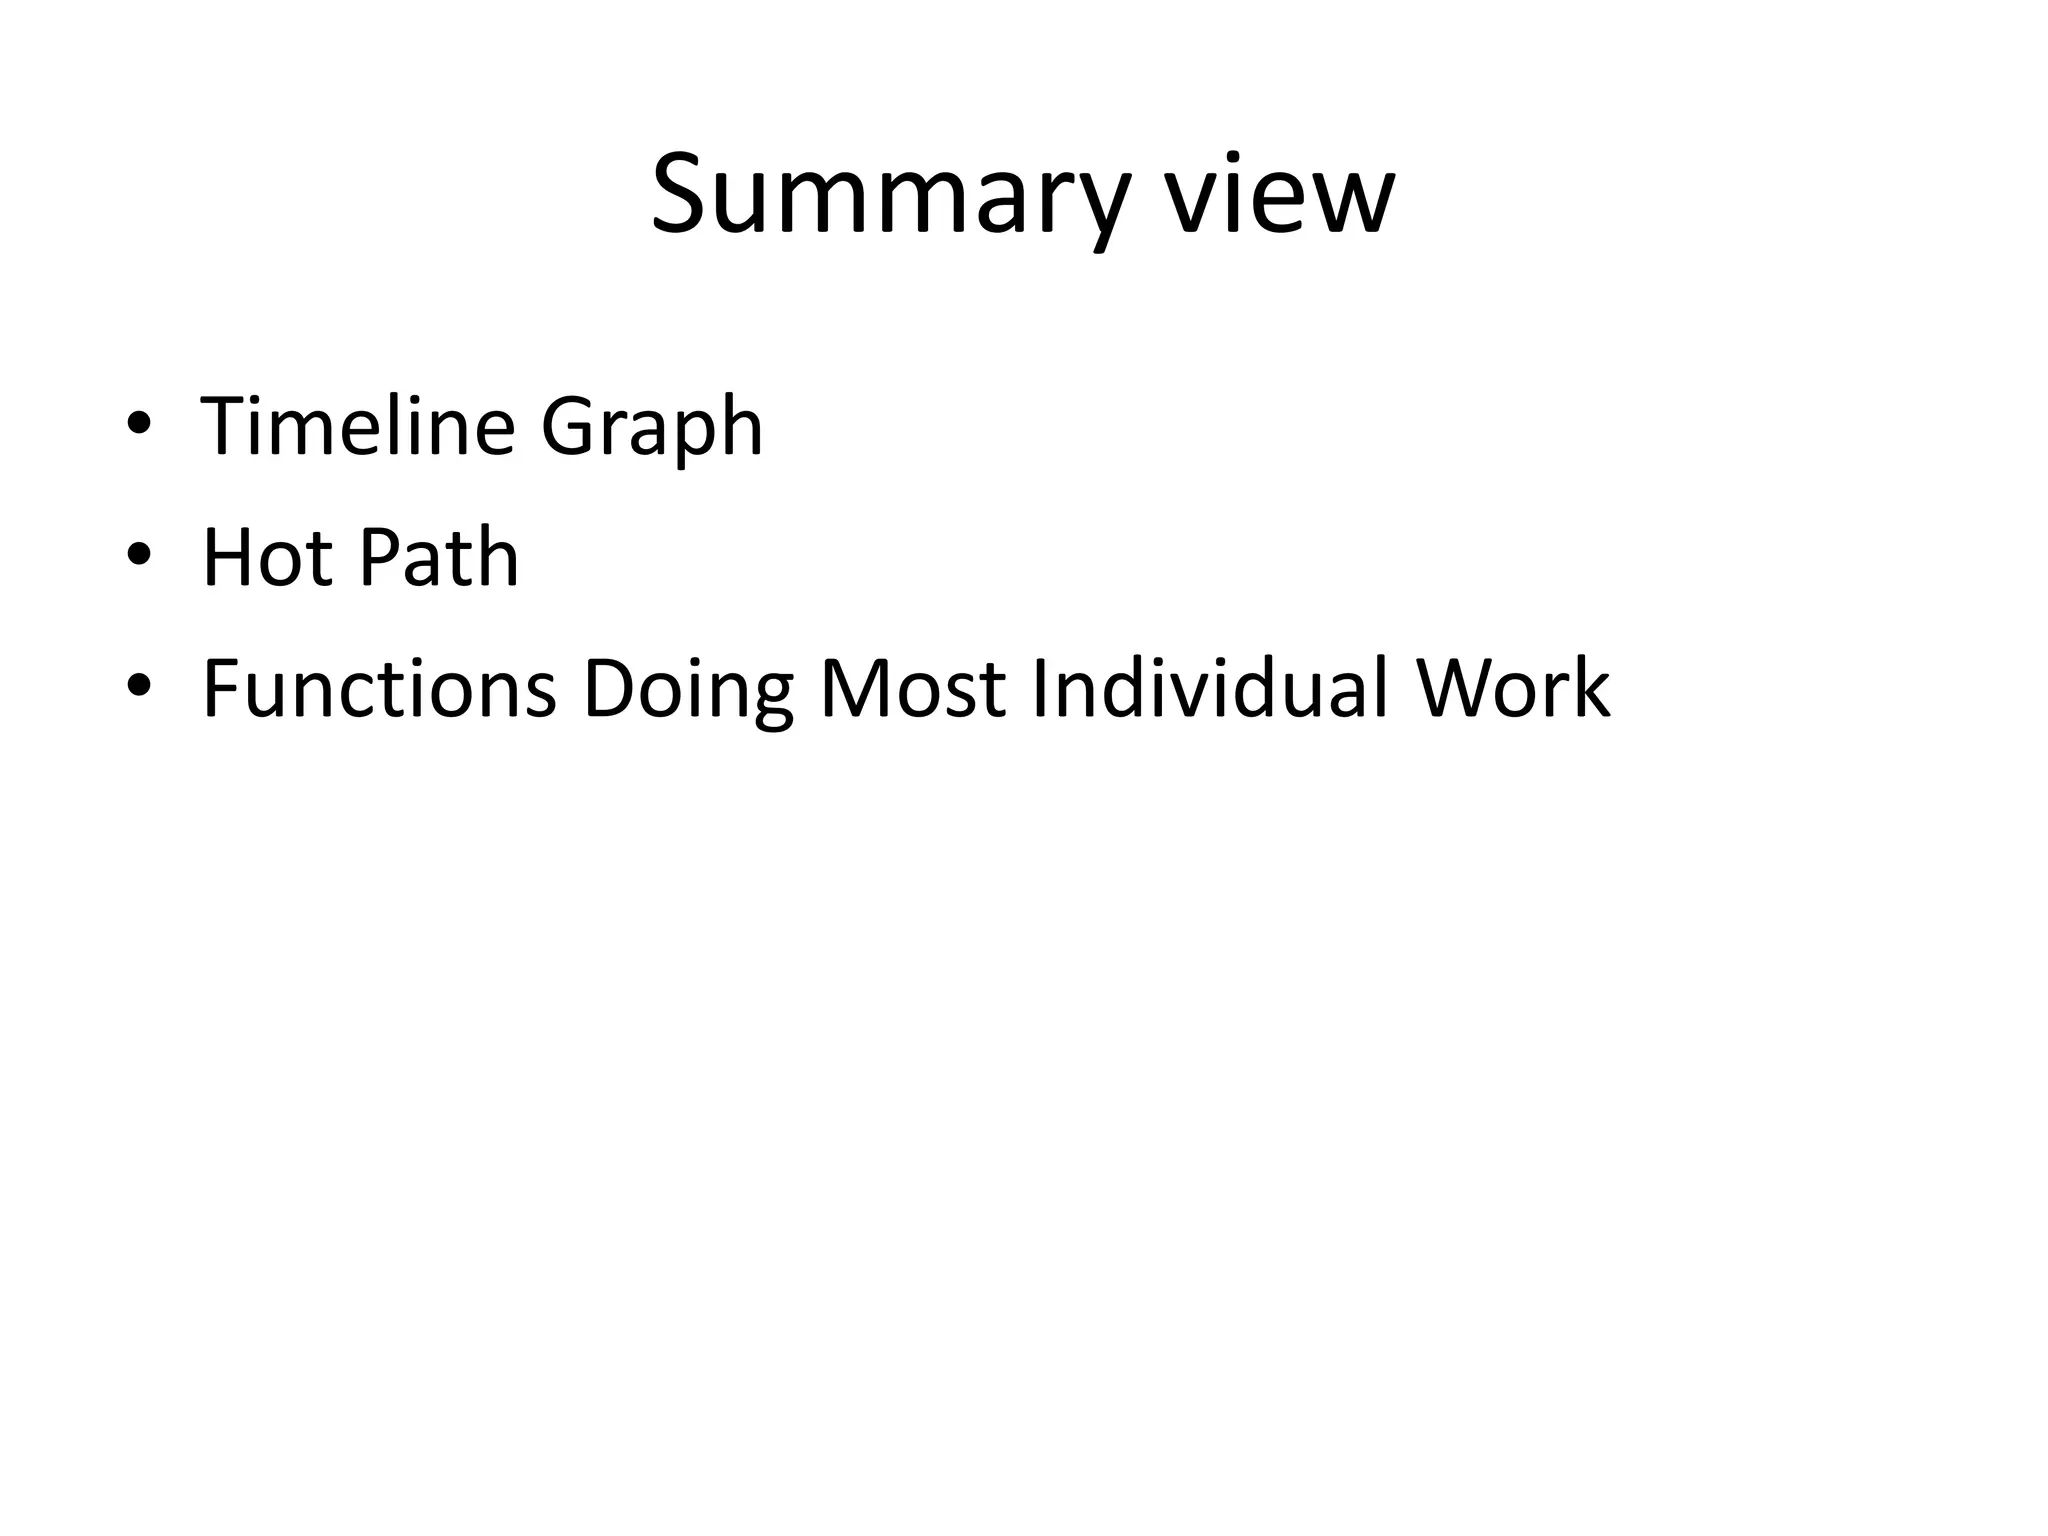
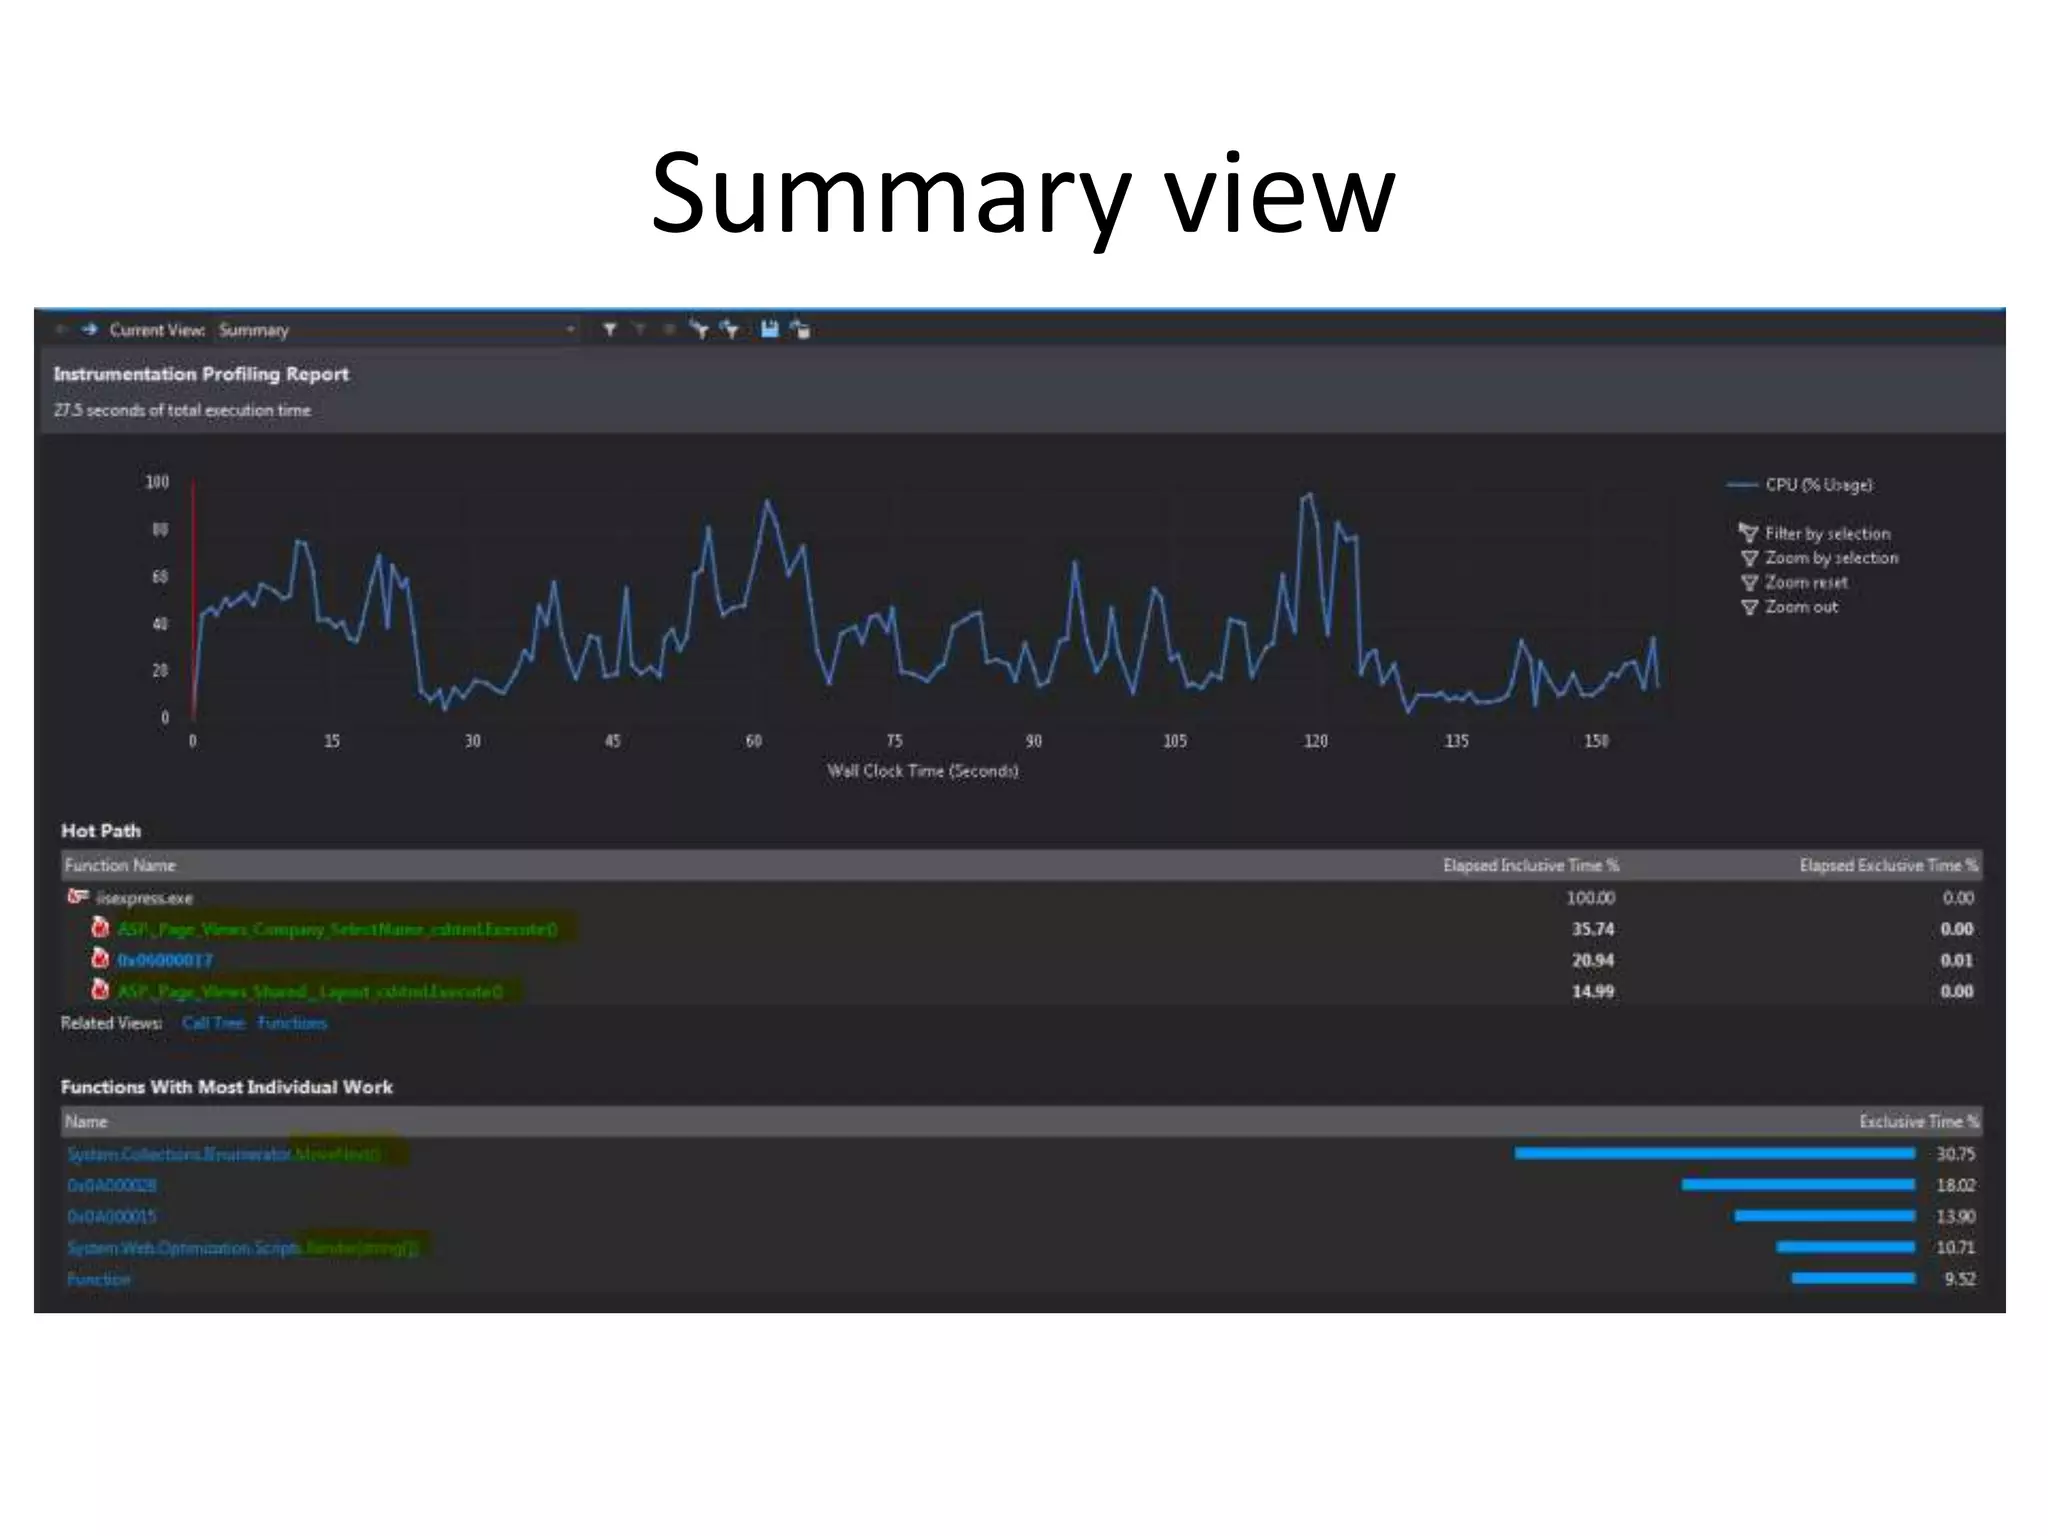
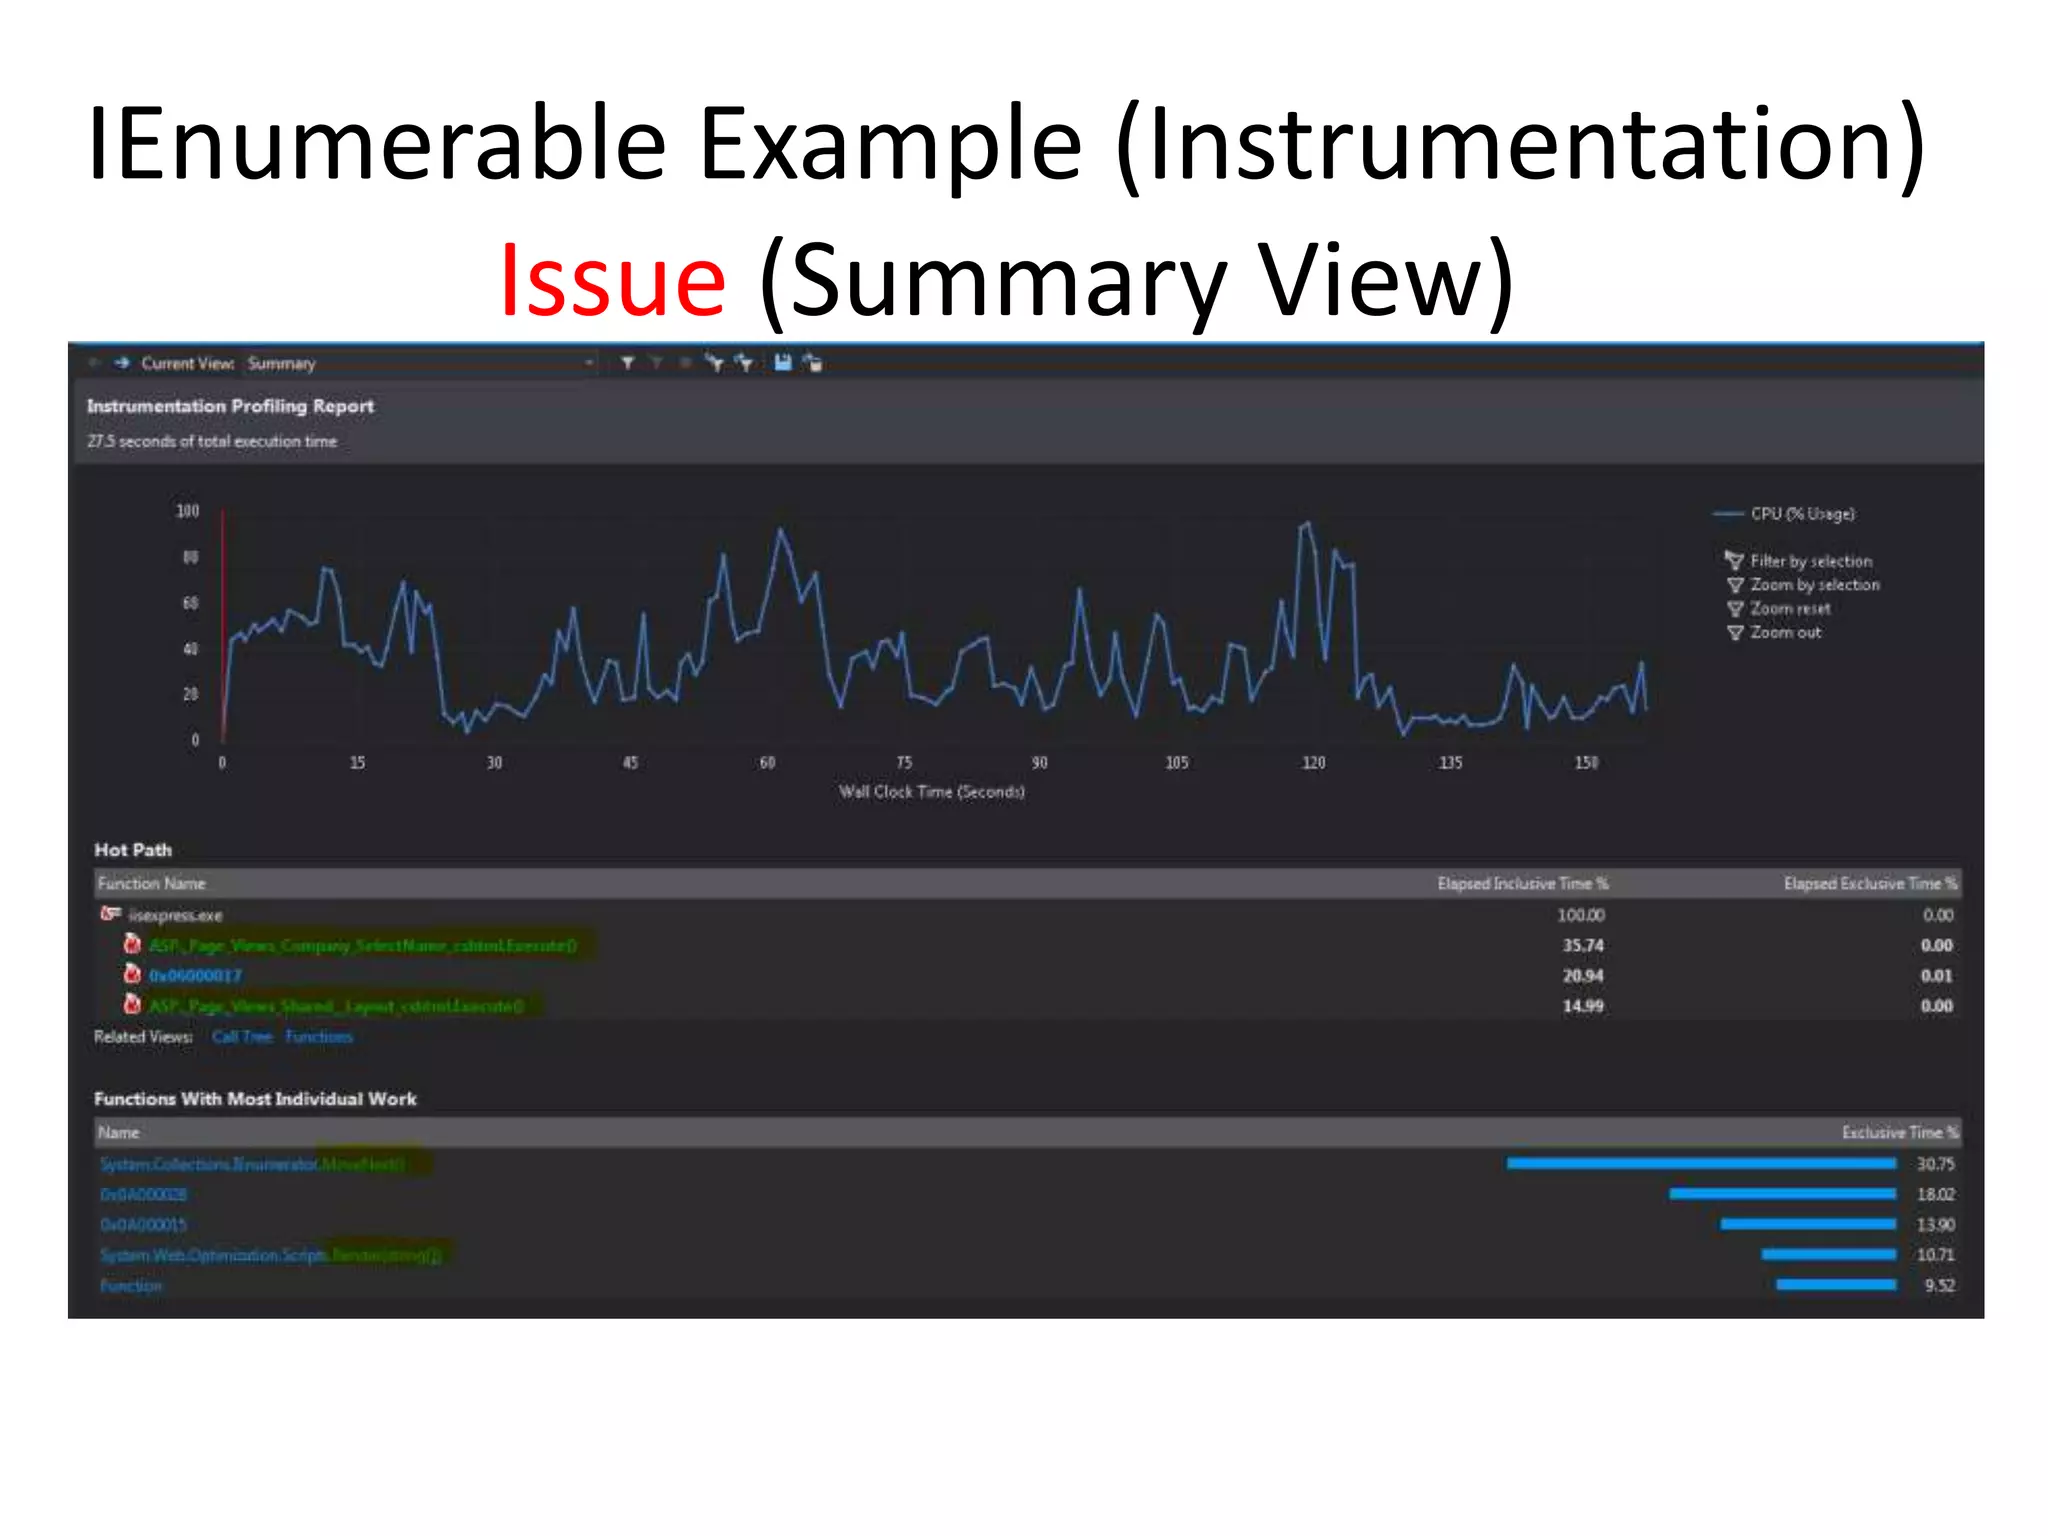
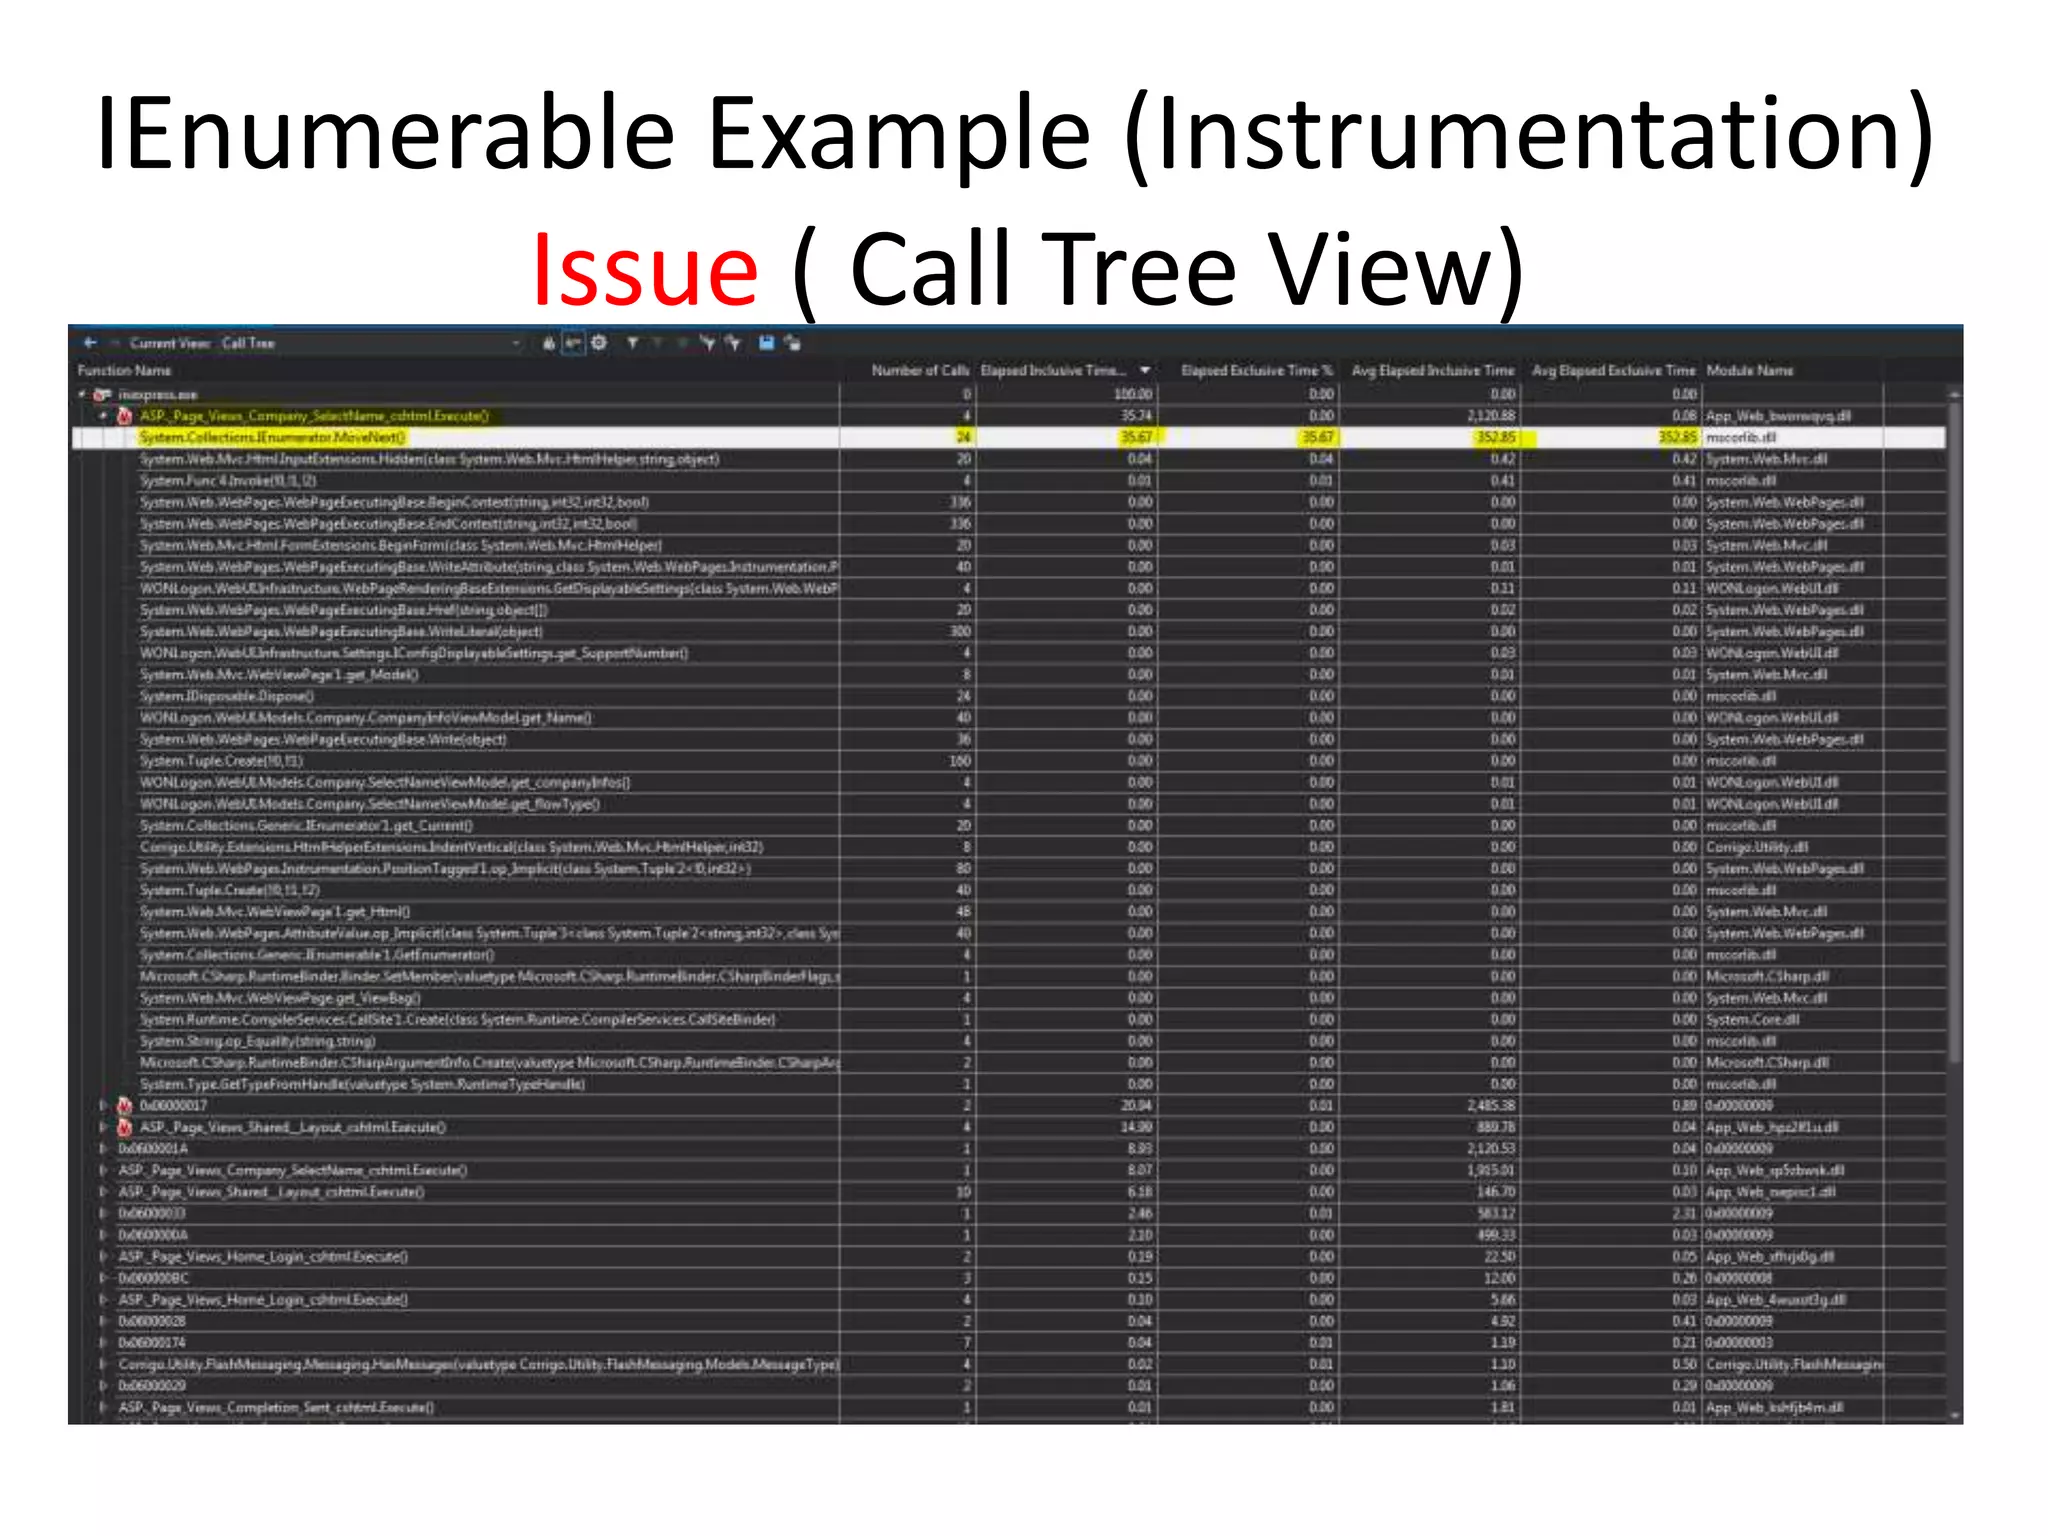
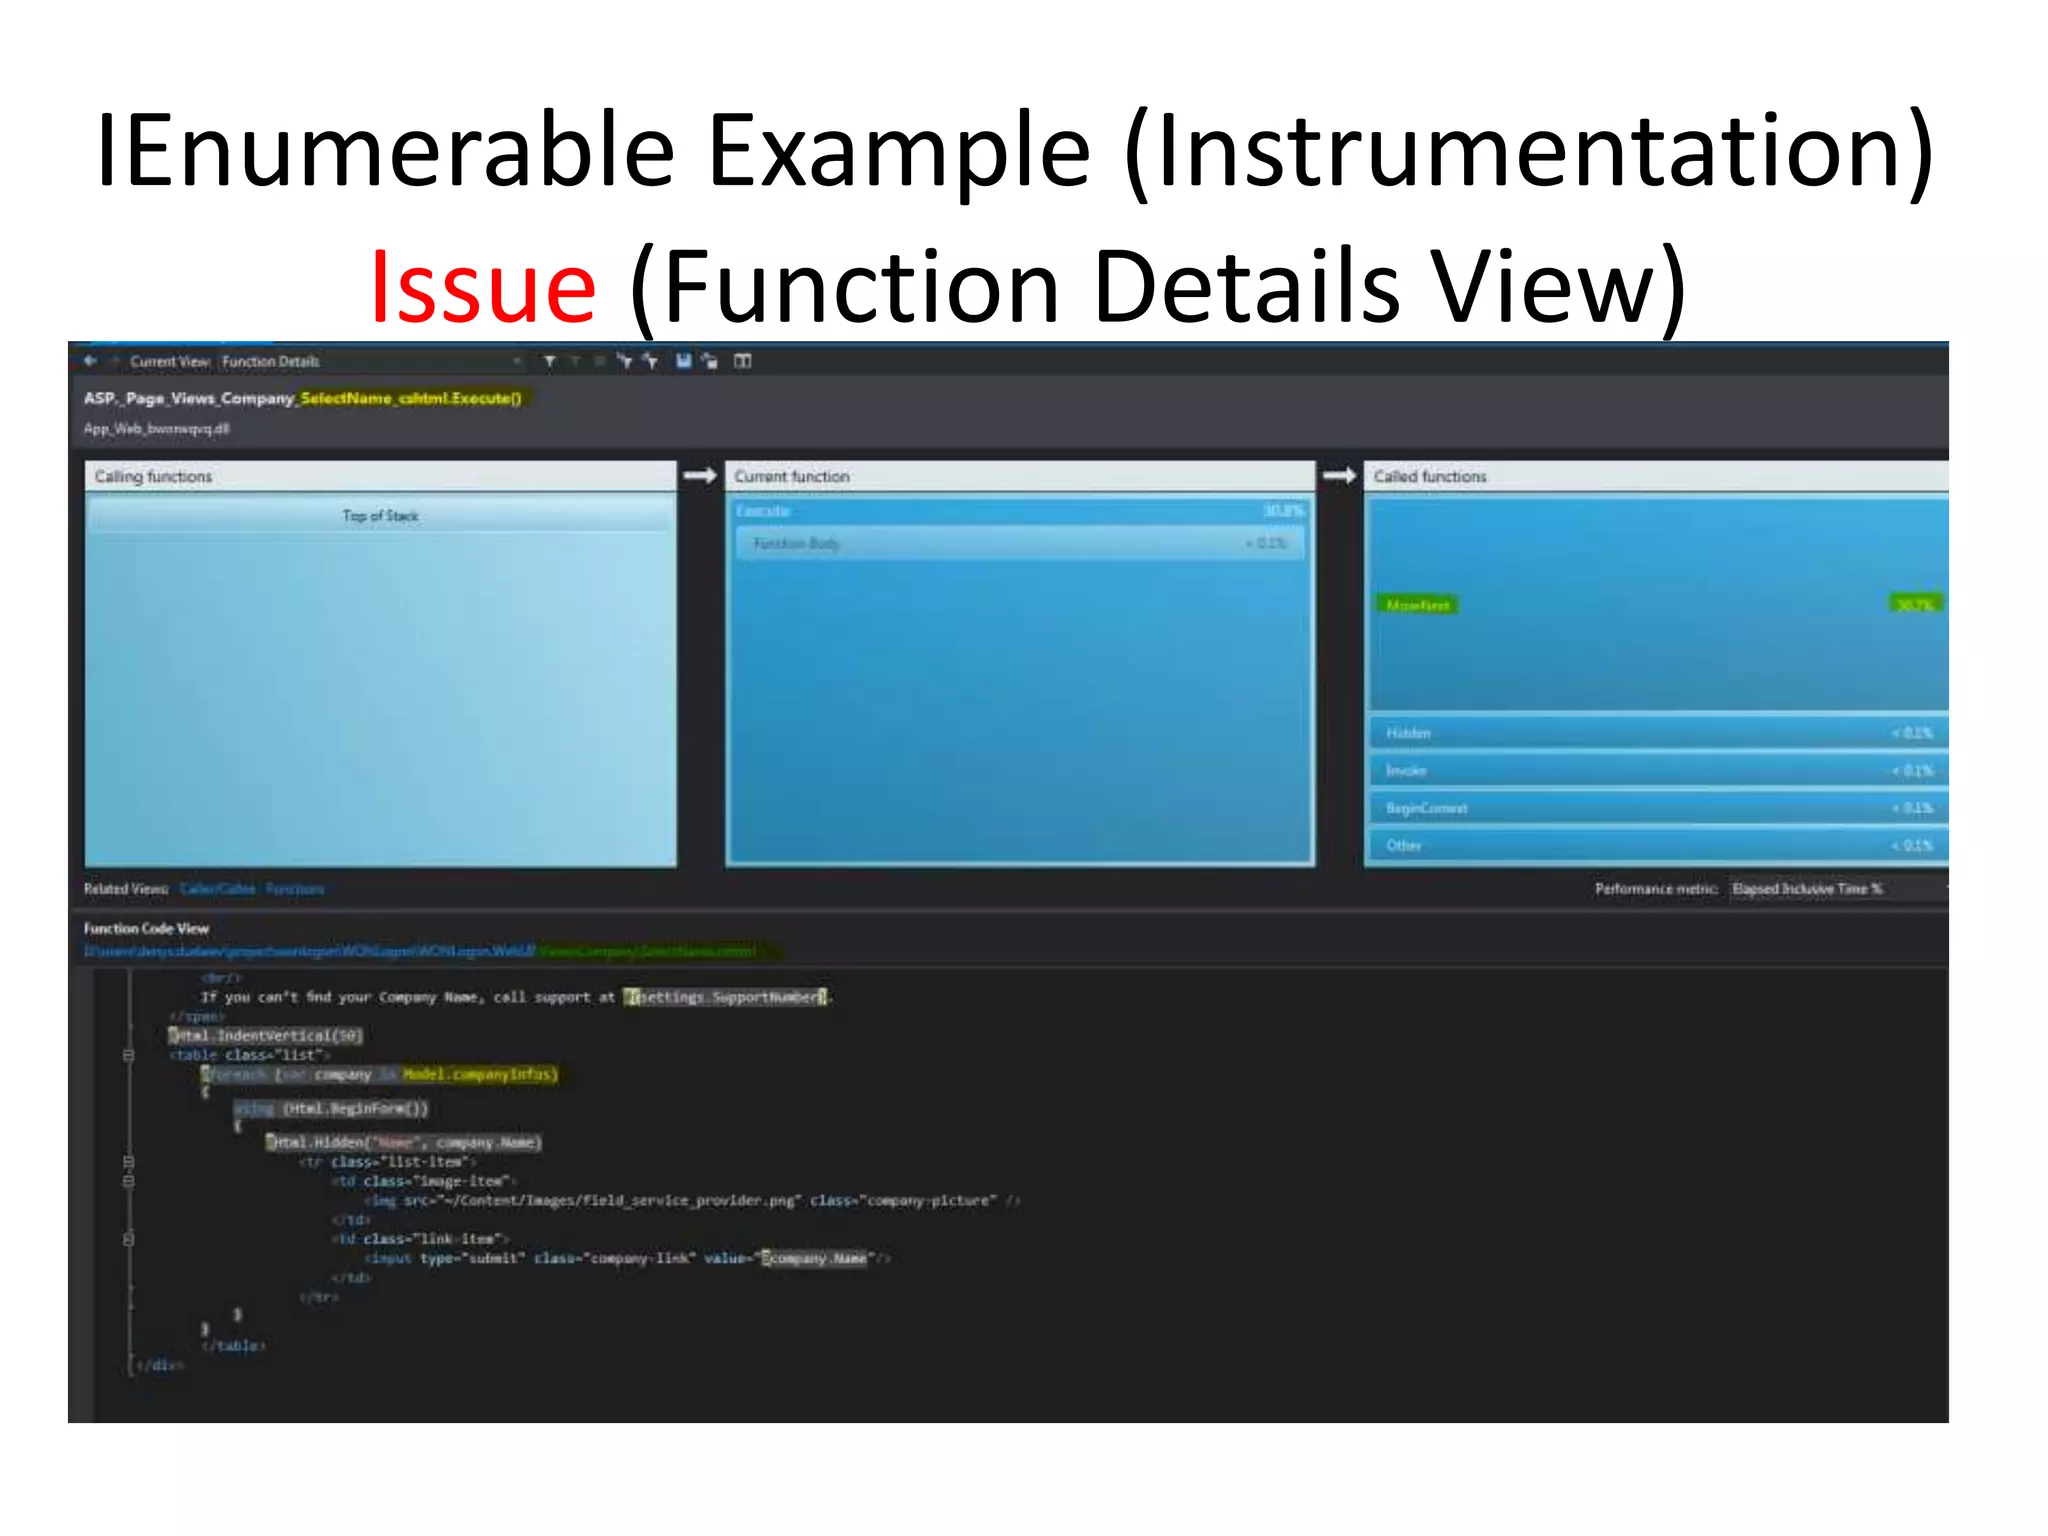
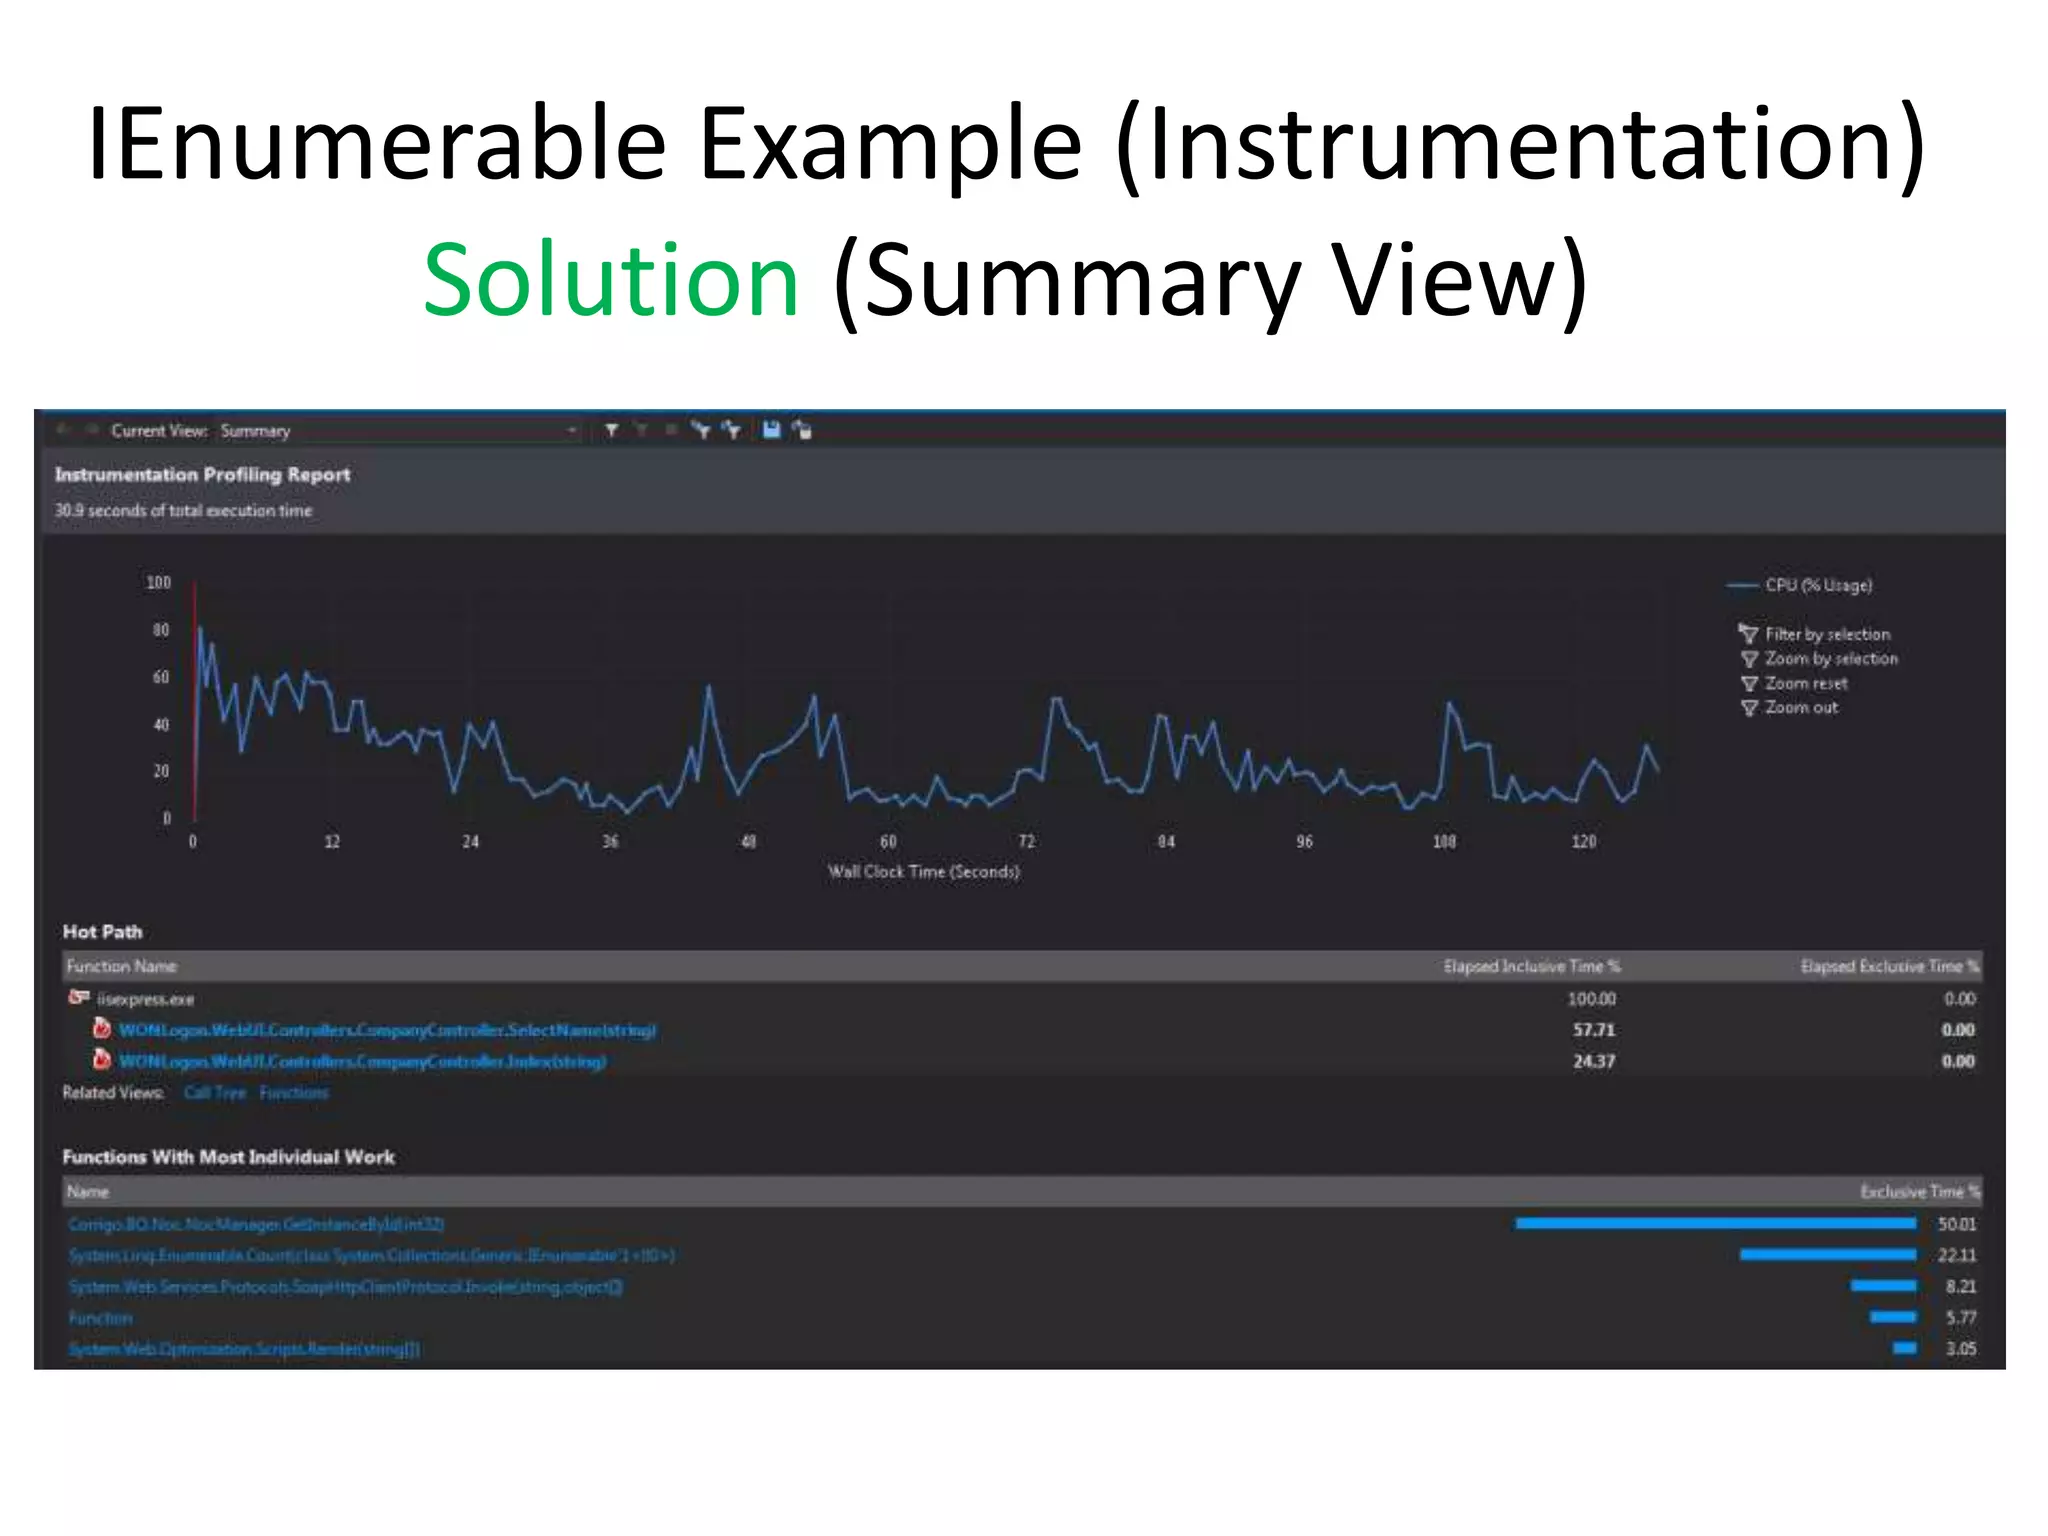
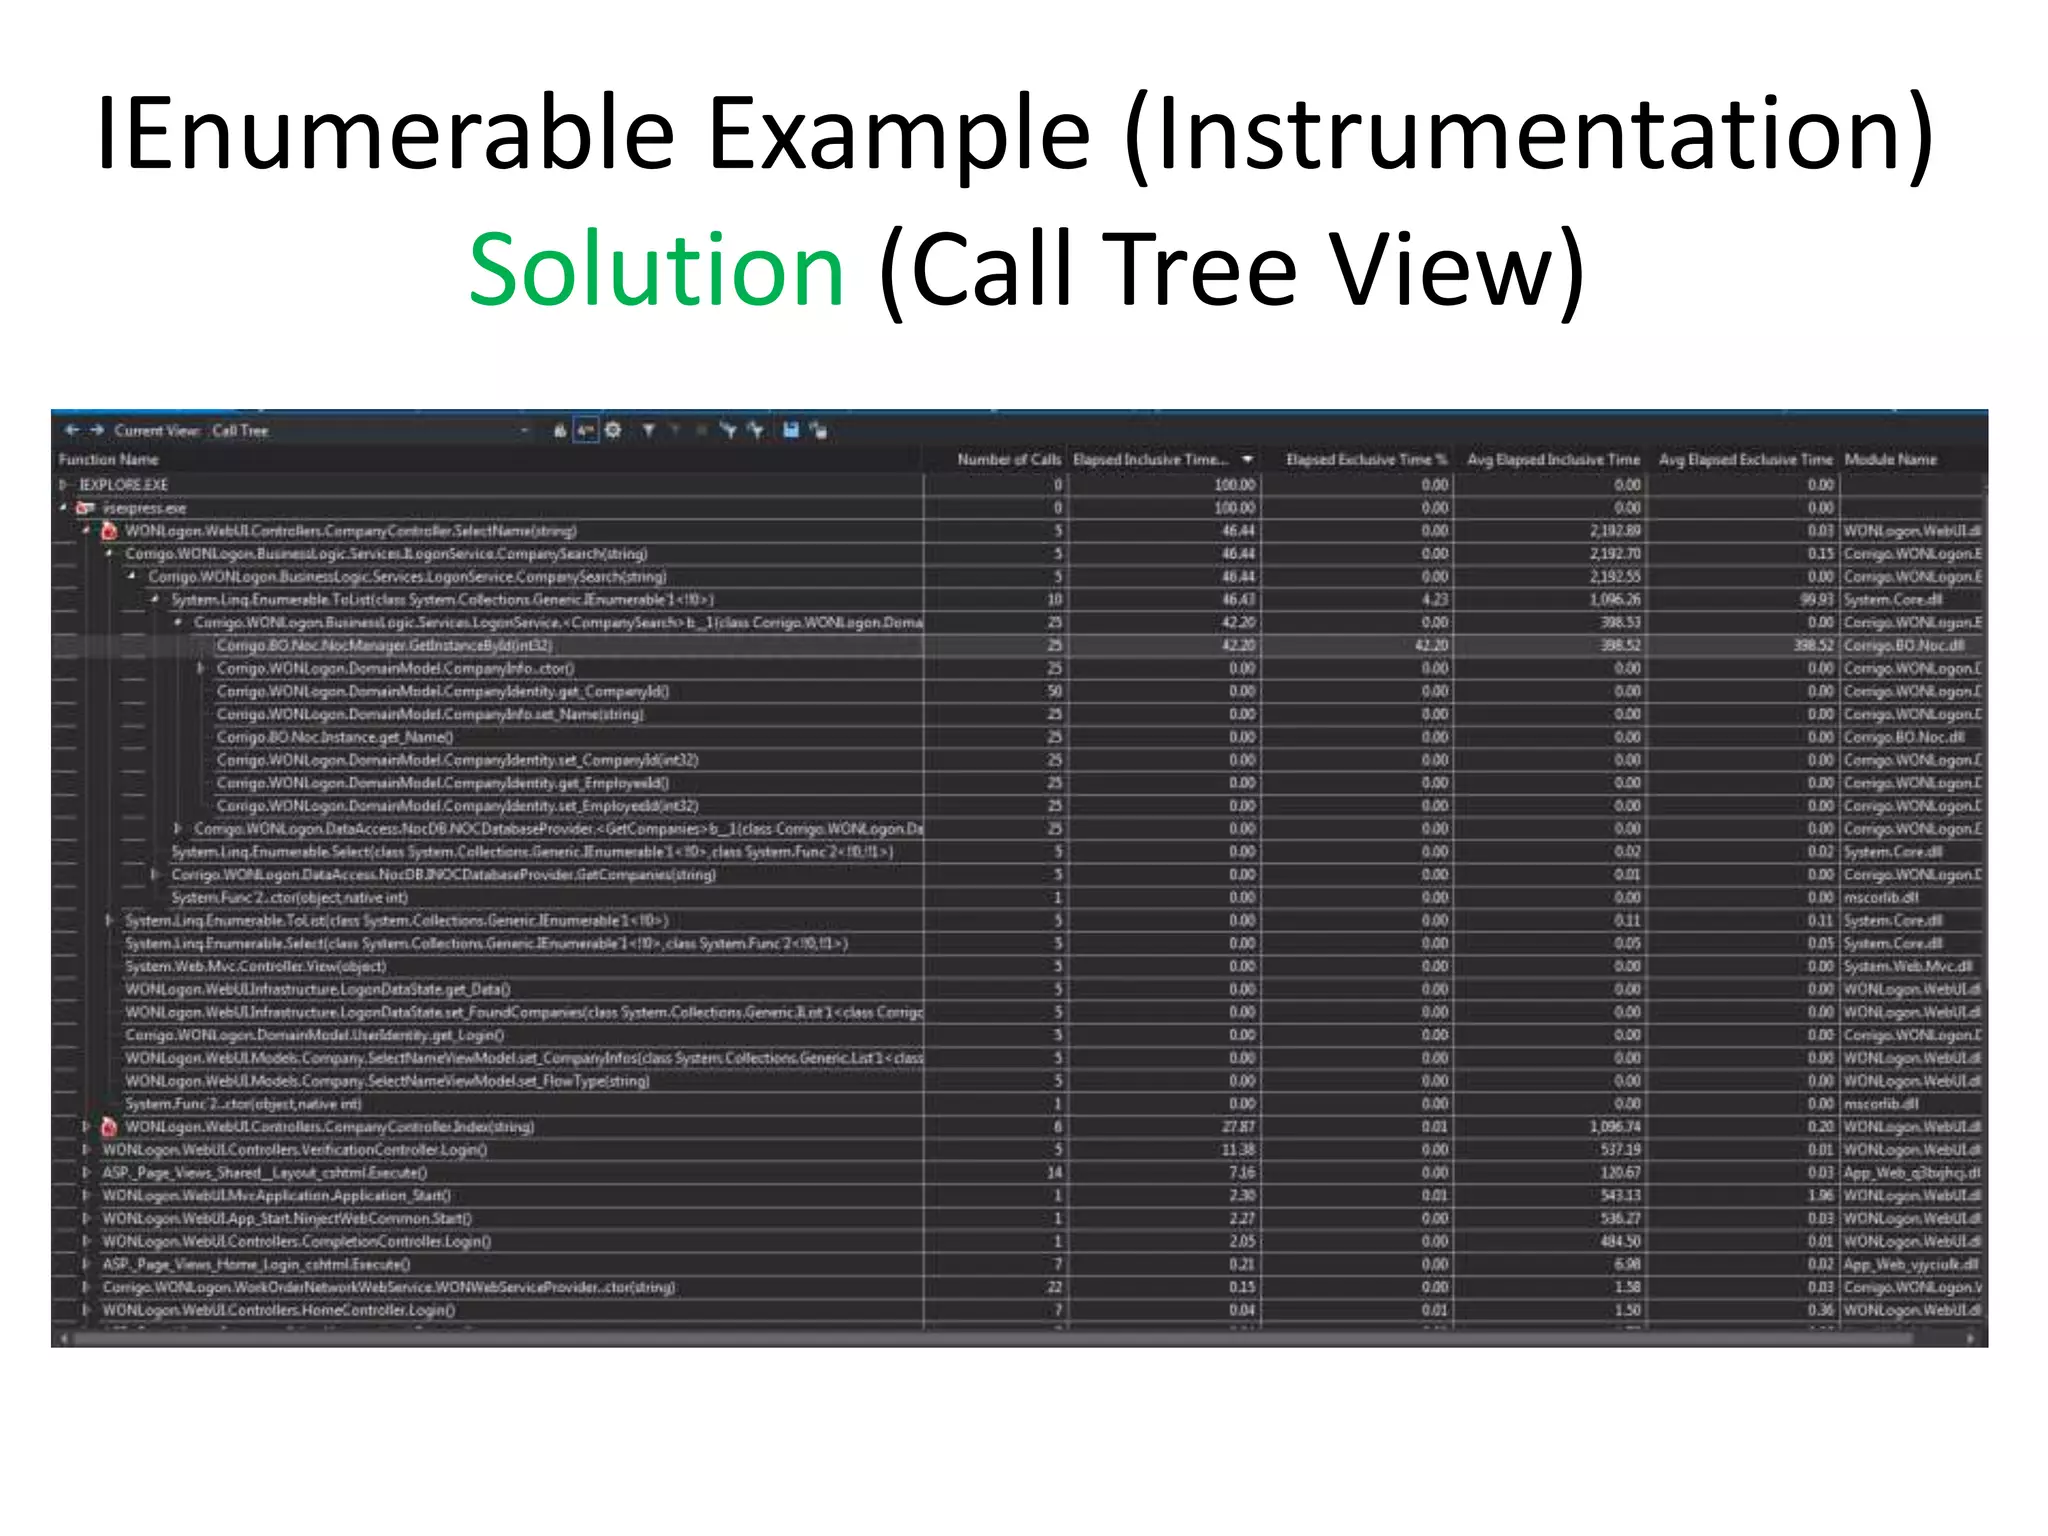
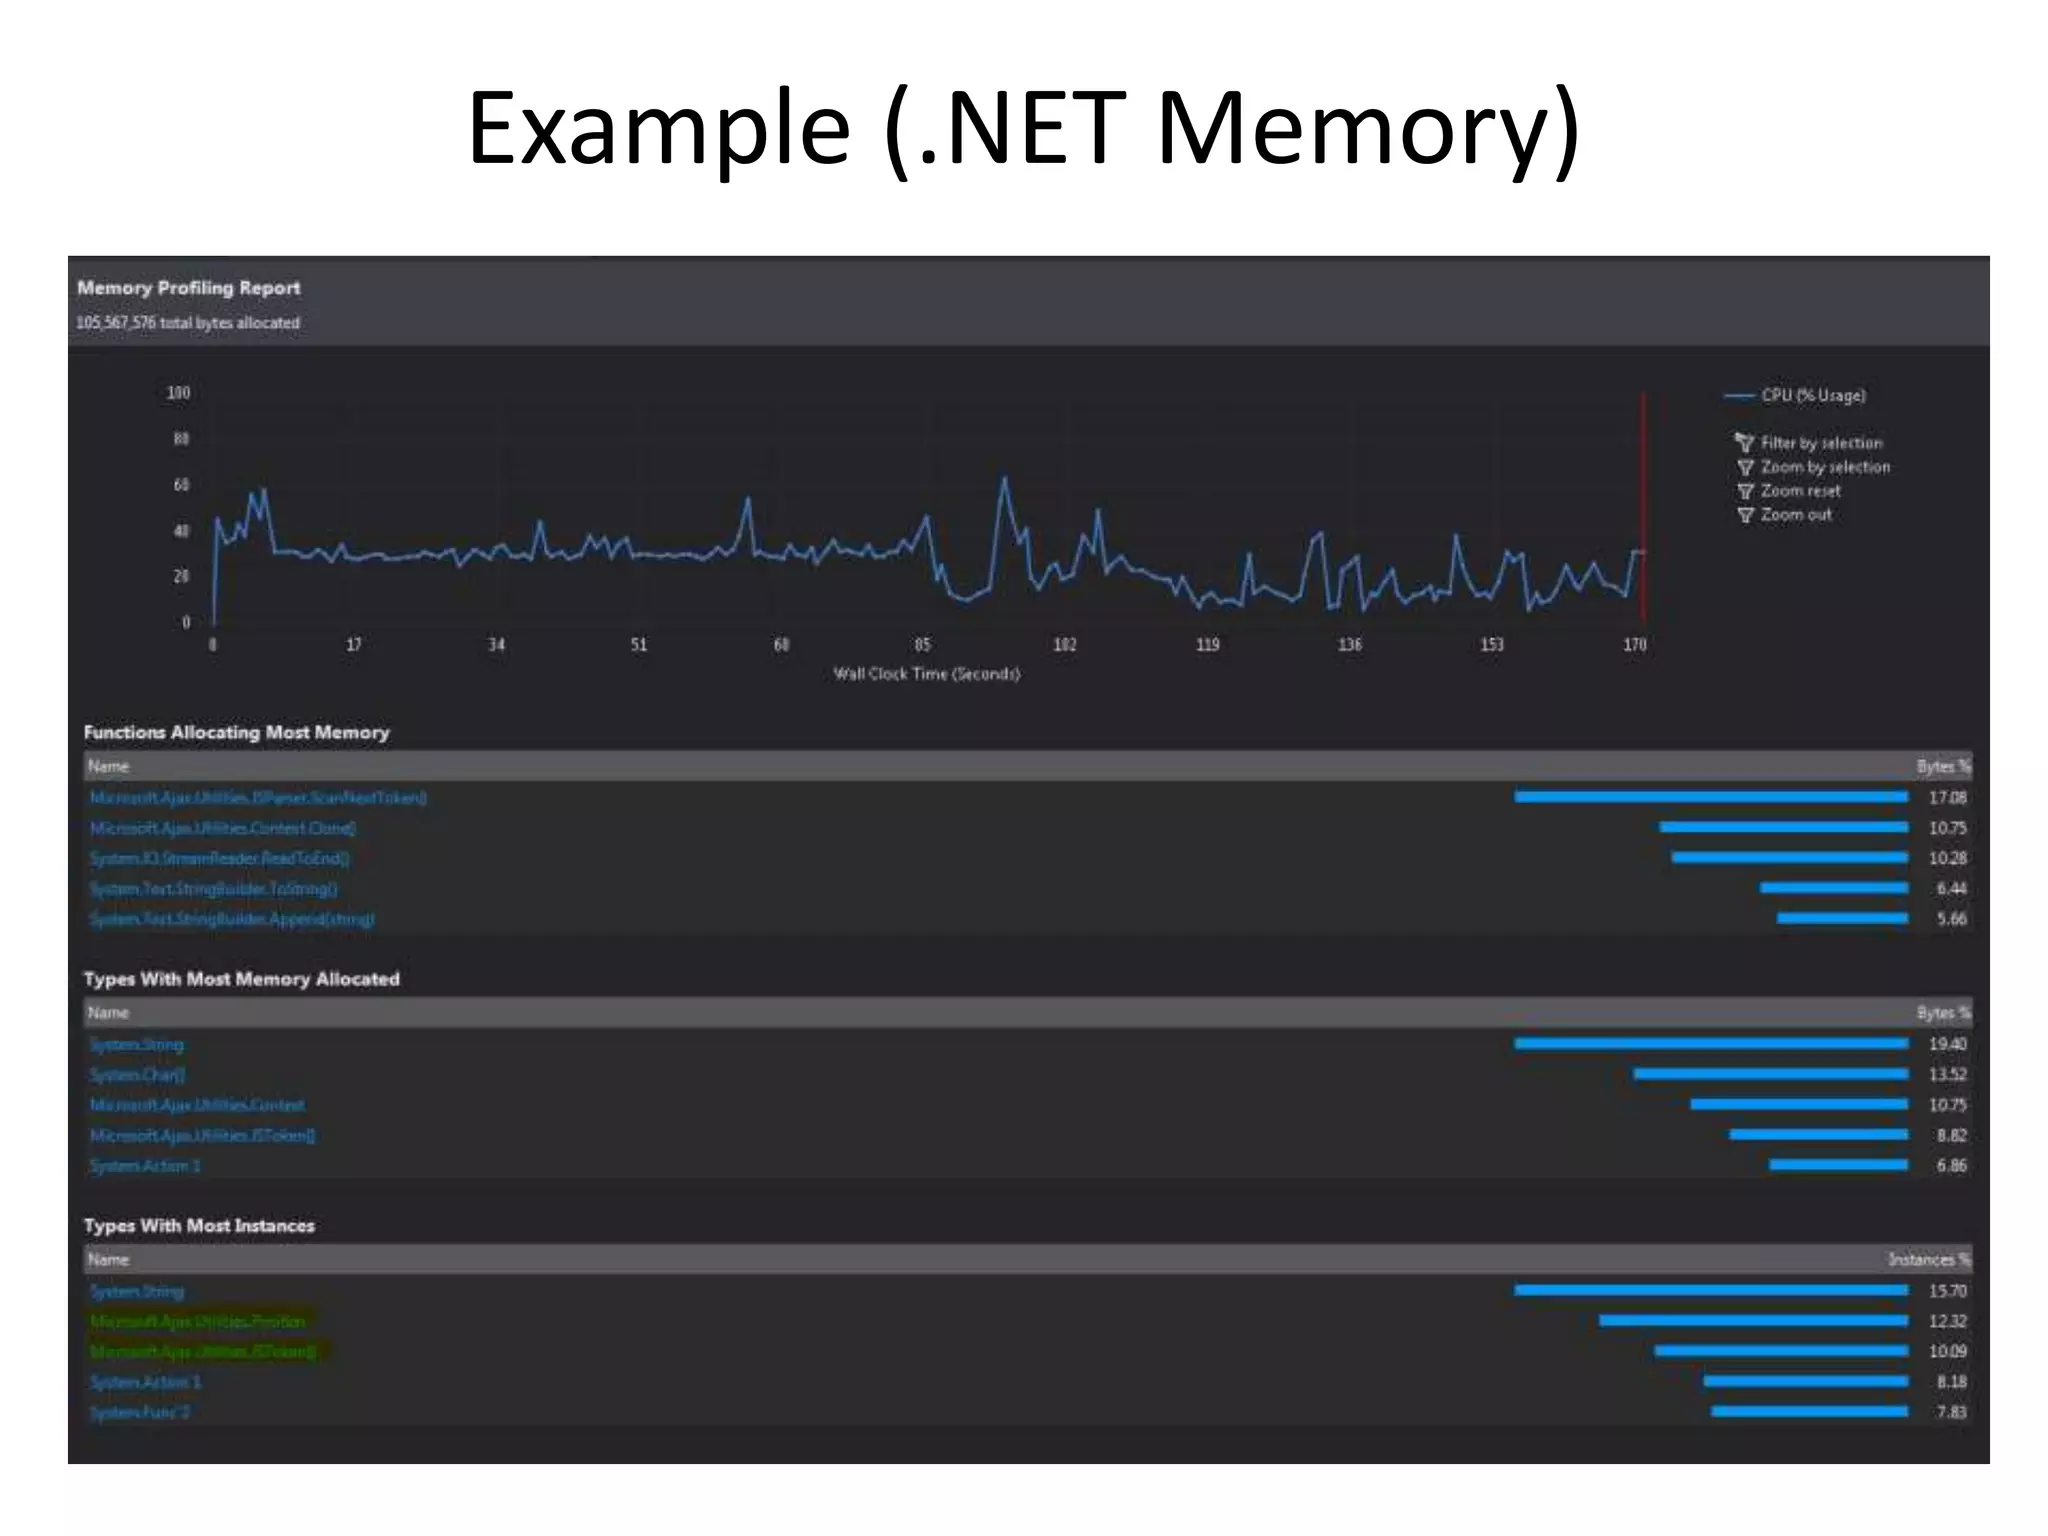
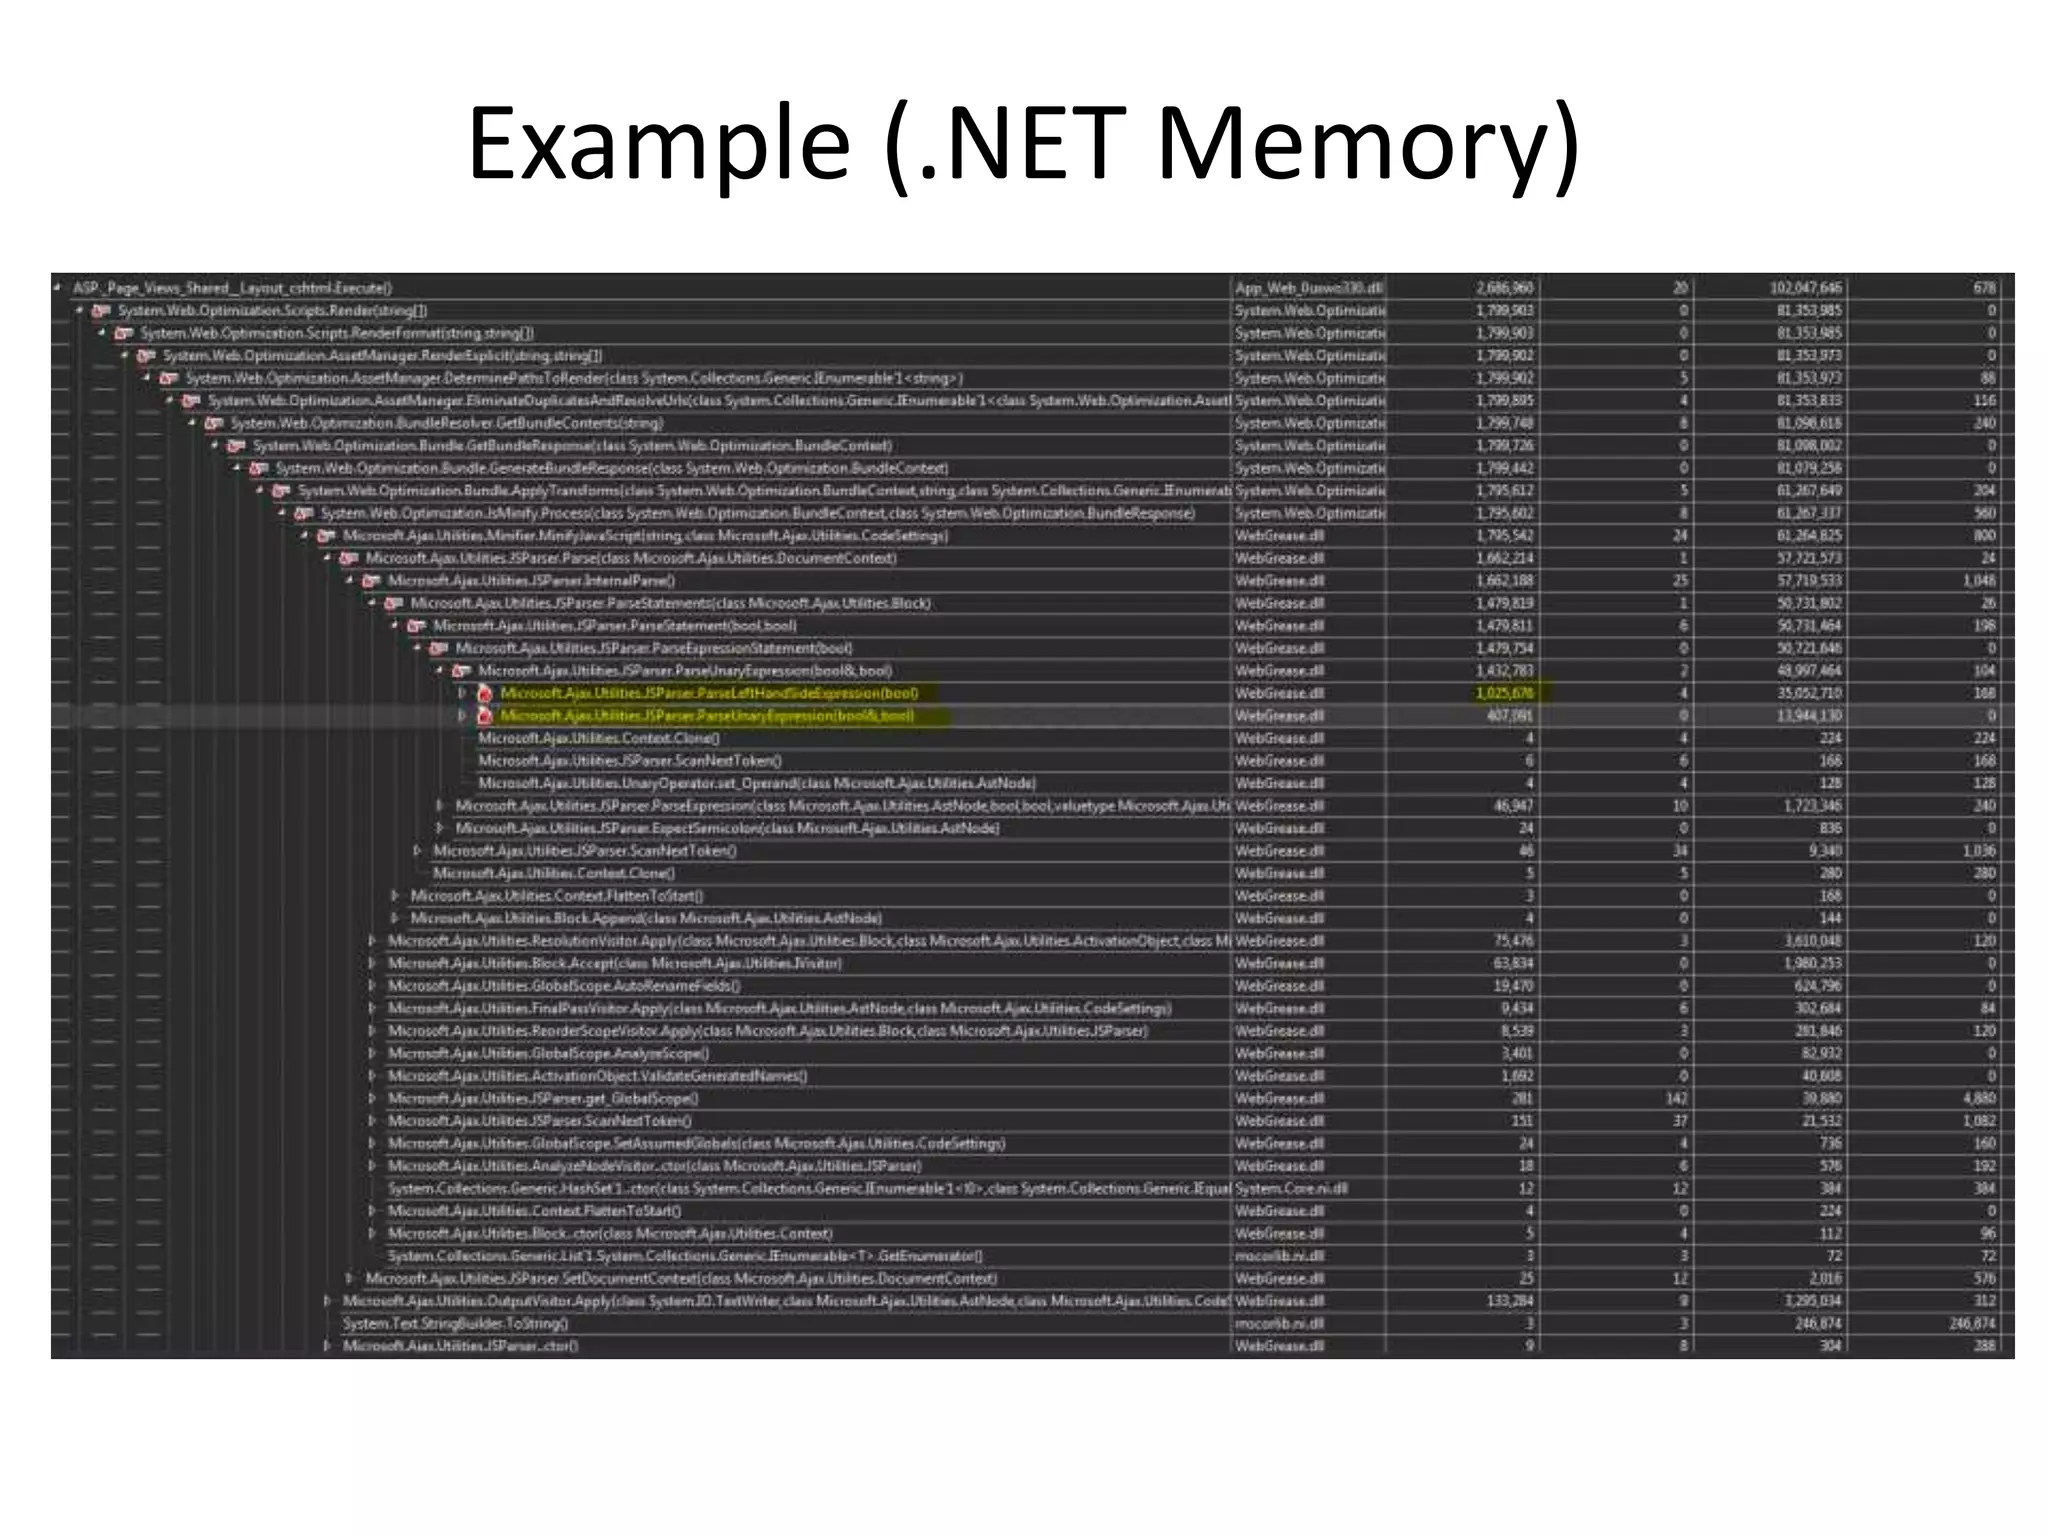

The document discusses various performance profiling methods including sampling, instrumentation, concurrency profiling, .NET memory profiling, and tier interaction profiling. It describes the values and views provided by each method. Sampling collects statistical data and is lightweight, while instrumentation collects detailed timing information for function calls. Concurrency profiling collects information about threads and blocking events. .NET memory profiling interrupts on object allocations and garbage collection to collect allocation data. The general profiler views include summary, call tree, modules, caller/callee, functions, .NET memory, object lifetime, and thread details views. Examples demonstrate using the views to identify performance issues and improvements.