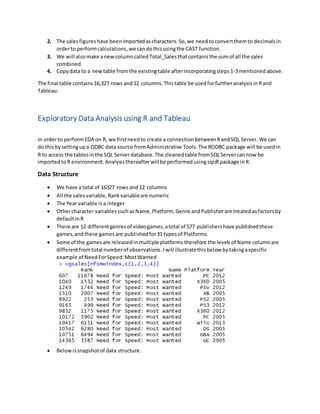
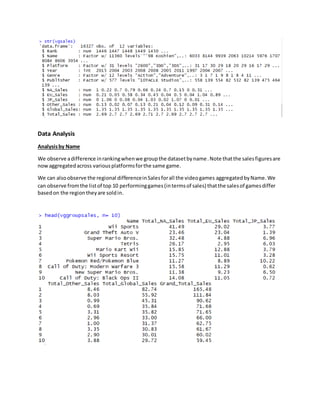
Video Games Sales Analysis
Synopsis
The purpose of thisdocumentisto extractdata from an online source,cleanthe dataandpresent
exploratory dataanalysisof the dataset.The datasetchosenforthisstudyis a videogame salesdataset.
Source: https://www.kaggle.com/gregorut/videogamesales/data
Data Description
Belowisa brief datadescriptionof the selecteddatasetasmentionedonthe website
Thisdatasetcontainsa listof videogameswithsalesgreaterthan100,000 copies.Itwas generatedbya
scrape of vgchartz.com.
Fieldsinclude
 Rank - Rankingof overall sales
 Name - The gamesname
 Platform- Platformof the gamesrelease (i.e.PC,PS4,etc.)
 Year - Year of the game's release
 Genre - Genre of the game
 Publisher- Publisherof the game
 NA_Sales - SalesinNorthAmerica(inmillions)
 EU_Sales- SalesinEurope (inmillions)
 JP_Sales - SalesinJapan(inmillions)
 Other_Sales - Salesin the restof the world(inmillions)
 Global_Sales - Total worldwidesales.
The script to scrape the data is available at https://github.com/GregorUT/vgchartzScrape.Itis
basedon Beautiful SoupusingPython.There are 16,598 records.2 recordswere droppeddue to
incomplete information.
The procureddata is not normalizedatthisstage.Ihave providedanormalizationtechnique of the
datasetunderData Normalizationsection.
Data Cleaning
There are a few problems in the dataset that need to be resolved at an initial stage. Firstly, there
are some null values in the dataset. Secondly, the sales figures are imported as character strings
in SQL Server. Thirdly, none of the column represent total sales of the video games. We will
deal with each problem in the following way:
1. We will findnull valuesfromall columns usingISNULL statementinSQLServer.There are 271
rowswithnull values.
2. The salesfigureshave beenimportedascharacters.So,we needtoconvertthemto decimalsin
orderto performcalculations,we candothisusingthe CAST function.
3. We will alsomake anewcolumncalledTotal_Salesthatcontainsthe sumof all the sales
combined.
4. Copydata to a newtable fromthe existingtable afterincorporatingsteps1-3mentionedabove.
The final table contains 16,327 rows and 12 columns.Thistable be usedforfurtheranalysisinRand
Tableau.
Exploratory Data Analysis using R and Tableau
In orderto performEDA on R, we firstneedto create a connectionbetweenRandSQL Server.We can
do thisbysettingupa ODBC data source fromAdministrative Tools.The RODBC package will be usedin
R to access the tablesinthe SQL Serverdatabase.The cleanedtable fromSQLServercannow be
importedtoR environment.Analysisthereafterwillbe performedusingsqldf package inR.
Data Structure
 We have a total of 16327 rows and12 columns
 All the salesvariable,Rankvariableare numeric
 The Year variable isa integer
 Othercharacter variablessuchasName,Platform, Genre andPublisherare treatedasfactorsby
defaultinR
 There are 12 differentgenresof videogames,atotal of 577 publishershave publishedthese
games,andthese gamesare publishedfor31 typesof Platforms
 Some of the gamesare releasedinmultiple platforms therefore the levelsof Name columnare
differentfromtotal numberof observations.Iwill illustratethisbelow bytakingaspecific
example of NeedForSpeed:MostWanted
 Belowissnapshotof data structure.
Data Analysis
Analysisby Name
We observe adifference inrankingwhenwe groupthe datasetbyname.Note thatthe salesfiguresare
nowaggregatedacross variousplatformsforthe same game.
We can alsoobserve the regional differenceinSalesforall the videogames aggregatedbyName.We
can observe fromthe listof top 10 performinggames(intermsof sales) thatthe salesof gamesdiffer
basedon the regiontheyare soldin.
These gameshave earnedmore than50 Millionacrossall the platforms.Note thatthe colouriscoded
accordingto the genre theybelongto.
Analysisby Platform
Beloware the top 10 performingplatforms arrangedbytotal salesacrossdifferentregions
Thisis the performance of all the platforms acrossdifferentregions
Some insightsfromabove output:
 It can be observedthatPS2has beenthe mostsuccessful platformintermsof sales.
 XBOX360 closelyfollowsPS2inthe secondposition.
 Play Stationhas2 entriesinthe top3 list.
Analysisby Genre
Beloware the total salesfigure byGenre
The above chart displaysthe total salesbyGenre.The genre isfurtherdividedintoPublishers,withthe
biggestrectangle representingthe highestgrossingpublisherforthatparticularGenre.
Insightsfromabove output:
 VideoGamesbelongingtothe Actiongenre grossthe highestsalesbyvolume
 A majorportionof Salesinthe SportsGenre isearnedbythe publishercalled ElectronicArts
 Nintendohas goodSalescollectionacrossmultiple Genres,itprovesthispublisher’s versatility
Analysisby Region
We will printthe Total andMaximumSalesbyRegionusingR,to get a preliminaryestimate of the Sales
by region.
Conclusion
Afterdoingthe EDA we conclude that
 Some of the gamesare releasedonmultiple platforms,resultinginhighersalesof thatparticular
game comparedto othergameswhichare releasedonfewerplatforms
 There are a total of 11360 unique gamesinthe dataset
 Wii Sportsranks numberone intermsof global acrossall the platforms.
 SuperMario ranks number2 whenlookedatSalesfigure forNESplatform, whileGrandTheft
AutoV ranksnumber2 whensalesfiguresare aggregatedacrossall the platforms
 Althoughhighestnumberof gameswere releasedonDSplatform, PS2isthe top grossing
platform
 Actionisthe top grossingGenre
 Afterglobal sales,northAmericaisthe regionthatamountstomaximumsales
 NeedforSpeed:Mostwantedwasreleasedonthe highestnumberof platforms:12,whichis
33% more than thatof the secondplacedgame,FIFA 14, Heroes,andRatatouille

Video game sales analysis

  • 1.
    Video Games SalesAnalysis Synopsis The purpose of thisdocumentisto extractdata from an online source,cleanthe dataandpresent exploratory dataanalysisof the dataset.The datasetchosenforthisstudyis a videogame salesdataset. Source: https://www.kaggle.com/gregorut/videogamesales/data Data Description Belowisa brief datadescriptionof the selecteddatasetasmentionedonthe website Thisdatasetcontainsa listof videogameswithsalesgreaterthan100,000 copies.Itwas generatedbya scrape of vgchartz.com. Fieldsinclude  Rank - Rankingof overall sales  Name - The gamesname  Platform- Platformof the gamesrelease (i.e.PC,PS4,etc.)  Year - Year of the game's release  Genre - Genre of the game  Publisher- Publisherof the game  NA_Sales - SalesinNorthAmerica(inmillions)  EU_Sales- SalesinEurope (inmillions)  JP_Sales - SalesinJapan(inmillions)  Other_Sales - Salesin the restof the world(inmillions)  Global_Sales - Total worldwidesales. The script to scrape the data is available at https://github.com/GregorUT/vgchartzScrape.Itis basedon Beautiful SoupusingPython.There are 16,598 records.2 recordswere droppeddue to incomplete information. The procureddata is not normalizedatthisstage.Ihave providedanormalizationtechnique of the datasetunderData Normalizationsection. Data Cleaning There are a few problems in the dataset that need to be resolved at an initial stage. Firstly, there are some null values in the dataset. Secondly, the sales figures are imported as character strings in SQL Server. Thirdly, none of the column represent total sales of the video games. We will deal with each problem in the following way: 1. We will findnull valuesfromall columns usingISNULL statementinSQLServer.There are 271 rowswithnull values.
  • 2.
    2. The salesfigureshavebeenimportedascharacters.So,we needtoconvertthemto decimalsin orderto performcalculations,we candothisusingthe CAST function. 3. We will alsomake anewcolumncalledTotal_Salesthatcontainsthe sumof all the sales combined. 4. Copydata to a newtable fromthe existingtable afterincorporatingsteps1-3mentionedabove. The final table contains 16,327 rows and 12 columns.Thistable be usedforfurtheranalysisinRand Tableau. Exploratory Data Analysis using R and Tableau In orderto performEDA on R, we firstneedto create a connectionbetweenRandSQL Server.We can do thisbysettingupa ODBC data source fromAdministrative Tools.The RODBC package will be usedin R to access the tablesinthe SQL Serverdatabase.The cleanedtable fromSQLServercannow be importedtoR environment.Analysisthereafterwillbe performedusingsqldf package inR. Data Structure  We have a total of 16327 rows and12 columns  All the salesvariable,Rankvariableare numeric  The Year variable isa integer  Othercharacter variablessuchasName,Platform, Genre andPublisherare treatedasfactorsby defaultinR  There are 12 differentgenresof videogames,atotal of 577 publishershave publishedthese games,andthese gamesare publishedfor31 typesof Platforms  Some of the gamesare releasedinmultiple platforms therefore the levelsof Name columnare differentfromtotal numberof observations.Iwill illustratethisbelow bytakingaspecific example of NeedForSpeed:MostWanted  Belowissnapshotof data structure.
  • 3.
    Data Analysis Analysisby Name Weobserve adifference inrankingwhenwe groupthe datasetbyname.Note thatthe salesfiguresare nowaggregatedacross variousplatformsforthe same game. We can alsoobserve the regional differenceinSalesforall the videogames aggregatedbyName.We can observe fromthe listof top 10 performinggames(intermsof sales) thatthe salesof gamesdiffer basedon the regiontheyare soldin.
  • 4.
    These gameshave earnedmorethan50 Millionacrossall the platforms.Note thatthe colouriscoded accordingto the genre theybelongto. Analysisby Platform Beloware the top 10 performingplatforms arrangedbytotal salesacrossdifferentregions
  • 5.
    Thisis the performanceof all the platforms acrossdifferentregions Some insightsfromabove output:  It can be observedthatPS2has beenthe mostsuccessful platformintermsof sales.  XBOX360 closelyfollowsPS2inthe secondposition.  Play Stationhas2 entriesinthe top3 list.
  • 6.
    Analysisby Genre Beloware thetotal salesfigure byGenre The above chart displaysthe total salesbyGenre.The genre isfurtherdividedintoPublishers,withthe biggestrectangle representingthe highestgrossingpublisherforthatparticularGenre. Insightsfromabove output:  VideoGamesbelongingtothe Actiongenre grossthe highestsalesbyvolume  A majorportionof Salesinthe SportsGenre isearnedbythe publishercalled ElectronicArts  Nintendohas goodSalescollectionacrossmultiple Genres,itprovesthispublisher’s versatility
  • 7.
    Analysisby Region We willprintthe Total andMaximumSalesbyRegionusingR,to get a preliminaryestimate of the Sales by region.
  • 8.
    Conclusion Afterdoingthe EDA weconclude that  Some of the gamesare releasedonmultiple platforms,resultinginhighersalesof thatparticular game comparedto othergameswhichare releasedonfewerplatforms  There are a total of 11360 unique gamesinthe dataset  Wii Sportsranks numberone intermsof global acrossall the platforms.  SuperMario ranks number2 whenlookedatSalesfigure forNESplatform, whileGrandTheft AutoV ranksnumber2 whensalesfiguresare aggregatedacrossall the platforms  Althoughhighestnumberof gameswere releasedonDSplatform, PS2isthe top grossing platform  Actionisthe top grossingGenre  Afterglobal sales,northAmericaisthe regionthatamountstomaximumsales  NeedforSpeed:Mostwantedwasreleasedonthe highestnumberof platforms:12,whichis 33% more than thatof the secondplacedgame,FIFA 14, Heroes,andRatatouille