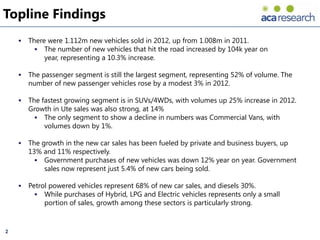
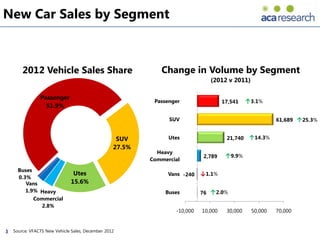
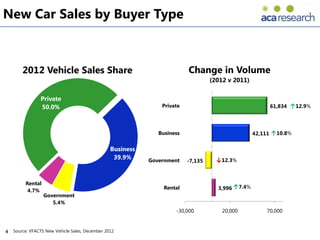
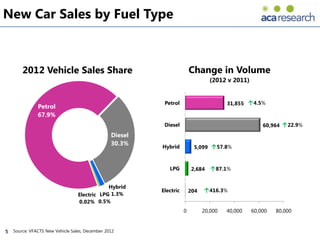
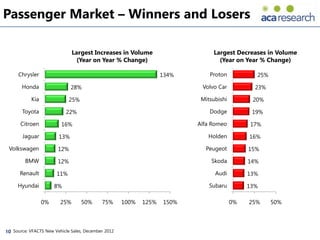
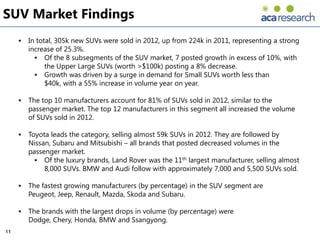
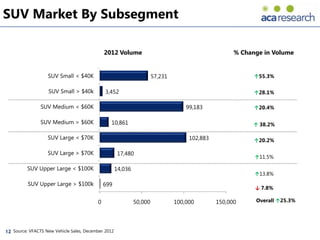
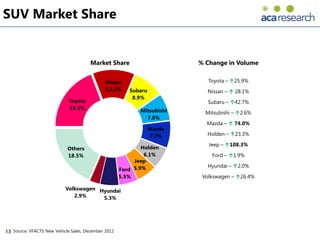
SlideShare a Scribd company logo
An Analysis of the Key Insights from the
       VFACTS New Car Sales Data 2012


1
Topline Findings
       There were 1.112m new vehicles sold in 2012, up from 1.008m in 2011.
           The number of new vehicles that hit the road increased by 104k year on
             year, representing a 10.3% increase.

       The passenger segment is still the largest segment, representing 52% of volume. The
        number of new passenger vehicles rose by a modest 3% in 2012.

       The fastest growing segment is in SUVs/4WDs, with volumes up 25% increase in 2012.
        Growth in Ute sales was also strong, at 14%
           The only segment to show a decline in numbers was Commercial Vans, with
             volumes down by 1%.

       The growth in the new car sales has been fueled by private and business buyers, up
        13% and 11% respectively.
           Government purchases of new vehicles was down 12% year on year. Government
             sales now represent just 5.4% of new cars being sold.

       Petrol powered vehicles represent 68% of new car sales, and diesels 30%.
           While purchases of Hybrid, LPG and Electric vehicles represents only a small
             portion of sales, growth among these sectors is particularly strong.


2
New Car Sales by Segment


        2012 Vehicle Sales Share                             Change in Volume by Segment
                                                                               (2012 v 2011)

                Passenger
                                                           Passenger                 17,541    ↑3.1%
                  51.9%

                                                                SUV                                      61,689 ↑25.3%


                                                   SUV          Utes                  21,740    ↑14.3%
                                                  27.5%
                                                            Heavy
                                                                            2,789     ↑9.9%
                                                          Commercial

      Buses
                               Utes                             Vans -240   ↓1.1%
      0.3%
         Vans                 15.6%
         1.9% Heavy                                            Buses        76 ↑2.0%
            Commercial
              2.8%
                                                                  -10,000   10,000    30,000    50,000   70,000


3   Source: VFACTS New Vehicle Sales, December 2012
New Car Sales by Buyer Type


        2012 Vehicle Sales Share                                          Change in Volume
                                                                                   (2012 v 2011)

                Private
                50.0%                                           Private                                 61,834 ↑12.9%


                                                               Business                            42,111 ↑10.8%

                                                 Business
                                                  39.9%     Government               ↓12.3%
                                                                          -7,135


         Rental
          4.7%
                                                                 Rental              3,996 ↑7.4%
                  Government
                     5.4%
                                                                     -30,000           20,000          70,000


4   Source: VFACTS New Vehicle Sales, December 2012
New Car Sales by Fuel Type


        2012 Vehicle Sales Share                                         Change in Volume
                                                                                 (2012 v 2011)


                                                           Petrol                       31,855 ↑4.5%
               Petrol
               67.9%
                                                           Diesel                                    60,964 ↑22.9%
                                                 Diesel
                                                 30.3%    Hybrid          5,099 ↑57.8%


                                                             LPG         2,684 ↑87.1%


                                              Hybrid
                                                          Electric       204   ↑416.3%
                                  Electric LPG 1.3%
                                  0.02% 0.5%
                                                                     0         20,000   40,000   60,000   80,000


5   Source: VFACTS New Vehicle Sales, December 2012
Fuel Preferences by Segment


                                                           Share of Volume
                                                        Private v Non-Private
                       Petrol              ↑2%               57%           43%


                       Diesel                         ↑2%      36%           64%


                      Hybrid                   ↑15%           44%           56%


                         LPG                                 ↑3% 13%              87%


                     Electric                                       19%           81%     ↑4%


                             -100%                    -50%            0%            50%    100%


6   Source: VFACTS New Vehicle Sales, December 2012
Passenger Market Findings
       In total, almost 577k new passenger vehicles were sold in 2012, up from 559k in
        2011, representing a 3.7% increase.
           The two largest segments - the light and small passenger segments – posted
              modest growth.
           The continued decline in demand for large passenger cars is offset by strong
              growth in the medium passenger segment.

       The top 10 manufacturers account for 84% of passenger vehicles sold in 2012.
           The top 20 manufacturers account for 98% of volume, leaving 25 brands
             representing just 1.8% of volume

       Of the mainstream brands, Toyota has the largest volume, sold more than 100k
        passenger vehicles in 2012. They are followed by Holden and Hyundai.
           Of the luxury brands, Mercedes Benz sold almost 15k passenger vehicles in
             2012, making it the 12th largest manufacturer by volume. They are followed by
             BMW in 14th and Audi in 15th.

       The brands with the largest increases in volume (by percentage) were
        Chrysler, Honda, Kia, Toyota and Citroen.

       The brands with the largest drops in volume (by percentage) were
        Proton, Volvo, Mitsubishi, Dodge and Alfa Romeo.
7
Passenger Market By Subsegment

                                               2012 Volume                                        % Change in Volume


                   Light < $25K                                         135,297                         ↑4.1%
                   Light > $25K            2,309                                                        ↓7.0%
                   Small < $40K                                                               241,154   ↑3.3%
                   Small > $40K              11,013                                                     ↑2.8%
                Medium < $60K                               68,847                                      ↑18.6%
                Medium > $60K                 18,827                                                    ↑5.0%
                   Large < $70K                         58,400                                          ↓20.4%
                   Large > $70K             4,696                                                       ↓1.0%
           Upper Large < $100K             2,666                                                        ↑18.3%
           Upper Large > $100K             569                                                          ↓27.8%
          People Movers < $55K               10,625                                                     ↑6.9%
          People Movers > $55k             1,015                                                        ↓13.5%
                  Sports < $80K                15,830                                                   ↑91.6%
                  Sports > $80K             4,564                                                       ↑16.0%
                 Sports > $200K            1,043                                                        ↑19.2%

                                       0           50,000    100,000   150,000    200,000   250,000      Overall ↑3.1%


8   Source: VFACTS New Vehicle Sales, December 2012
Passenger Market Share


                                        Market Share                   % Change in Volume

                                                                          Toyota – ↑21.9%
                                           Holden
                                           13.0%                         Holden – ↓16.1%
                                                       Hyundai
                                                                          Hyundai – ↑7.7%
                          Toyota                        12.0%
                          17.6%                                           Mazda – ↑5.1%
                                                                           Ford – ↓4.5%
                                                               Mazda
                                                               11.9%    Volkswagen – ↑12.4%
                                                                          Honda – ↑27.6%
                         Others                               Ford         Kia – ↑25.3%
                         15.7%                                8.4%
                                                                          Suzuki – ↓4.2%
                                                        VW
                                                                        Mitsubishi – ↓20.0%
                                             Kia Honda 6.1%
                                            4.0% 5.4%
                      Mitsubishi
                        2.7% Suzuki
                                 3.3%


9   Source: VFACTS New Vehicle Sales, December 2012
Passenger Market – Winners and Losers

                               Largest Increases in Volume                     Largest Decreases in Volume
                                (Year on Year % Change)                          (Year on Year % Change)

      Chrysler                                                     134%       Proton           25%

       Honda                  28%                                          Volvo Car           23%

            Kia              25%                                           Mitsubishi         20%

       Toyota               22%                                               Dodge           19%

       Citroen           16%                                              Alfa Romeo         17%

       Jaguar           13%                                                  Holden          16%

 Volkswagen             12%                                                 Peugeot          15%

         BMW            12%                                                    Skoda         14%

      Renault          11%                                                      Audi         13%

     Hyundai           8%                                                     Subaru         13%

                  0%     25%       50%      75%      100%   125%   150%                 0%   25%     50%


10 Source: VFACTS New Vehicle Sales, December 2012
SUV Market Findings
        In total, 305k new SUVs were sold in 2012, up from 224k in 2011, representing a strong
         increase of 25.3%.
            Of the 8 subsegments of the SUV market, 7 posted growth in excess of 10%, with
               the Upper Large SUVs (worth >$100k) posting a 8% decrease.
            Growth was driven by a surge in demand for Small SUVs worth less than
               $40k, with a 55% increase in volume year on year.

        The top 10 manufacturers account for 81% of SUVs sold in 2012, similar to the
         passenger market. The top 12 manufacturers in this segment all increased the volume
         of SUVs sold in 2012.

        Toyota leads the category, selling almost 59k SUVs in 2012. They are followed by
         Nissan, Subaru and Mitsubishi – all brands that posted decreased volumes in the
         passenger market.
            Of the luxury brands, Land Rover was the 11th largest manufacturer, selling almost
              8,000 SUVs. BMW and Audi follow with approximately 7,000 and 5,500 SUVs sold.

        The fastest growing manufacturers (by percentage) in the SUV segment are
         Peugeot, Jeep, Renault, Mazda, Skoda and Subaru.

        The brands with the largest drops in volume (by percentage) were
         Dodge, Chery, Honda, BMW and Ssangyong.
11
SUV Market By Subsegment

                                              2012 Volume                                            % Change in Volume


                   SUV Small < $40K                                    57,231                              ↑55.3%

                   SUV Small > $40k           3,452                                                        ↑28.1%

                SUV Medium < $60K                                                   99,183                 ↑20.4%

                SUV Medium > $60K               10,861                                                    ↑ 38.2%

                   SUV Large < $70K                                                  102,883               ↑20.2%

                   SUV Large > $70K                   17,480
                                                                                                           ↑11.5%

          SUV Upper Large < $100K                    14,036
                                                                                                           ↑13.8%
          SUV Upper Large > $100k             699
                                                                                                           ↓ 7.8%

                                          0                   50,000            100,000        150,000     Overall ↑25.3%


12 Source: VFACTS New Vehicle Sales, December 2012
SUV Market Share


                                       Market Share                      % Change in Volume


                                              Nissan                        Toyota – ↑25.9%
                                              12.2%     Subaru              Nissan – ↑ 28.1%
                                                         8.9%
                             Toyota                                         Subaru – ↑42.7%
                             19.2%                          Mitsubishi     Mitsubishi – ↑2.6%
                                                              7.8%
                                                                           Mazda – ↑ 74.0%
                                                                 Mazda
                                                                 7.7%      Holden – ↑23.3%
                                                                            Jeep – ↑108.3%
                            Others                           Holden
                            18.5%                             6.1%           Ford – ↑1.9%
                                                          Jeep
                                                                            Hyundai – ↑2.0%
                                                     Ford 5.9%
                                                     5.5%                 Volkswagen – ↑26.4%

                           Volkswagen Hyundai
                              2.9%     5.3%


13 Source: VFACTS New Vehicle Sales, December 2012
SUV Market – Winners and Losers

                              Largest Increases in Volume                         Largest Decreases in Volume
                               (Year on Year % Change)                              (Year on Year % Change)

  Peugeot                                                      121%
                                                                                Dodge                          56%
       Jeep                                                 108%

   Renault                                           88%
                                                                                 Chery                    48%
    Mazda                                     74%

     Skoda                          48%
                                                                                Honda              18%
    Subaru                       43%

Land Rover                     37%
                                                                                 BMW          4%
       Audi                   34%

    Nissan                 28%
                                                                             Ssangyong    0.3%
     Suzuki                26%

              0%      25%        50%       75%       100%    125%     150%               0%    25%       50%    75%   100%


14 Source: VFACTS New Vehicle Sales, December 2012
Light Commercial Market Findings

        Just over 198k new light commercial vehicles were sold in 2012. Growth in the segment
         was 12.2% year on year, topping the 177k light commercial vehicles sold in 2011.
            The market consisted of 174k Utes, 21k Vans, and almost 4k Buses

        Growth in the light commercial segment was driven by a surge in demand for
         Utes, particularly 4x4s, which increased 24.7% in 2012.
           The number of Vans sold fell by 1%, while sales for Buses increased 2% in 2012.

        Toyota leads the category, selling 58k light commercial vehicles in 2012.
            Nissan and Ford follow, with both manufacturers posting increases in volumes
            Of the top 10 manufacturers in the segment, only Holden and Hyundai sold fewer
              light commercial vehicles in 2012.

        The fastest growing manufacturers (by percentage) in the light commercial segment
         are Volkswagen, Suzuki, Renault, Great Wall, Mazda and Isuzu.

        The brands with the largest drops in volume (by percentage) were
         Kia, Proton, Peugeot, Land Rover and Hyundai.


15
Light Commercial Market By Subsegment

                                               2012 Volume                              % Change in Volume


          Workhorse / Utes 4x2                             49,233                             ↓ 5.6%


          Workhorse / Utes 4x4                                                124,536         ↑24.7%


                    Vans <= 2.5t         3,316                                                ↑ 4.6%


                    Vans 2.5-3.5t              17,360                                         ↓ 2.2%


         Light Buses < 20 Seats          2,886                                                ↓ 7.6%


          Light Buses 20+ Seats          971
                                                                                             ↑ 14.6%


                                     0                  50,000      100,000      150,000      Overall ↑12.2%


16 Source: VFACTS New Vehicle Sales, December 2012
Light Commercial Market Share


                                       Market Share                % Change in Volume

                                                                      Toyota – ↑12.1%

                                 Toyota               Nissan          Nissan – ↑ 18.2%
                                 29.2%                13.8%            Ford – ↑8.5%
                                                                      Holden – ↓2.7%

                                                            Ford    Mitsubishi – ↑ 6.2%
               Others
                                                           12.7%
                2.2%                                                  Mazda – ↑22.8%
              Hyundai
               3.0%                                                 Volkswagen – ↑64.9%
             Great Wall                                Holden
                                                                      Isuzu – ↑21.7%
                3.8%                                   10.7%
                      Isuzu                                         Great Wall – ↑34.8%
                      3.9%              Mazda Mitsubishi
                                        6.0%    9.6%                 Hyundai – ↓11.4%
                          Volkswagen
                             5.1%


17 Source: VFACTS New Vehicle Sales, December 2012
Light Commercial Market – Winners and Losers


                     Largest Increases in Volume                                Largest Decreases in Volume
                      (Year on Year % Change)                                     (Year on Year % Change)

   Volkswagen                                        65%                  Kia                            71%


         Suzuki                                      62%              Proton                           62%


        Renault                           44%                        Peugeot               18%


     Great Wall                       35%                          Land Rover             12%


         Mazda                  23%                                  Hyundai          11%


          Isuzu                22%                                       Fiat        3%


                  0%         25%        50%           75%   100%                0%         25%   50%    75%    100%


18 Source: VFACTS New Vehicle Sales, December 2012
Heavy Commercial Market Findings
        More than 31k new Heavy Commercial vehicles were purchased in 2012. Volumes rose
         by almost 2,800 trucks, representing a 9.9% increase in sales year on year.

        The total number of large trucks (with GVM of 15 tonnes or more) grew by 20.4%,
         with almost 12k sold in 2012.
            Midsize trucks (GVM of 7.5-15 tonnes) posted growth of 11.9% year on year.
            While smaller trucks, with GVM of 3.5-7.5 tonnes represent the majority of
              volume, the number of these trucks sold was essentially unchanged from 2011.

        Isuzu sold the largest number of heavy commercial vehicles, capturing 23% of the
         market.
            Hino and Kenworth both place in the top 5 manufacturers, with both increasing
              volumes considerably, with growth of 26.5% and 33.6% respectively.
            Mercedes Benz and Mitsubishi also appear in the top 5, but both manufacturers
              sold fewer trucks in 2012 than in 2011.

        The fastest growing manufacturers (by percentage) in the Heavy Commercial segment
         are Renault, Caterpillar, Daf, Volkswagen, Man and Kenworth.

        The brands with the largest drops in volume (by percentage) were Ford, Hyundai
         Trucks, Nissan UD, Fiat and Mitsubishi.

19
Heavy Commercial Market By Subsegment

                                               2012 Volume                               % Change in Volume


              Trucks 3,501-7,500 kgs                              12,696                       ↑ 0.8%


             Trucks 7,501-15,000 kgs                   6,599
                                                                                               ↑ 11.9%


           Trucks 15,001 kgs + Over                              11,755
                                                                                               ↑ 20.4%


                                           0            10,000             20,000   30,000      Overall ↑9.9%


20 Source: VFACTS New Vehicle Sales, December 2012
Heavy Commercial Market Share


                                       Market Share                        % Change in Volume

                                                                               Isuzu – ↑8.7%
                                                      Hino
                                                     13.2%                    Hino – ↑ 26.5%
                               Isuzu
                                                             Mercedes      Mercedes-Benz – ↓1.8%
                               22.5%
                                                              9.9%
                                                                             Mitsubishi – ↓9.8%

                                                              Mitsubishi    Kenworth – ↑ 33.6%
                                                                9.1%          Iveco – ↑23.5%

                                                            Kenworth          Volvo – ↑11.2%
                              Others
                              18.3%                            7.4%        Western Star – ↑14.8%
                                                         Iveco
                                                         6.5%                  Mack– ↑16.1%
                                                     Volvo
                                                     4.2%                   Volkswagen – ↑78.7%
                           Volkswagen
                              2.6%   Mack Western
                                      3.0% Star
                                           3.1%


21 Source: VFACTS New Vehicle Sales, December 2012
Heavy Commercial Market – Winners and Losers


                               Largest Increases in Volume                     Largest Decreases in Volume
                                (Year on Year % Change)                          (Year on Year % Change)


                                              ≈
     Renault                                                 532%           Ford                     77%


  Caterpillar                          98%                              Hyundai
                                                                                               52%
                                                                         Trucks
          Daf                        89%
                                                                       Nissan UD         16%
Volkswagen                         79%

                                                                             Fiat        10%
         Man                   60%


   Kenworth              34%                                           Mitsubishi        10%


                0%                 100%              200%       300%                0%     50%       100%


22 Source: VFACTS New Vehicle Sales, December 2012
Like what you have read? Download your copy of our other free
     automotive market research reports:


     Commercial Vans Insights


     Automotive Finance Insights


23

More Related Content

Viewers also liked

Certificate - Azure Fundamentals
Certificate - Azure FundamentalsCertificate - Azure Fundamentals
Certificate - Azure Fundamentals
Claude LACHAPELLE
 
Articulo
ArticuloArticulo
Articulo
Karo Velasquez
 
Drp
DrpDrp
Fy10 us budget_spending
Fy10 us budget_spendingFy10 us budget_spending
Fy10 us budget_spending
Stephen Castellari
 
Software Licensing for SaaS Applications
Software Licensing for SaaS ApplicationsSoftware Licensing for SaaS Applications
Software Licensing for SaaS Applications
InishTech
 
Pricing for profit
Pricing for profitPricing for profit
Pricing for profit
Azure Group
 
Azure licensing (not) so easy - Laurynas Dovydaitis
Azure licensing (not) so easy - Laurynas DovydaitisAzure licensing (not) so easy - Laurynas Dovydaitis
Azure licensing (not) so easy - Laurynas Dovydaitis
ITCamp
 
Federal it transformation plans
Federal it transformation plansFederal it transformation plans
Federal it transformation plans
Stephen Castellari
 
SharePoint Online Collaboration Options
SharePoint Online Collaboration OptionsSharePoint Online Collaboration Options
SharePoint Online Collaboration Options
Roman Nedzelsky
 
City square presentation
City square presentationCity square presentation
City square presentation
fishball5
 
ITCamp 2013 - Peter Leeson - Intelligent Evolution
ITCamp 2013 - Peter Leeson - Intelligent EvolutionITCamp 2013 - Peter Leeson - Intelligent Evolution
ITCamp 2013 - Peter Leeson - Intelligent Evolution
ITCamp
 
Tutorial Brainshark 4
Tutorial Brainshark 4Tutorial Brainshark 4
Tutorial Brainshark 4
Fernanda Gonzalez
 
Advanced scientific visualization
Advanced scientific visualizationAdvanced scientific visualization
Advanced scientific visualizationCharles Flynt
 
SharePoint Online v Onprem - presented by Concurrency, Inc
SharePoint Online v Onprem - presented by Concurrency, IncSharePoint Online v Onprem - presented by Concurrency, Inc
SharePoint Online v Onprem - presented by Concurrency, Inc
Concurrency, Inc.
 
Azure Cloud Dev Camp - Introduction
Azure Cloud Dev Camp - IntroductionAzure Cloud Dev Camp - Introduction
Azure Cloud Dev Camp - Introduction
giventocode
 
Enterprise Social - SharePoint, Office 365, Lync, Yammer
Enterprise Social - SharePoint, Office 365, Lync, YammerEnterprise Social - SharePoint, Office 365, Lync, Yammer
Enterprise Social - SharePoint, Office 365, Lync, Yammer
Concurrency, Inc.
 
Introduction to scientific visualization
Introduction to scientific visualizationIntroduction to scientific visualization
Introduction to scientific visualization
Open Party
 
10 Tips for Better Visualization of Scientific Data
10 Tips for Better Visualization of Scientific Data10 Tips for Better Visualization of Scientific Data
10 Tips for Better Visualization of Scientific Data
Sercan Ahi
 
Taking Advantage of the SharePoint 2013 REST API
Taking Advantage of the SharePoint 2013 REST APITaking Advantage of the SharePoint 2013 REST API
Taking Advantage of the SharePoint 2013 REST API
Eric Shupps
 
Curso SharePoint 2013 overview
Curso SharePoint 2013 overviewCurso SharePoint 2013 overview
Curso SharePoint 2013 overview
Vladimir Medina
 

Viewers also liked (20)

Certificate - Azure Fundamentals
Certificate - Azure FundamentalsCertificate - Azure Fundamentals
Certificate - Azure Fundamentals
 
Articulo
ArticuloArticulo
Articulo
 
Drp
DrpDrp
Drp
 
Fy10 us budget_spending
Fy10 us budget_spendingFy10 us budget_spending
Fy10 us budget_spending
 
Software Licensing for SaaS Applications
Software Licensing for SaaS ApplicationsSoftware Licensing for SaaS Applications
Software Licensing for SaaS Applications
 
Pricing for profit
Pricing for profitPricing for profit
Pricing for profit
 
Azure licensing (not) so easy - Laurynas Dovydaitis
Azure licensing (not) so easy - Laurynas DovydaitisAzure licensing (not) so easy - Laurynas Dovydaitis
Azure licensing (not) so easy - Laurynas Dovydaitis
 
Federal it transformation plans
Federal it transformation plansFederal it transformation plans
Federal it transformation plans
 
SharePoint Online Collaboration Options
SharePoint Online Collaboration OptionsSharePoint Online Collaboration Options
SharePoint Online Collaboration Options
 
City square presentation
City square presentationCity square presentation
City square presentation
 
ITCamp 2013 - Peter Leeson - Intelligent Evolution
ITCamp 2013 - Peter Leeson - Intelligent EvolutionITCamp 2013 - Peter Leeson - Intelligent Evolution
ITCamp 2013 - Peter Leeson - Intelligent Evolution
 
Tutorial Brainshark 4
Tutorial Brainshark 4Tutorial Brainshark 4
Tutorial Brainshark 4
 
Advanced scientific visualization
Advanced scientific visualizationAdvanced scientific visualization
Advanced scientific visualization
 
SharePoint Online v Onprem - presented by Concurrency, Inc
SharePoint Online v Onprem - presented by Concurrency, IncSharePoint Online v Onprem - presented by Concurrency, Inc
SharePoint Online v Onprem - presented by Concurrency, Inc
 
Azure Cloud Dev Camp - Introduction
Azure Cloud Dev Camp - IntroductionAzure Cloud Dev Camp - Introduction
Azure Cloud Dev Camp - Introduction
 
Enterprise Social - SharePoint, Office 365, Lync, Yammer
Enterprise Social - SharePoint, Office 365, Lync, YammerEnterprise Social - SharePoint, Office 365, Lync, Yammer
Enterprise Social - SharePoint, Office 365, Lync, Yammer
 
Introduction to scientific visualization
Introduction to scientific visualizationIntroduction to scientific visualization
Introduction to scientific visualization
 
10 Tips for Better Visualization of Scientific Data
10 Tips for Better Visualization of Scientific Data10 Tips for Better Visualization of Scientific Data
10 Tips for Better Visualization of Scientific Data
 
Taking Advantage of the SharePoint 2013 REST API
Taking Advantage of the SharePoint 2013 REST APITaking Advantage of the SharePoint 2013 REST API
Taking Advantage of the SharePoint 2013 REST API
 
Curso SharePoint 2013 overview
Curso SharePoint 2013 overviewCurso SharePoint 2013 overview
Curso SharePoint 2013 overview
 

Similar to Automotive Industry Research: An Analysis of the Key Insights from the VFACTS New Car Sales Data 2012

Auto monthly Nov-2011-R K Global
Auto monthly Nov-2011-R K GlobalAuto monthly Nov-2011-R K Global
Auto monthly Nov-2011-R K Global
Aditya Jha
 
Marketing Plan
Marketing PlanMarketing Plan
Marketing Plan
tienle07
 
Hbsny event
Hbsny eventHbsny event
Hbsny event
rattnerfamily
 
Global Automakers at the Washington Automotive Press Association - 2012
Global Automakers at the Washington Automotive Press Association - 2012Global Automakers at the Washington Automotive Press Association - 2012
Global Automakers at the Washington Automotive Press Association - 2012
Global_Automakers
 
Apresentação 4 q11 e 2011 eng final
Apresentação 4 q11 e 2011 eng finalApresentação 4 q11 e 2011 eng final
Apresentação 4 q11 e 2011 eng final
Localiza
 
Tesla Strategy
Tesla StrategyTesla Strategy
Tesla Strategy
Joe Baker
 
Monthly Market Report - March 2013
Monthly Market Report - March 2013Monthly Market Report - March 2013
Monthly Market Report - March 2013
Global_Automakers
 
Used Vehicle Premiums
Used Vehicle PremiumsUsed Vehicle Premiums
Used Vehicle Premiums
Counselorauto
 
Marketing management hw 4
Marketing management hw 4Marketing management hw 4
Marketing management hw 4
teamvolt
 
Marketing management hw 4
Marketing management hw 4Marketing management hw 4
Marketing management hw 4
teamvolt
 
Investor Presentation Q3 2012/13
Investor Presentation Q3 2012/13Investor Presentation Q3 2012/13
Investor Presentation Q3 2012/13
HEMAS HOLDINGS PLC
 
Apresentação 1 q12 eng-1
Apresentação 1 q12 eng-1Apresentação 1 q12 eng-1
Apresentação 1 q12 eng-1
Localiza
 
Apresentação 1 q12 eng
Apresentação 1 q12 engApresentação 1 q12 eng
Apresentação 1 q12 eng
Localiza
 
Auto monthly Dec-2011-R K Global
Auto monthly Dec-2011-R K GlobalAuto monthly Dec-2011-R K Global
Auto monthly Dec-2011-R K Global
Aditya Jha
 
Roadshow presentation - March/09
Roadshow presentation - March/09Roadshow presentation - March/09
Roadshow presentation - March/09
Localiza
 
Indian 2 w industry, update, feb 2012
Indian 2 w industry, update, feb 2012Indian 2 w industry, update, feb 2012
Indian 2 w industry, update, feb 2012
Apoorva Bedekar
 
Indian 2 w industry, update, feb 2012
Indian 2 w industry, update, feb 2012Indian 2 w industry, update, feb 2012
Indian 2 w industry, update, feb 2012
Apoorva Bedekar
 
Investor presentation 1H 2012/13
Investor presentation 1H 2012/13Investor presentation 1H 2012/13
Investor presentation 1H 2012/13
HEMAS HOLDINGS PLC
 
Auto sector update 011010
Auto sector update   011010Auto sector update   011010
Auto sector update 011010
Angel Broking
 
The Nest Report Q3 2012
The Nest Report Q3 2012The Nest Report Q3 2012
The Nest Report Q3 2012
Jeremy Hart
 

Similar to Automotive Industry Research: An Analysis of the Key Insights from the VFACTS New Car Sales Data 2012 (20)

Auto monthly Nov-2011-R K Global
Auto monthly Nov-2011-R K GlobalAuto monthly Nov-2011-R K Global
Auto monthly Nov-2011-R K Global
 
Marketing Plan
Marketing PlanMarketing Plan
Marketing Plan
 
Hbsny event
Hbsny eventHbsny event
Hbsny event
 
Global Automakers at the Washington Automotive Press Association - 2012
Global Automakers at the Washington Automotive Press Association - 2012Global Automakers at the Washington Automotive Press Association - 2012
Global Automakers at the Washington Automotive Press Association - 2012
 
Apresentação 4 q11 e 2011 eng final
Apresentação 4 q11 e 2011 eng finalApresentação 4 q11 e 2011 eng final
Apresentação 4 q11 e 2011 eng final
 
Tesla Strategy
Tesla StrategyTesla Strategy
Tesla Strategy
 
Monthly Market Report - March 2013
Monthly Market Report - March 2013Monthly Market Report - March 2013
Monthly Market Report - March 2013
 
Used Vehicle Premiums
Used Vehicle PremiumsUsed Vehicle Premiums
Used Vehicle Premiums
 
Marketing management hw 4
Marketing management hw 4Marketing management hw 4
Marketing management hw 4
 
Marketing management hw 4
Marketing management hw 4Marketing management hw 4
Marketing management hw 4
 
Investor Presentation Q3 2012/13
Investor Presentation Q3 2012/13Investor Presentation Q3 2012/13
Investor Presentation Q3 2012/13
 
Apresentação 1 q12 eng-1
Apresentação 1 q12 eng-1Apresentação 1 q12 eng-1
Apresentação 1 q12 eng-1
 
Apresentação 1 q12 eng
Apresentação 1 q12 engApresentação 1 q12 eng
Apresentação 1 q12 eng
 
Auto monthly Dec-2011-R K Global
Auto monthly Dec-2011-R K GlobalAuto monthly Dec-2011-R K Global
Auto monthly Dec-2011-R K Global
 
Roadshow presentation - March/09
Roadshow presentation - March/09Roadshow presentation - March/09
Roadshow presentation - March/09
 
Indian 2 w industry, update, feb 2012
Indian 2 w industry, update, feb 2012Indian 2 w industry, update, feb 2012
Indian 2 w industry, update, feb 2012
 
Indian 2 w industry, update, feb 2012
Indian 2 w industry, update, feb 2012Indian 2 w industry, update, feb 2012
Indian 2 w industry, update, feb 2012
 
Investor presentation 1H 2012/13
Investor presentation 1H 2012/13Investor presentation 1H 2012/13
Investor presentation 1H 2012/13
 
Auto sector update 011010
Auto sector update   011010Auto sector update   011010
Auto sector update 011010
 
The Nest Report Q3 2012
The Nest Report Q3 2012The Nest Report Q3 2012
The Nest Report Q3 2012
 

Recently uploaded

AadiShakti Projects ( Asp Cranes ) Raipur
AadiShakti Projects ( Asp Cranes ) RaipurAadiShakti Projects ( Asp Cranes ) Raipur
AadiShakti Projects ( Asp Cranes ) Raipur
AadiShakti Projects
 
Expanding Access to Affordable At-Home EV Charging by Vanessa Warheit
Expanding Access to Affordable At-Home EV Charging by Vanessa WarheitExpanding Access to Affordable At-Home EV Charging by Vanessa Warheit
Expanding Access to Affordable At-Home EV Charging by Vanessa Warheit
Forth
 
原版制作(Exeter毕业证书)埃克塞特大学毕业证完成信一模一样
原版制作(Exeter毕业证书)埃克塞特大学毕业证完成信一模一样原版制作(Exeter毕业证书)埃克塞特大学毕业证完成信一模一样
原版制作(Exeter毕业证书)埃克塞特大学毕业证完成信一模一样
78tq3hi2
 
一比一原版(WashU文凭证书)圣路易斯华盛顿大学毕业证如何办理
一比一原版(WashU文凭证书)圣路易斯华盛顿大学毕业证如何办理一比一原版(WashU文凭证书)圣路易斯华盛顿大学毕业证如何办理
一比一原版(WashU文凭证书)圣路易斯华盛顿大学毕业证如何办理
afkxen
 
Here's Why Every Semi-Truck Should Have ELDs
Here's Why Every Semi-Truck Should Have ELDsHere's Why Every Semi-Truck Should Have ELDs
Here's Why Every Semi-Truck Should Have ELDs
jennifermiller8137
 
What do the symbols on vehicle dashboard mean?
What do the symbols on vehicle dashboard mean?What do the symbols on vehicle dashboard mean?
What do the symbols on vehicle dashboard mean?
Hyundai Motor Group
 
一比一原版(Columbia文凭证书)哥伦比亚大学毕业证如何办理
一比一原版(Columbia文凭证书)哥伦比亚大学毕业证如何办理一比一原版(Columbia文凭证书)哥伦比亚大学毕业证如何办理
一比一原版(Columbia文凭证书)哥伦比亚大学毕业证如何办理
afkxen
 
Globalfleet - global fleet survey 2021 full results
Globalfleet - global fleet survey 2021 full resultsGlobalfleet - global fleet survey 2021 full results
Globalfleet - global fleet survey 2021 full results
vaterland
 
What Could Be Behind Your Mercedes Sprinter's Power Loss on Uphill Roads
What Could Be Behind Your Mercedes Sprinter's Power Loss on Uphill RoadsWhat Could Be Behind Your Mercedes Sprinter's Power Loss on Uphill Roads
What Could Be Behind Your Mercedes Sprinter's Power Loss on Uphill Roads
Sprinter Gurus
 
Hand Gesture Control Robotic Arm using image processing.pptx
Hand Gesture Control Robotic Arm using image processing.pptxHand Gesture Control Robotic Arm using image processing.pptx
Hand Gesture Control Robotic Arm using image processing.pptx
wstatus456
 
EV Charging at Multifamily Properties by Kevin Donnelly
EV Charging at Multifamily Properties by Kevin DonnellyEV Charging at Multifamily Properties by Kevin Donnelly
EV Charging at Multifamily Properties by Kevin Donnelly
Forth
 
Catalytic Converter theft prevention - NYC.pptx
Catalytic Converter theft prevention - NYC.pptxCatalytic Converter theft prevention - NYC.pptx
Catalytic Converter theft prevention - NYC.pptx
Blue Star Brothers
 
EN Artificial Intelligence by Slidesgo.pptx
EN Artificial Intelligence by Slidesgo.pptxEN Artificial Intelligence by Slidesgo.pptx
EN Artificial Intelligence by Slidesgo.pptx
aichamardi99
 
53286592-Global-Entrepreneurship-and-the-Successful-Growth-Strategies-of-Earl...
53286592-Global-Entrepreneurship-and-the-Successful-Growth-Strategies-of-Earl...53286592-Global-Entrepreneurship-and-the-Successful-Growth-Strategies-of-Earl...
53286592-Global-Entrepreneurship-and-the-Successful-Growth-Strategies-of-Earl...
MarynaYurchenko2
 
快速办理(napier毕业证书)英国龙比亚大学毕业证在读证明一模一样
快速办理(napier毕业证书)英国龙比亚大学毕业证在读证明一模一样快速办理(napier毕业证书)英国龙比亚大学毕业证在读证明一模一样
快速办理(napier毕业证书)英国龙比亚大学毕业证在读证明一模一样
78tq3hi2
 
EV Charging at MFH Properties by Whitaker Jamieson
EV Charging at MFH Properties by Whitaker JamiesonEV Charging at MFH Properties by Whitaker Jamieson
EV Charging at MFH Properties by Whitaker Jamieson
Forth
 
Kaizen SMT_MI_PCBA for Quality Engineerspptx
Kaizen SMT_MI_PCBA for Quality EngineerspptxKaizen SMT_MI_PCBA for Quality Engineerspptx
Kaizen SMT_MI_PCBA for Quality Engineerspptx
vaibhavsrivastava482521
 

Recently uploaded (17)

AadiShakti Projects ( Asp Cranes ) Raipur
AadiShakti Projects ( Asp Cranes ) RaipurAadiShakti Projects ( Asp Cranes ) Raipur
AadiShakti Projects ( Asp Cranes ) Raipur
 
Expanding Access to Affordable At-Home EV Charging by Vanessa Warheit
Expanding Access to Affordable At-Home EV Charging by Vanessa WarheitExpanding Access to Affordable At-Home EV Charging by Vanessa Warheit
Expanding Access to Affordable At-Home EV Charging by Vanessa Warheit
 
原版制作(Exeter毕业证书)埃克塞特大学毕业证完成信一模一样
原版制作(Exeter毕业证书)埃克塞特大学毕业证完成信一模一样原版制作(Exeter毕业证书)埃克塞特大学毕业证完成信一模一样
原版制作(Exeter毕业证书)埃克塞特大学毕业证完成信一模一样
 
一比一原版(WashU文凭证书)圣路易斯华盛顿大学毕业证如何办理
一比一原版(WashU文凭证书)圣路易斯华盛顿大学毕业证如何办理一比一原版(WashU文凭证书)圣路易斯华盛顿大学毕业证如何办理
一比一原版(WashU文凭证书)圣路易斯华盛顿大学毕业证如何办理
 
Here's Why Every Semi-Truck Should Have ELDs
Here's Why Every Semi-Truck Should Have ELDsHere's Why Every Semi-Truck Should Have ELDs
Here's Why Every Semi-Truck Should Have ELDs
 
What do the symbols on vehicle dashboard mean?
What do the symbols on vehicle dashboard mean?What do the symbols on vehicle dashboard mean?
What do the symbols on vehicle dashboard mean?
 
一比一原版(Columbia文凭证书)哥伦比亚大学毕业证如何办理
一比一原版(Columbia文凭证书)哥伦比亚大学毕业证如何办理一比一原版(Columbia文凭证书)哥伦比亚大学毕业证如何办理
一比一原版(Columbia文凭证书)哥伦比亚大学毕业证如何办理
 
Globalfleet - global fleet survey 2021 full results
Globalfleet - global fleet survey 2021 full resultsGlobalfleet - global fleet survey 2021 full results
Globalfleet - global fleet survey 2021 full results
 
What Could Be Behind Your Mercedes Sprinter's Power Loss on Uphill Roads
What Could Be Behind Your Mercedes Sprinter's Power Loss on Uphill RoadsWhat Could Be Behind Your Mercedes Sprinter's Power Loss on Uphill Roads
What Could Be Behind Your Mercedes Sprinter's Power Loss on Uphill Roads
 
Hand Gesture Control Robotic Arm using image processing.pptx
Hand Gesture Control Robotic Arm using image processing.pptxHand Gesture Control Robotic Arm using image processing.pptx
Hand Gesture Control Robotic Arm using image processing.pptx
 
EV Charging at Multifamily Properties by Kevin Donnelly
EV Charging at Multifamily Properties by Kevin DonnellyEV Charging at Multifamily Properties by Kevin Donnelly
EV Charging at Multifamily Properties by Kevin Donnelly
 
Catalytic Converter theft prevention - NYC.pptx
Catalytic Converter theft prevention - NYC.pptxCatalytic Converter theft prevention - NYC.pptx
Catalytic Converter theft prevention - NYC.pptx
 
EN Artificial Intelligence by Slidesgo.pptx
EN Artificial Intelligence by Slidesgo.pptxEN Artificial Intelligence by Slidesgo.pptx
EN Artificial Intelligence by Slidesgo.pptx
 
53286592-Global-Entrepreneurship-and-the-Successful-Growth-Strategies-of-Earl...
53286592-Global-Entrepreneurship-and-the-Successful-Growth-Strategies-of-Earl...53286592-Global-Entrepreneurship-and-the-Successful-Growth-Strategies-of-Earl...
53286592-Global-Entrepreneurship-and-the-Successful-Growth-Strategies-of-Earl...
 
快速办理(napier毕业证书)英国龙比亚大学毕业证在读证明一模一样
快速办理(napier毕业证书)英国龙比亚大学毕业证在读证明一模一样快速办理(napier毕业证书)英国龙比亚大学毕业证在读证明一模一样
快速办理(napier毕业证书)英国龙比亚大学毕业证在读证明一模一样
 
EV Charging at MFH Properties by Whitaker Jamieson
EV Charging at MFH Properties by Whitaker JamiesonEV Charging at MFH Properties by Whitaker Jamieson
EV Charging at MFH Properties by Whitaker Jamieson
 
Kaizen SMT_MI_PCBA for Quality Engineerspptx
Kaizen SMT_MI_PCBA for Quality EngineerspptxKaizen SMT_MI_PCBA for Quality Engineerspptx
Kaizen SMT_MI_PCBA for Quality Engineerspptx
 

Automotive Industry Research: An Analysis of the Key Insights from the VFACTS New Car Sales Data 2012

  • 1. An Analysis of the Key Insights from the VFACTS New Car Sales Data 2012 1
  • 2. Topline Findings  There were 1.112m new vehicles sold in 2012, up from 1.008m in 2011.  The number of new vehicles that hit the road increased by 104k year on year, representing a 10.3% increase.  The passenger segment is still the largest segment, representing 52% of volume. The number of new passenger vehicles rose by a modest 3% in 2012.  The fastest growing segment is in SUVs/4WDs, with volumes up 25% increase in 2012. Growth in Ute sales was also strong, at 14%  The only segment to show a decline in numbers was Commercial Vans, with volumes down by 1%.  The growth in the new car sales has been fueled by private and business buyers, up 13% and 11% respectively.  Government purchases of new vehicles was down 12% year on year. Government sales now represent just 5.4% of new cars being sold.  Petrol powered vehicles represent 68% of new car sales, and diesels 30%.  While purchases of Hybrid, LPG and Electric vehicles represents only a small portion of sales, growth among these sectors is particularly strong. 2
  • 3. New Car Sales by Segment 2012 Vehicle Sales Share Change in Volume by Segment (2012 v 2011) Passenger Passenger 17,541 ↑3.1% 51.9% SUV 61,689 ↑25.3% SUV Utes 21,740 ↑14.3% 27.5% Heavy 2,789 ↑9.9% Commercial Buses Utes Vans -240 ↓1.1% 0.3% Vans 15.6% 1.9% Heavy Buses 76 ↑2.0% Commercial 2.8% -10,000 10,000 30,000 50,000 70,000 3 Source: VFACTS New Vehicle Sales, December 2012
  • 4. New Car Sales by Buyer Type 2012 Vehicle Sales Share Change in Volume (2012 v 2011) Private 50.0% Private 61,834 ↑12.9% Business 42,111 ↑10.8% Business 39.9% Government ↓12.3% -7,135 Rental 4.7% Rental 3,996 ↑7.4% Government 5.4% -30,000 20,000 70,000 4 Source: VFACTS New Vehicle Sales, December 2012
  • 5. New Car Sales by Fuel Type 2012 Vehicle Sales Share Change in Volume (2012 v 2011) Petrol 31,855 ↑4.5% Petrol 67.9% Diesel 60,964 ↑22.9% Diesel 30.3% Hybrid 5,099 ↑57.8% LPG 2,684 ↑87.1% Hybrid Electric 204 ↑416.3% Electric LPG 1.3% 0.02% 0.5% 0 20,000 40,000 60,000 80,000 5 Source: VFACTS New Vehicle Sales, December 2012
  • 6. Fuel Preferences by Segment Share of Volume Private v Non-Private Petrol ↑2% 57% 43% Diesel ↑2% 36% 64% Hybrid ↑15% 44% 56% LPG ↑3% 13% 87% Electric 19% 81% ↑4% -100% -50% 0% 50% 100% 6 Source: VFACTS New Vehicle Sales, December 2012
  • 7. Passenger Market Findings  In total, almost 577k new passenger vehicles were sold in 2012, up from 559k in 2011, representing a 3.7% increase.  The two largest segments - the light and small passenger segments – posted modest growth.  The continued decline in demand for large passenger cars is offset by strong growth in the medium passenger segment.  The top 10 manufacturers account for 84% of passenger vehicles sold in 2012.  The top 20 manufacturers account for 98% of volume, leaving 25 brands representing just 1.8% of volume  Of the mainstream brands, Toyota has the largest volume, sold more than 100k passenger vehicles in 2012. They are followed by Holden and Hyundai.  Of the luxury brands, Mercedes Benz sold almost 15k passenger vehicles in 2012, making it the 12th largest manufacturer by volume. They are followed by BMW in 14th and Audi in 15th.  The brands with the largest increases in volume (by percentage) were Chrysler, Honda, Kia, Toyota and Citroen.  The brands with the largest drops in volume (by percentage) were Proton, Volvo, Mitsubishi, Dodge and Alfa Romeo. 7
  • 8. Passenger Market By Subsegment 2012 Volume % Change in Volume Light < $25K 135,297 ↑4.1% Light > $25K 2,309 ↓7.0% Small < $40K 241,154 ↑3.3% Small > $40K 11,013 ↑2.8% Medium < $60K 68,847 ↑18.6% Medium > $60K 18,827 ↑5.0% Large < $70K 58,400 ↓20.4% Large > $70K 4,696 ↓1.0% Upper Large < $100K 2,666 ↑18.3% Upper Large > $100K 569 ↓27.8% People Movers < $55K 10,625 ↑6.9% People Movers > $55k 1,015 ↓13.5% Sports < $80K 15,830 ↑91.6% Sports > $80K 4,564 ↑16.0% Sports > $200K 1,043 ↑19.2% 0 50,000 100,000 150,000 200,000 250,000 Overall ↑3.1% 8 Source: VFACTS New Vehicle Sales, December 2012
  • 9. Passenger Market Share Market Share % Change in Volume Toyota – ↑21.9% Holden 13.0% Holden – ↓16.1% Hyundai Hyundai – ↑7.7% Toyota 12.0% 17.6% Mazda – ↑5.1% Ford – ↓4.5% Mazda 11.9% Volkswagen – ↑12.4% Honda – ↑27.6% Others Ford Kia – ↑25.3% 15.7% 8.4% Suzuki – ↓4.2% VW Mitsubishi – ↓20.0% Kia Honda 6.1% 4.0% 5.4% Mitsubishi 2.7% Suzuki 3.3% 9 Source: VFACTS New Vehicle Sales, December 2012
  • 10. Passenger Market – Winners and Losers Largest Increases in Volume Largest Decreases in Volume (Year on Year % Change) (Year on Year % Change) Chrysler 134% Proton 25% Honda 28% Volvo Car 23% Kia 25% Mitsubishi 20% Toyota 22% Dodge 19% Citroen 16% Alfa Romeo 17% Jaguar 13% Holden 16% Volkswagen 12% Peugeot 15% BMW 12% Skoda 14% Renault 11% Audi 13% Hyundai 8% Subaru 13% 0% 25% 50% 75% 100% 125% 150% 0% 25% 50% 10 Source: VFACTS New Vehicle Sales, December 2012
  • 11. SUV Market Findings  In total, 305k new SUVs were sold in 2012, up from 224k in 2011, representing a strong increase of 25.3%.  Of the 8 subsegments of the SUV market, 7 posted growth in excess of 10%, with the Upper Large SUVs (worth >$100k) posting a 8% decrease.  Growth was driven by a surge in demand for Small SUVs worth less than $40k, with a 55% increase in volume year on year.  The top 10 manufacturers account for 81% of SUVs sold in 2012, similar to the passenger market. The top 12 manufacturers in this segment all increased the volume of SUVs sold in 2012.  Toyota leads the category, selling almost 59k SUVs in 2012. They are followed by Nissan, Subaru and Mitsubishi – all brands that posted decreased volumes in the passenger market.  Of the luxury brands, Land Rover was the 11th largest manufacturer, selling almost 8,000 SUVs. BMW and Audi follow with approximately 7,000 and 5,500 SUVs sold.  The fastest growing manufacturers (by percentage) in the SUV segment are Peugeot, Jeep, Renault, Mazda, Skoda and Subaru.  The brands with the largest drops in volume (by percentage) were Dodge, Chery, Honda, BMW and Ssangyong. 11
  • 12. SUV Market By Subsegment 2012 Volume % Change in Volume SUV Small < $40K 57,231 ↑55.3% SUV Small > $40k 3,452 ↑28.1% SUV Medium < $60K 99,183 ↑20.4% SUV Medium > $60K 10,861 ↑ 38.2% SUV Large < $70K 102,883 ↑20.2% SUV Large > $70K 17,480 ↑11.5% SUV Upper Large < $100K 14,036 ↑13.8% SUV Upper Large > $100k 699 ↓ 7.8% 0 50,000 100,000 150,000 Overall ↑25.3% 12 Source: VFACTS New Vehicle Sales, December 2012
  • 13. SUV Market Share Market Share % Change in Volume Nissan Toyota – ↑25.9% 12.2% Subaru Nissan – ↑ 28.1% 8.9% Toyota Subaru – ↑42.7% 19.2% Mitsubishi Mitsubishi – ↑2.6% 7.8% Mazda – ↑ 74.0% Mazda 7.7% Holden – ↑23.3% Jeep – ↑108.3% Others Holden 18.5% 6.1% Ford – ↑1.9% Jeep Hyundai – ↑2.0% Ford 5.9% 5.5% Volkswagen – ↑26.4% Volkswagen Hyundai 2.9% 5.3% 13 Source: VFACTS New Vehicle Sales, December 2012
  • 14. SUV Market – Winners and Losers Largest Increases in Volume Largest Decreases in Volume (Year on Year % Change) (Year on Year % Change) Peugeot 121% Dodge 56% Jeep 108% Renault 88% Chery 48% Mazda 74% Skoda 48% Honda 18% Subaru 43% Land Rover 37% BMW 4% Audi 34% Nissan 28% Ssangyong 0.3% Suzuki 26% 0% 25% 50% 75% 100% 125% 150% 0% 25% 50% 75% 100% 14 Source: VFACTS New Vehicle Sales, December 2012
  • 15. Light Commercial Market Findings  Just over 198k new light commercial vehicles were sold in 2012. Growth in the segment was 12.2% year on year, topping the 177k light commercial vehicles sold in 2011.  The market consisted of 174k Utes, 21k Vans, and almost 4k Buses  Growth in the light commercial segment was driven by a surge in demand for Utes, particularly 4x4s, which increased 24.7% in 2012.  The number of Vans sold fell by 1%, while sales for Buses increased 2% in 2012.  Toyota leads the category, selling 58k light commercial vehicles in 2012.  Nissan and Ford follow, with both manufacturers posting increases in volumes  Of the top 10 manufacturers in the segment, only Holden and Hyundai sold fewer light commercial vehicles in 2012.  The fastest growing manufacturers (by percentage) in the light commercial segment are Volkswagen, Suzuki, Renault, Great Wall, Mazda and Isuzu.  The brands with the largest drops in volume (by percentage) were Kia, Proton, Peugeot, Land Rover and Hyundai. 15
  • 16. Light Commercial Market By Subsegment 2012 Volume % Change in Volume Workhorse / Utes 4x2 49,233 ↓ 5.6% Workhorse / Utes 4x4 124,536 ↑24.7% Vans <= 2.5t 3,316 ↑ 4.6% Vans 2.5-3.5t 17,360 ↓ 2.2% Light Buses < 20 Seats 2,886 ↓ 7.6% Light Buses 20+ Seats 971 ↑ 14.6% 0 50,000 100,000 150,000 Overall ↑12.2% 16 Source: VFACTS New Vehicle Sales, December 2012
  • 17. Light Commercial Market Share Market Share % Change in Volume Toyota – ↑12.1% Toyota Nissan Nissan – ↑ 18.2% 29.2% 13.8% Ford – ↑8.5% Holden – ↓2.7% Ford Mitsubishi – ↑ 6.2% Others 12.7% 2.2% Mazda – ↑22.8% Hyundai 3.0% Volkswagen – ↑64.9% Great Wall Holden Isuzu – ↑21.7% 3.8% 10.7% Isuzu Great Wall – ↑34.8% 3.9% Mazda Mitsubishi 6.0% 9.6% Hyundai – ↓11.4% Volkswagen 5.1% 17 Source: VFACTS New Vehicle Sales, December 2012
  • 18. Light Commercial Market – Winners and Losers Largest Increases in Volume Largest Decreases in Volume (Year on Year % Change) (Year on Year % Change) Volkswagen 65% Kia 71% Suzuki 62% Proton 62% Renault 44% Peugeot 18% Great Wall 35% Land Rover 12% Mazda 23% Hyundai 11% Isuzu 22% Fiat 3% 0% 25% 50% 75% 100% 0% 25% 50% 75% 100% 18 Source: VFACTS New Vehicle Sales, December 2012
  • 19. Heavy Commercial Market Findings  More than 31k new Heavy Commercial vehicles were purchased in 2012. Volumes rose by almost 2,800 trucks, representing a 9.9% increase in sales year on year.  The total number of large trucks (with GVM of 15 tonnes or more) grew by 20.4%, with almost 12k sold in 2012.  Midsize trucks (GVM of 7.5-15 tonnes) posted growth of 11.9% year on year.  While smaller trucks, with GVM of 3.5-7.5 tonnes represent the majority of volume, the number of these trucks sold was essentially unchanged from 2011.  Isuzu sold the largest number of heavy commercial vehicles, capturing 23% of the market.  Hino and Kenworth both place in the top 5 manufacturers, with both increasing volumes considerably, with growth of 26.5% and 33.6% respectively.  Mercedes Benz and Mitsubishi also appear in the top 5, but both manufacturers sold fewer trucks in 2012 than in 2011.  The fastest growing manufacturers (by percentage) in the Heavy Commercial segment are Renault, Caterpillar, Daf, Volkswagen, Man and Kenworth.  The brands with the largest drops in volume (by percentage) were Ford, Hyundai Trucks, Nissan UD, Fiat and Mitsubishi. 19
  • 20. Heavy Commercial Market By Subsegment 2012 Volume % Change in Volume Trucks 3,501-7,500 kgs 12,696 ↑ 0.8% Trucks 7,501-15,000 kgs 6,599 ↑ 11.9% Trucks 15,001 kgs + Over 11,755 ↑ 20.4% 0 10,000 20,000 30,000 Overall ↑9.9% 20 Source: VFACTS New Vehicle Sales, December 2012
  • 21. Heavy Commercial Market Share Market Share % Change in Volume Isuzu – ↑8.7% Hino 13.2% Hino – ↑ 26.5% Isuzu Mercedes Mercedes-Benz – ↓1.8% 22.5% 9.9% Mitsubishi – ↓9.8% Mitsubishi Kenworth – ↑ 33.6% 9.1% Iveco – ↑23.5% Kenworth Volvo – ↑11.2% Others 18.3% 7.4% Western Star – ↑14.8% Iveco 6.5% Mack– ↑16.1% Volvo 4.2% Volkswagen – ↑78.7% Volkswagen 2.6% Mack Western 3.0% Star 3.1% 21 Source: VFACTS New Vehicle Sales, December 2012
  • 22. Heavy Commercial Market – Winners and Losers Largest Increases in Volume Largest Decreases in Volume (Year on Year % Change) (Year on Year % Change) ≈ Renault 532% Ford 77% Caterpillar 98% Hyundai 52% Trucks Daf 89% Nissan UD 16% Volkswagen 79% Fiat 10% Man 60% Kenworth 34% Mitsubishi 10% 0% 100% 200% 300% 0% 50% 100% 22 Source: VFACTS New Vehicle Sales, December 2012
  • 23. Like what you have read? Download your copy of our other free automotive market research reports: Commercial Vans Insights Automotive Finance Insights 23