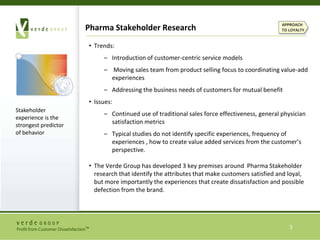
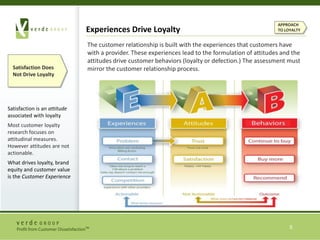
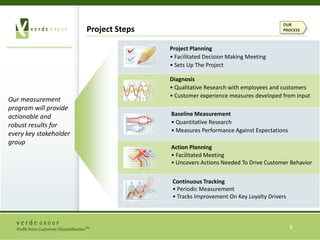
The Verde Group specializes in pharma stakeholder research, focusing on customer satisfaction and loyalty through understanding experiences that lead to dissatisfaction and defection. They emphasize the importance of experiences over mere satisfaction in driving loyalty, outlining a proprietary research process to measure customer and employee interactions and their impact on behavior. This approach provides actionable insights for clients to improve customer experiences, retention, and overall business performance.

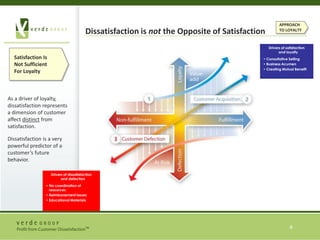
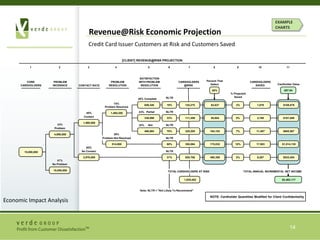

![[CLIENT] REVENUE@RISK PROJECTION1289101134567SATISFACTION Percent That CORE CARDHOLDERSCARDHOLDERSPROBLEM PROBLEM WITH PROBLEM Cardholder ValueDefectCARDHOLDERS @RISKSAVEDINCIDENCERESOLUTIONRESOLUTIONCONTACT RATE$57.94 50%% Projected SavedNLTR45%Complete74% 659,340 19% 125,275 62,637 3% 1,879 $108,876 Problem Resolved PartialNLTR23%40% 1,465,200 Contact 336,996 33% 111,209 55,604 5% 2,780 $161,086 1,980,000 33%NotNLTR32%Problem 468,864 70% 328,205 164,102 7% 11,487 $665,567 26% 4,950,000 NLTRProblem Not Resolved 68% 350,064 175,032 10% 17,503 $1,014,135 514,800 60%No ContactNLTR 15,000,000 2,970,000 460,350 31% 920,700 2% 9,207 $533,454 67%No Problem 10,050,000 TOTAL ANNUAL INCREMENTAL NET INCOMETOTAL CARDHOLDERS AT RISK $2,483,117 1,835,452 Note: NLTR = "Not Likely To Recommend"NOTE: Cardholder Quantities Modified for Client ConfidentialityEXAMPLE CHARTS Revenue@Risk Economic ProjectionCredit Card Issuer Customers at Risk and Customers SavedEconomic Impact Analysis](https://image.slidesharecdn.com/verdegroupcapabilitiesoverview-100916092905-phpapp01/85/Verde-Group-19-320.jpg)


![Client Loyalty Reprint[1]](https://cdn.slidesharecdn.com/ss_thumbnails/clientloyaltyreprint1-12507915816136-phpapp01-thumbnail.jpg?width=640&height=640&fit=bounds)


