ValueStory Usage Reports
•Download as PPTX, PDF•
0 likes•349 views

Usage report examples from ValueStory

Recommended
Recommended
More Related Content
Similar to ValueStory Usage Reports
Similar to ValueStory Usage Reports (20)
More from Alinean, Inc.
More from Alinean, Inc. (20)
Recently uploaded
Recently uploaded (18)
ValueStory Usage Reports
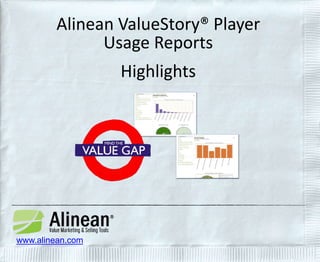
- 1. Alinean ValueStory® Player Usage Reports Highlights www.alinean.com
- 2. ValueStory Usage Reports Help You … • Track adoption & use of ValueStory by your sales reps and channel partners • Provide business intelligence about your prospects & engagements • Correlate ValueStory usage to success (wins, acceleration & deal size)
- 3. Usage Report Web Access Accessed through ValueStory Administration http://YOUR_COMMUNITY.valuestoryapp.com
- 4. Usage Report Types Community Reports • Dashboard • New Registered Users for the Community • Total Registered Users for the Community • Top Users for the Community • Runs/Reports for the Community • Runs per User • Runs by Industry • Runs by Challenge • Runs by Location • Runs by Role • Runs by Company Size (Sales Revenue) • Runs by Company Size (Employees Number) Play Reports • ValueStory Details • Runs • Reports • Runs by Industry • Runs by Challenge • Runs by Location • Runs by Role • Runs by Company Size (Sales Revenue) • Runs by Company Size (Employees Number)
- 5. Dashboard Report Includes Total Registered Users, New Users, Top 10 Users, Total Runs/Reports for the Community, and Total Runs/Reports for each ValueStory Play
- 6. Detailed Reports by Industry Provide a summarized view of usage data by your Prospect’s Industry
- 7. Detailed Reports by Business Challenge Summarize usage data by the Challenges your Prospects face
- 8. Detailed Reports by Geographic Location Provide a summarized view of usage data by your Prospect’s Geographic Location
- 9. Detailed Reports by Role Summarize usage data by your Prospect’s Role or Buyer Profile
- 10. Detailed Reports Provide a summarized view of usage data by Community or Plays
- 11. User-Selectable Report Format Usage Reports can be filtered to focus on specific communities, Plays, date ranges, and user groups to best gather intelligence and communicate results
- 12. For More Information about Alinean ValueStory® Usage Reports Please contact: Alinean Sales sales@alinean.com (407) 382-0005 www.alinean.com
Editor's Notes
- Welcome! This presentation provides a brief walk through of Alinean ValueStory Player Usage Reports. Alinean ValueStory is a value marketing and selling tool that you can use to better communicate your value messaging, provocative insights and financial justification. ValueStory is customized for your unique solutions and campaigns, and built on a powerful Platform as a Service (PaaS) to develop, deliver and evolve your value marketing and selling tools faster, with more functionality, scalability, integration, customer and user intelligence and superior results. Usage Reports, which we will review in this session, help Sale Executives, Sales Operations and Marketing leaders better understand how Alinean ValueStory is being used in the field by sales reps, channel partners and prospects.
- Value Story usage reports support Sales Execs, Sales Operations and Marketing leaders with important information they need to measure adoption, use and the impact of Alinean ValueStory on sales success. Usage Reports provides data that can be used for: Measuring sales reps and channel partners registrations, to assure awareness Tracking tool usage, to assure adoption, and raise coaching and mentoring opportunities for frontline sales or channel sales manager and his/her direct reports. Collecting intelligence about each sales engagement using ValueStory, including the types of prospects being engaged and their challenges / issues. Correlating sales success to ValueStory usage.
- Administrators access ValueStory Usage Reports by logging into their community through a specific Alinean’s ValueStory community URL. Once logged in, rights are provided to specific community administrators so that they can click on Administration to manage the community and obtain usage reports. The ValueStory Administration panel opens, displaying the Administration Dashboard page. In the navigation tree on the left hand side, under the Usage Metrics section, click on Dashboard to access the Usage Reports. The Usage Metrics Dashboard opens with a menu showing available Community and Play usage reports appearing on the left in the navigation tree, and with reports appearing on the right.
- ValueStory’s Usage Reports give you tools to track adoption and use by your sales team, and business intelligence about the prospects that your sales team engages with. A large number of reports are available by Community, for your company overall, and by ValueStory Play, for particular solution sets.
- The Dashboard report is the place to begin to get a summarized view of how ValueStory is being adopted (Registrations), used (Runs and Reports), and sales reps use of specific Plays. For any of the reports, you can use a filter to easily select specific date ranges over which to report on the usage, for example the last quarter or last 12 months.
- Runs by Industry provides insights into which Industries your sales reps and channel partners are leveraging ValueStory with the most / least. The Industry selection is made in ValueStory using the Company Profile, providing insights into which industries are being engaged, and used within ValueStory to personalize the story and insights based on the industry being engaged with. This industry usage report is valuable in determining which industries are most engaged in value discussions, and which to coach / target for more engagement.
- Runs by Challenge are reported based on the challenge or challenges selected by the prospect as part of the discovery process using ValueStory, and across all the various Plays. Multiple challenges can be selected per Run, and are reflected in the reporting. The insight provided by this report can be invaluable in helping the team determine the most common challenges faced by different prospects.
- Runs by Geographic Location are reported based on the location that the prospect selects in the Company Profile. Runs by Geographic Location provides insights into which Industries your sales reps and channel partners are leveraging ValueStory with the most / least. The Location usage report is valuable in determining which geographies are most engaged in value discussions, and which to coach / target for more engagement.
- Runs by Role are reported based on the role or roles the sales rep is engaging with across all of the different Plays. The Roles are set within the ValueStory to indicate who is being engaged with, and to pivot the value storytelling and justification content to best match the role’s challenges and value perspective. Multiple roles can be selected per Run, and this is reflected in the totals. The Roles indicate who is being engaged with most / least often within the prospects, and this intelligence can be used to drive better targeting, positioning and coaching.
- Detailed reports within the Community and for specific Plays provide additional information to help Sales, Sales Operations and Marketing determine specific activities of individual sales reps and channel partners, or specific metrics like industry, roles and challenges for individual Plays.
- Flexibility in reporting allows Community managers to report on data based on a number of criteria to filter results by date range, Plays, and users / groups into meaningful tables, charts, and graphs. Reports can be directly printed, or the data exported with a click of a button into spreadsheets for further manipulation and analysis.
- Thank you for your time. For more information about Alinean ValueStory please contact Alinean Sales.