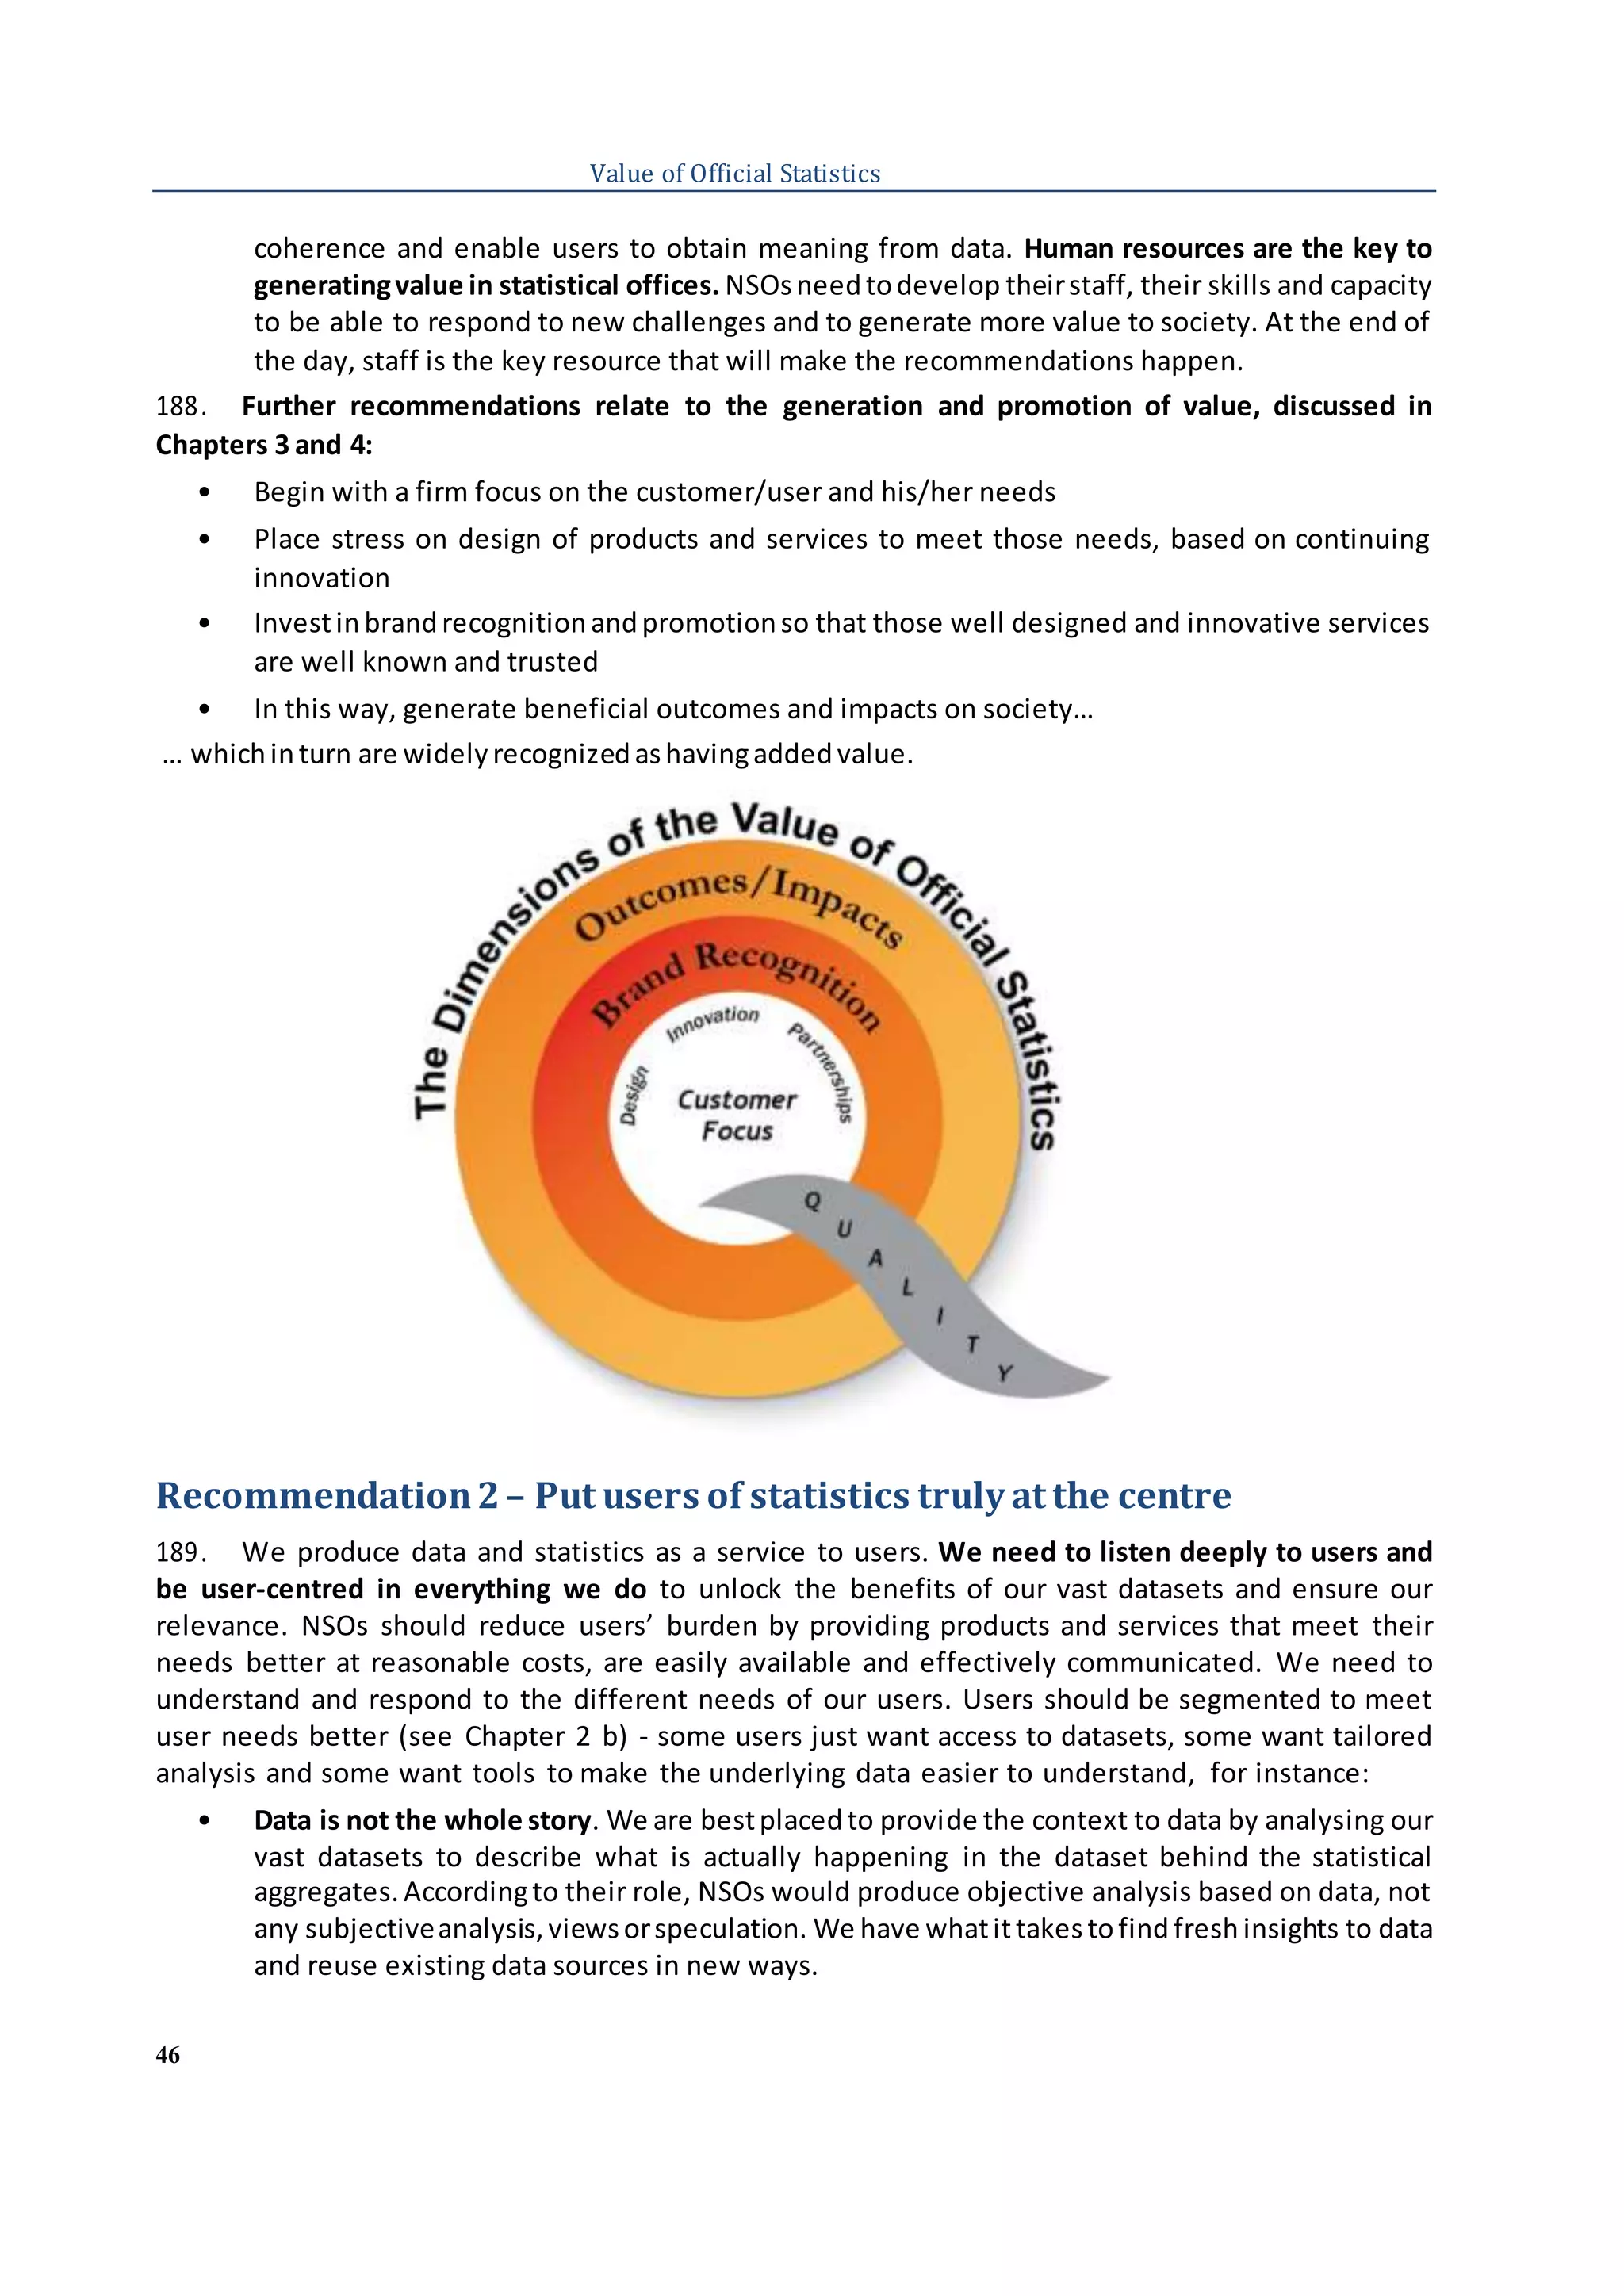
The document presents recommendations on promoting, measuring, and communicating the value of official statistics. It was prepared by a UNECE Task Force consisting of several countries and organizations. The recommendations aim to define what users and society value in official statistics and develop ways to measure this value. The key recommendations are to exploit the strengths of official statistics, put users at the center, design statistics for everyday use, promote innovation, form strategic partnerships, build the official statistics brand, and measure outcomes to demonstrate impact. Taking these steps could help ensure official statistics remain a valuable resource in the digital age.

![63
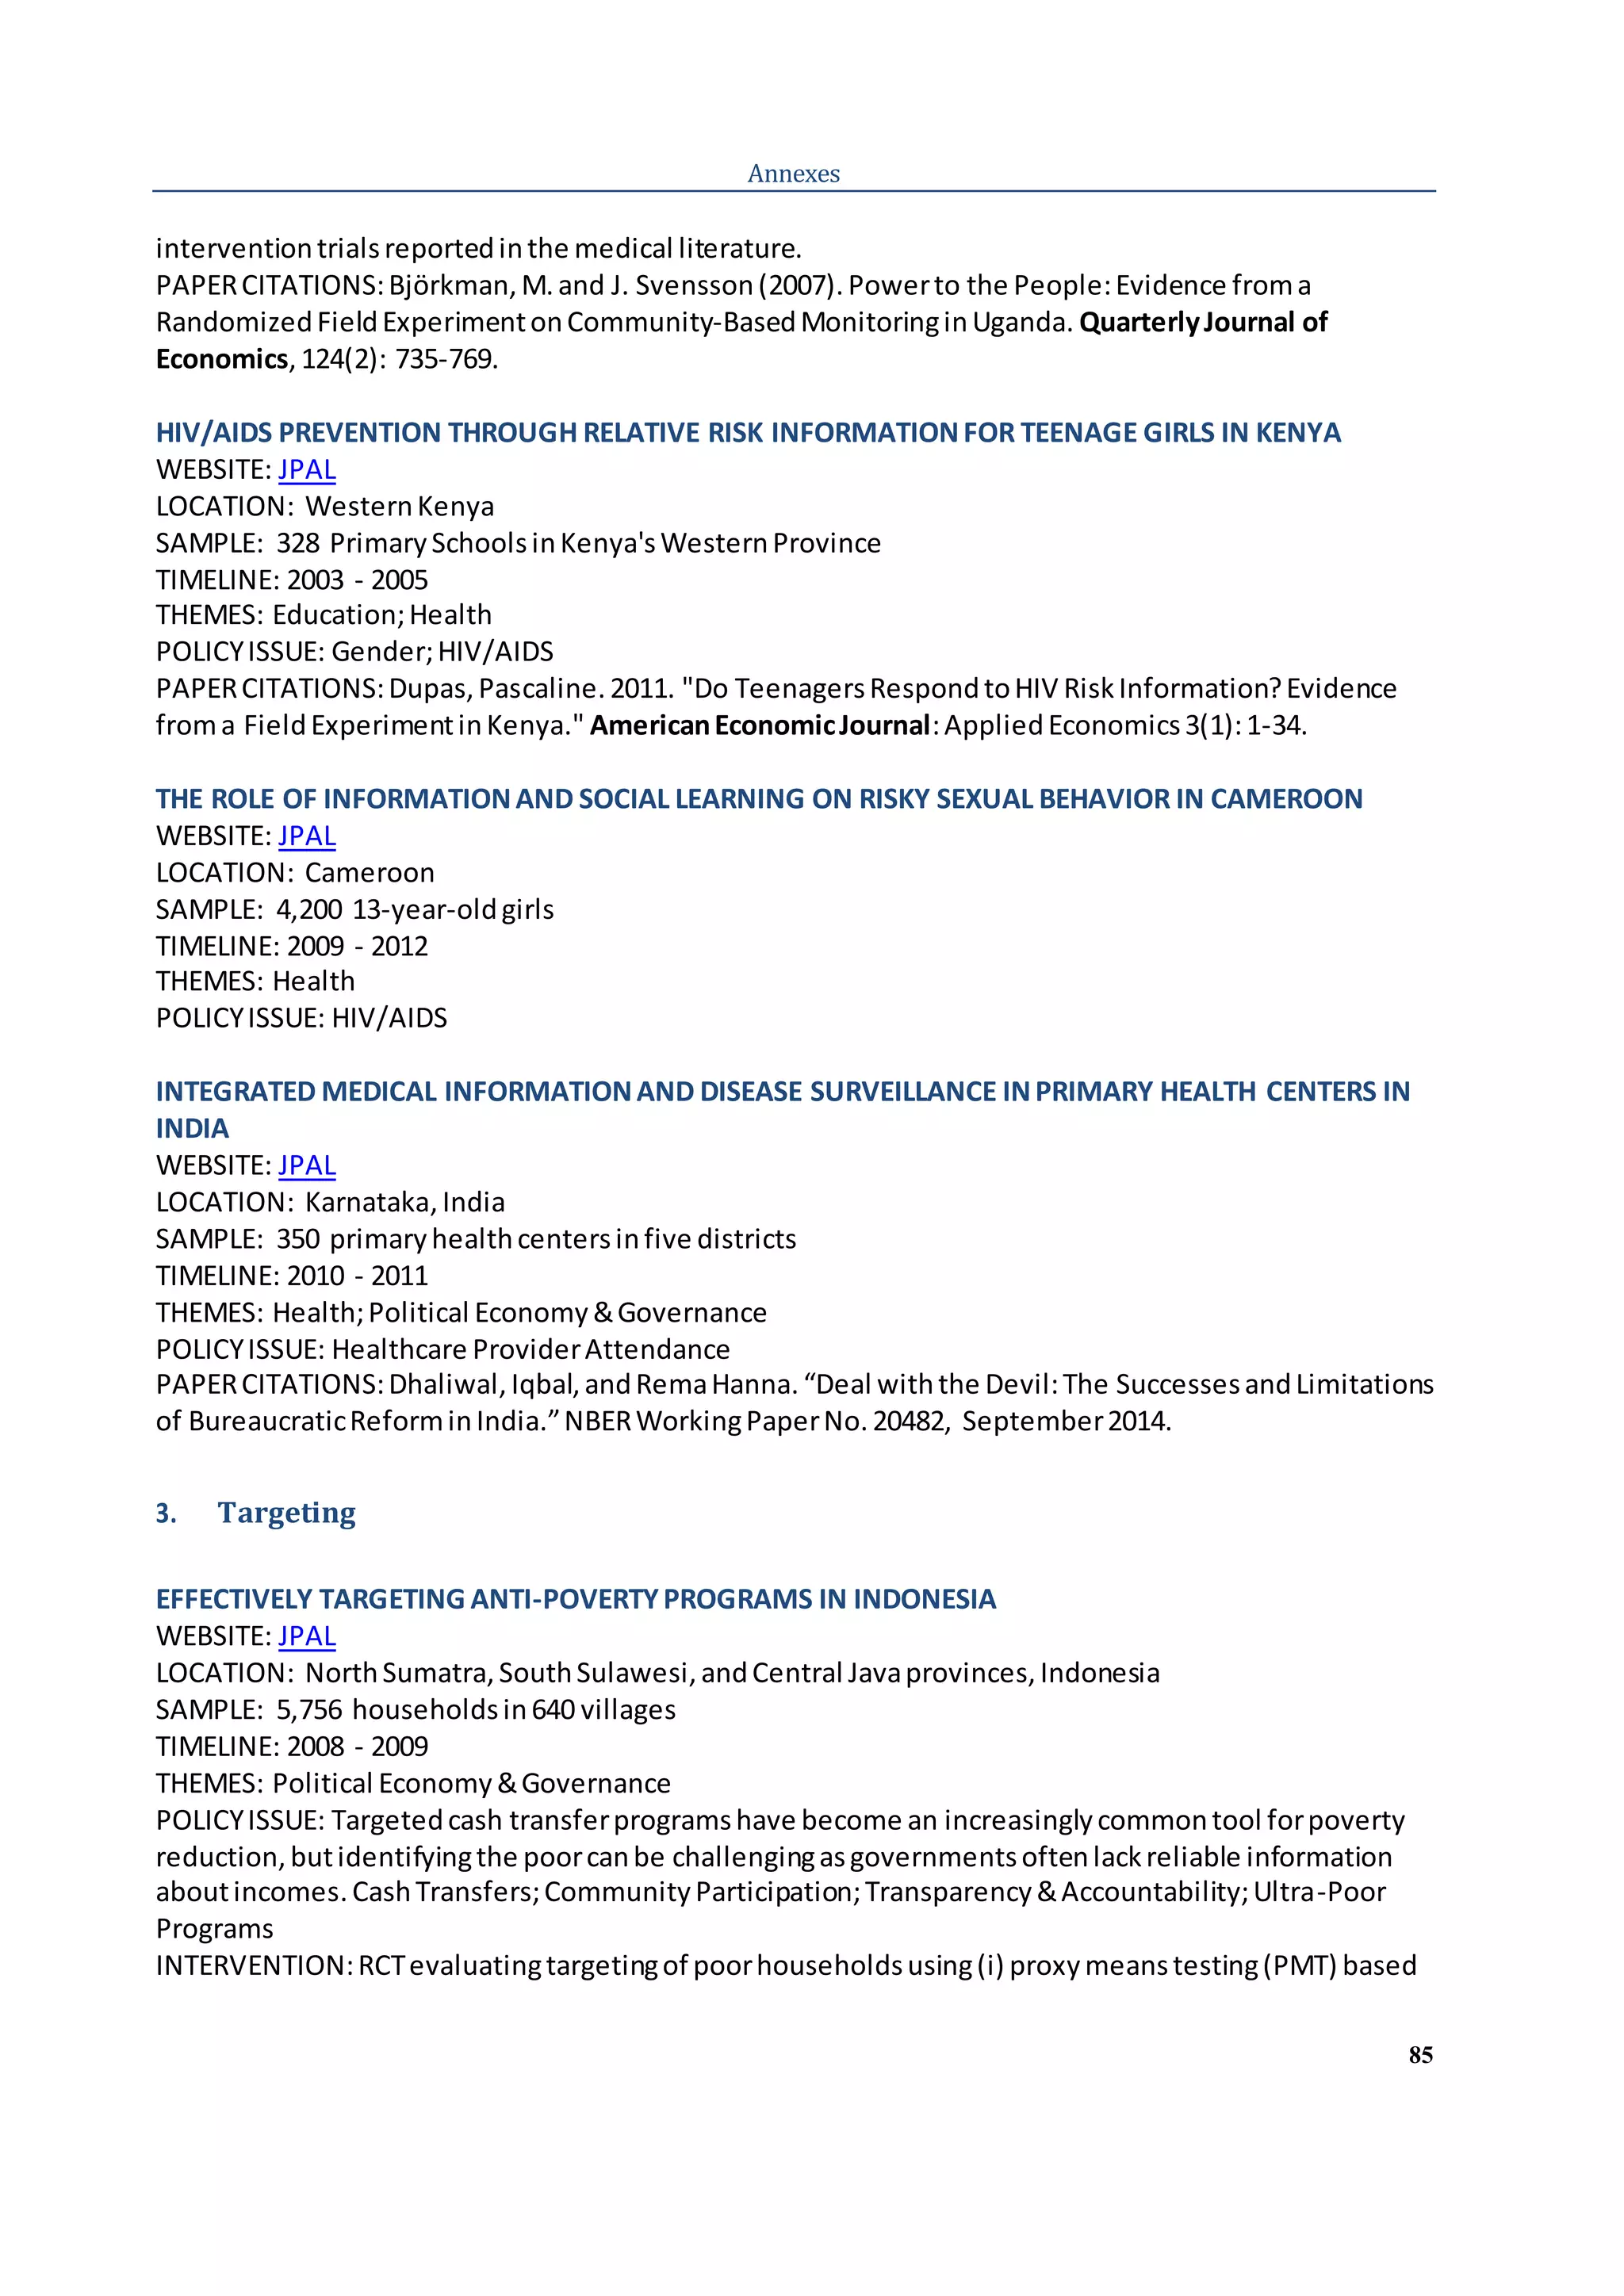
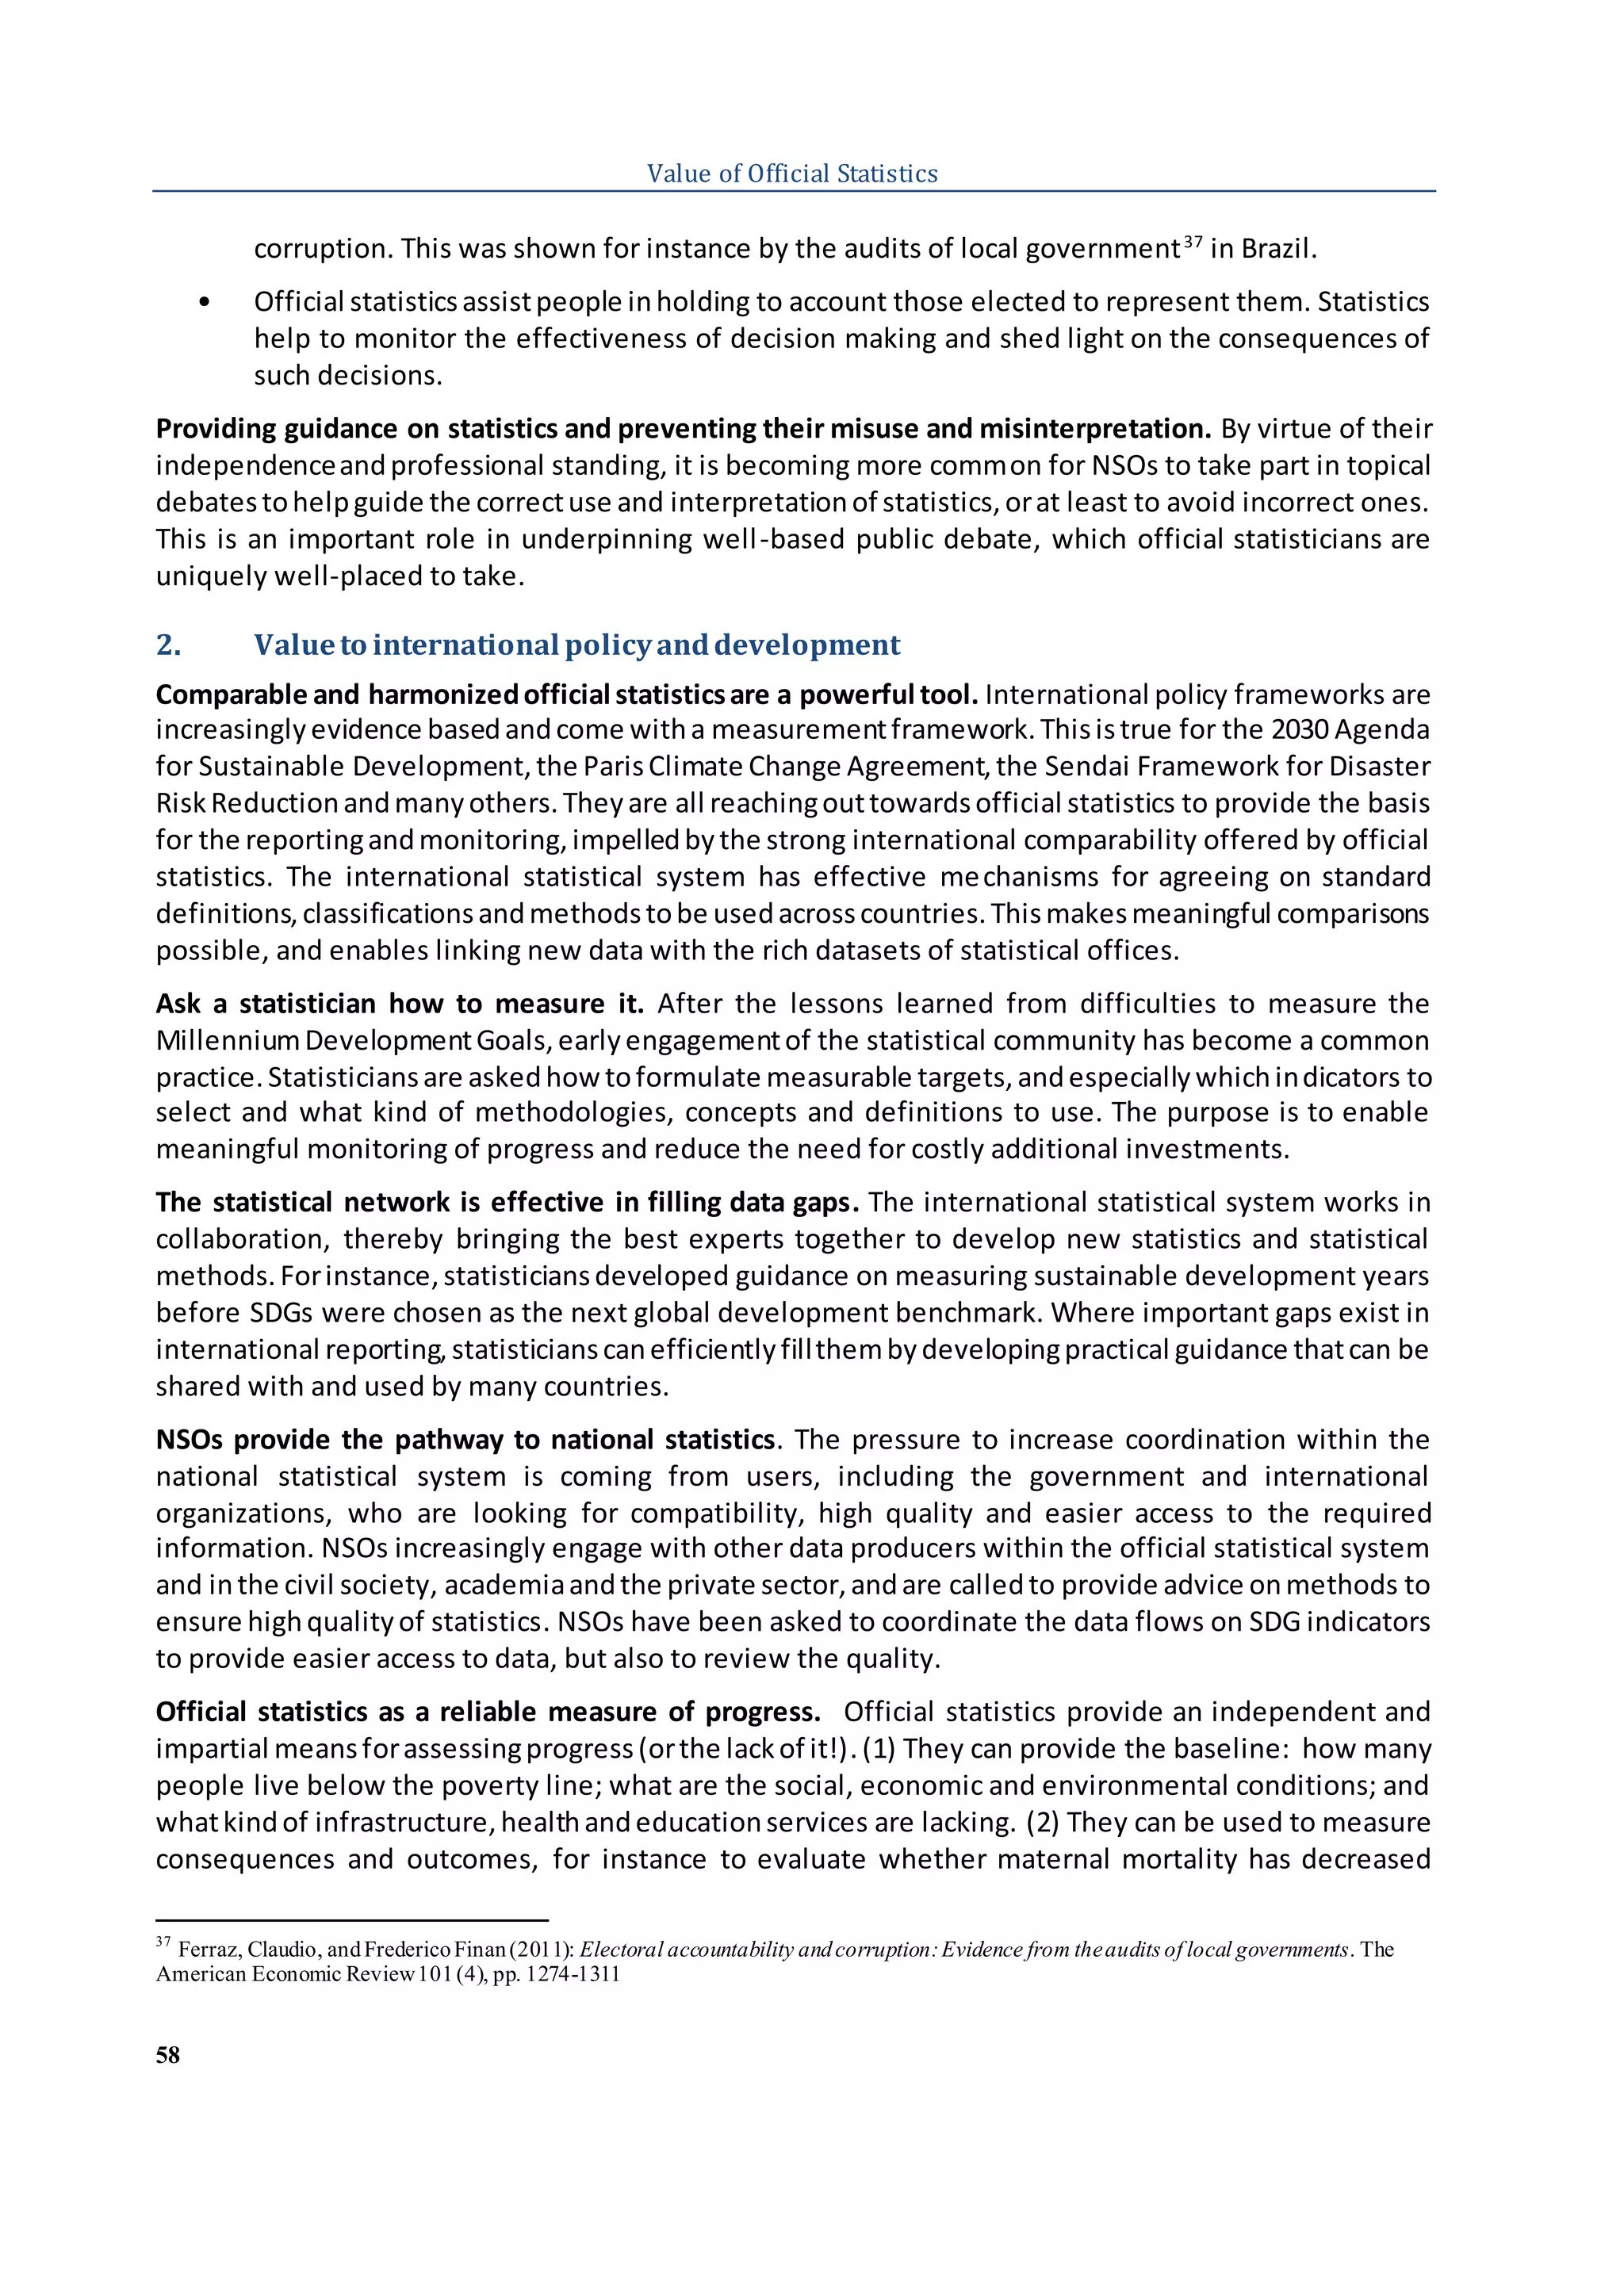
Annexes
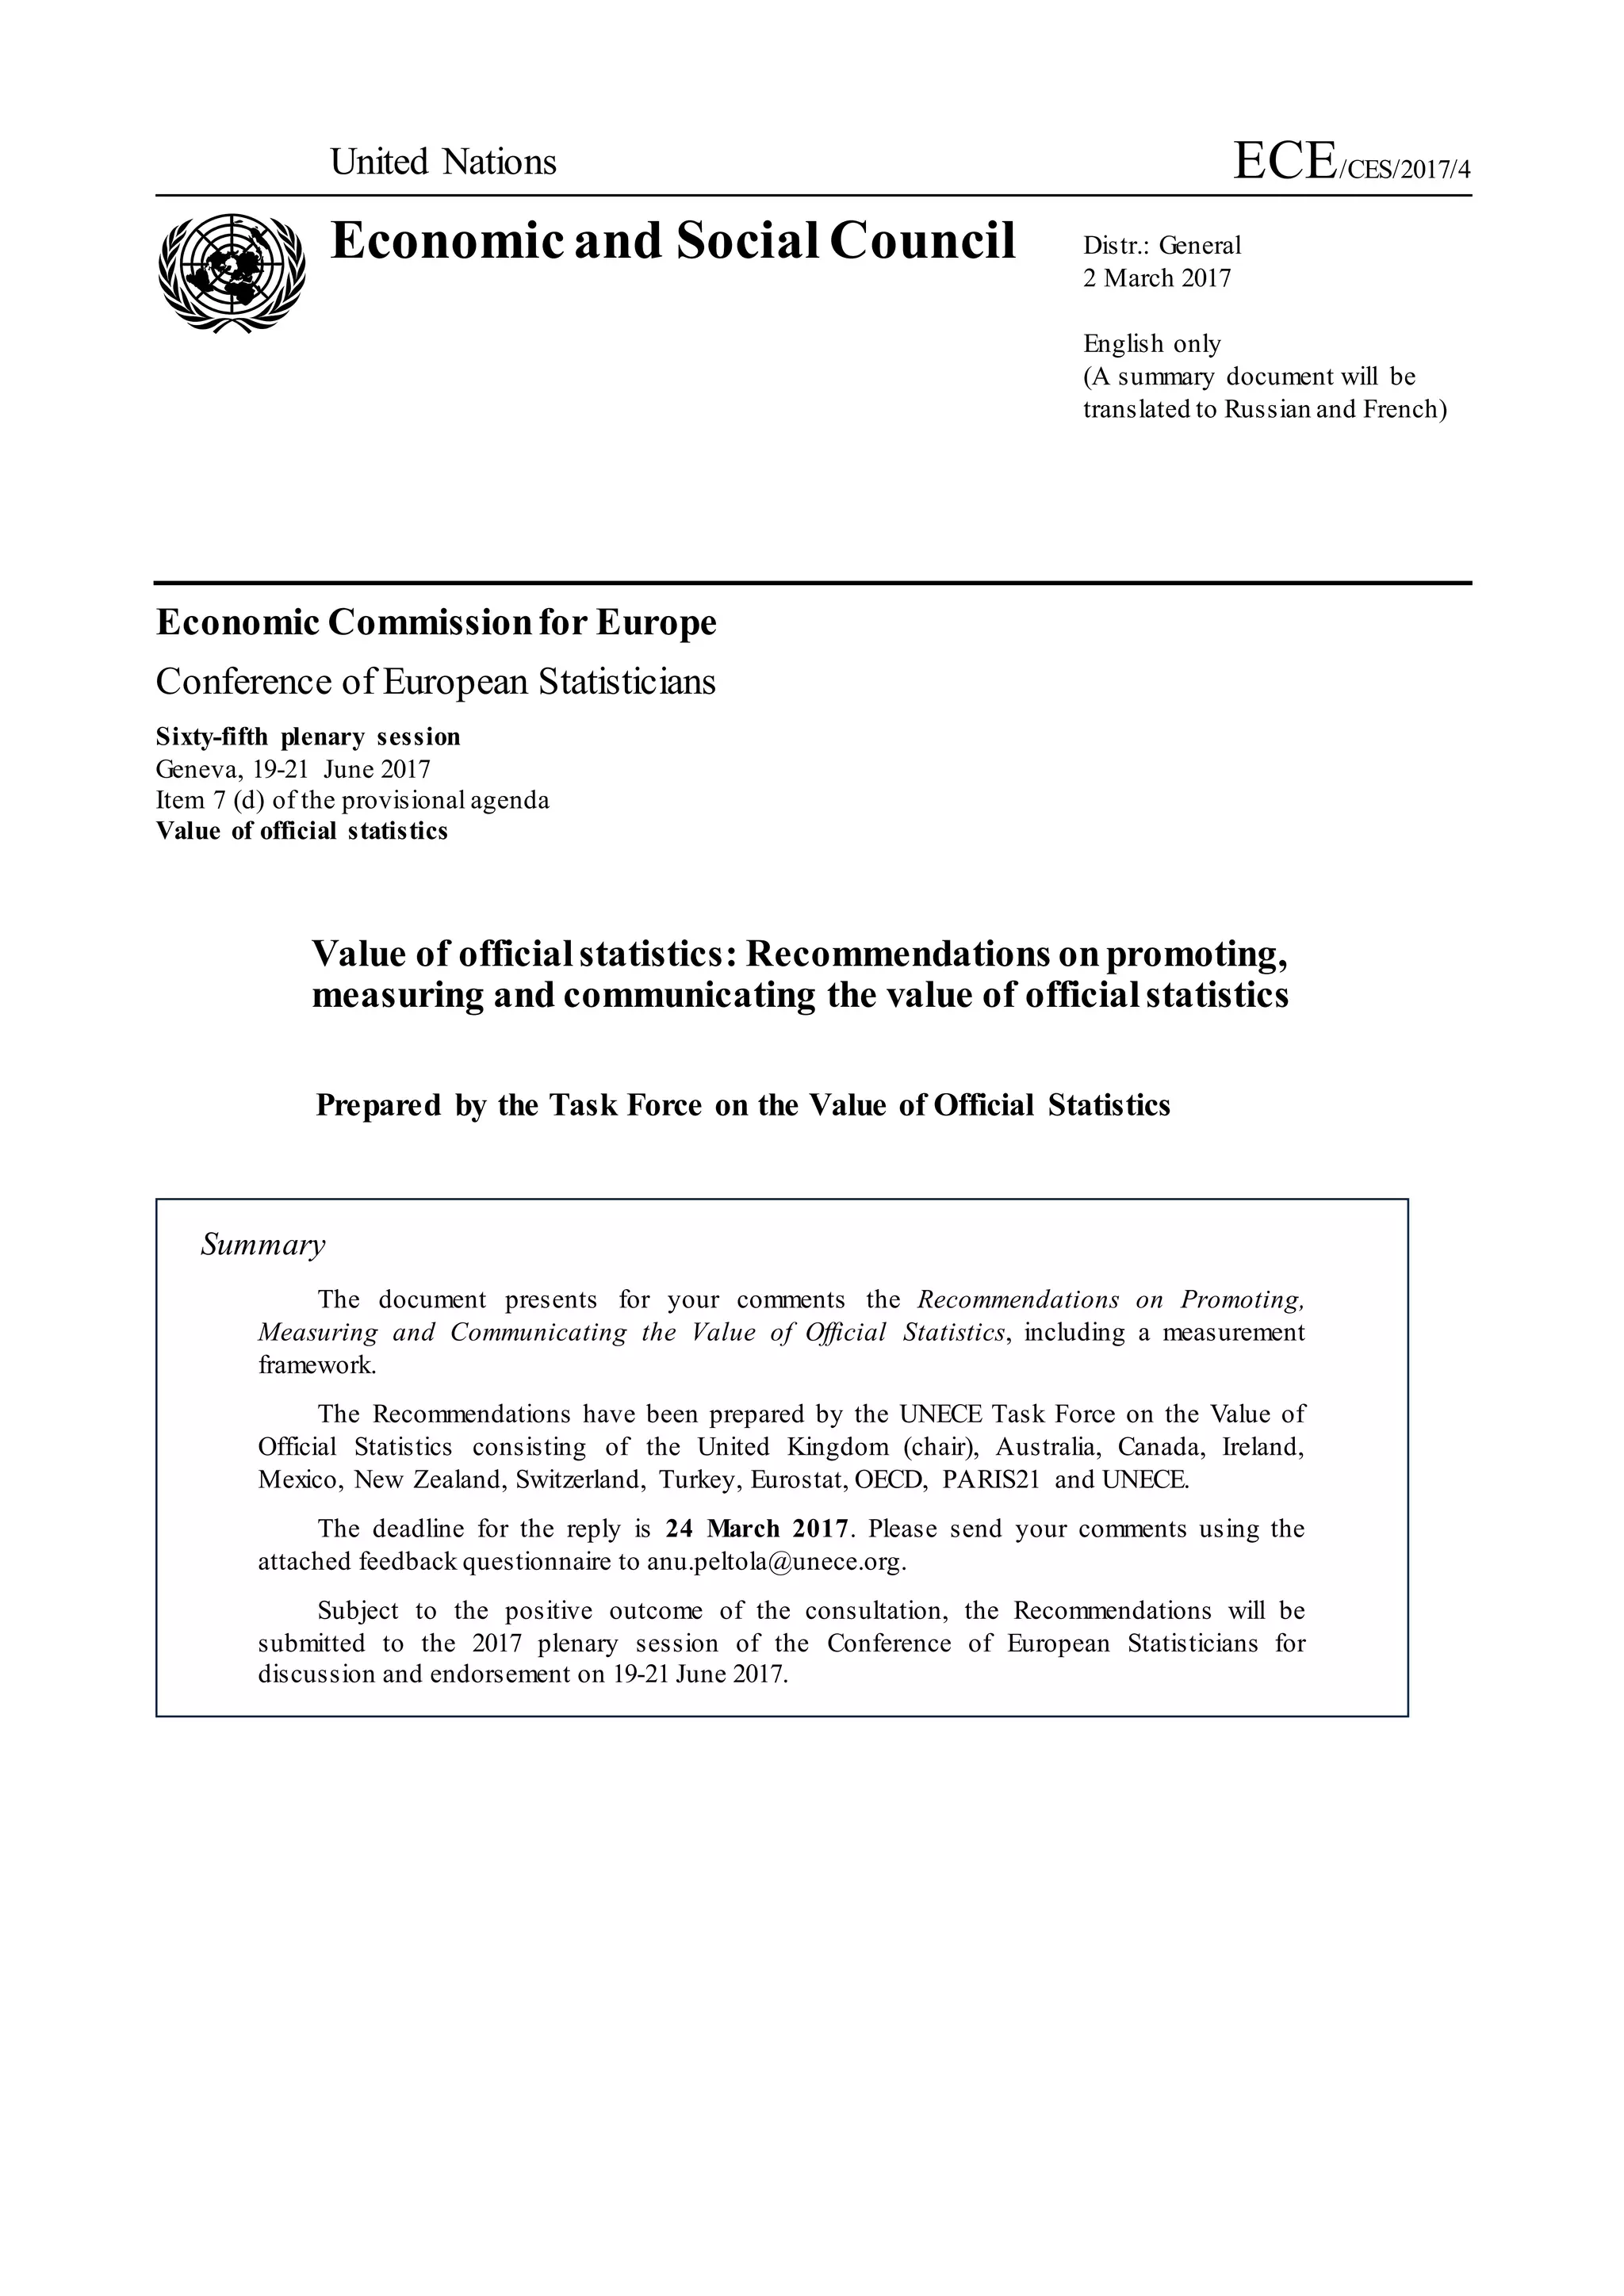
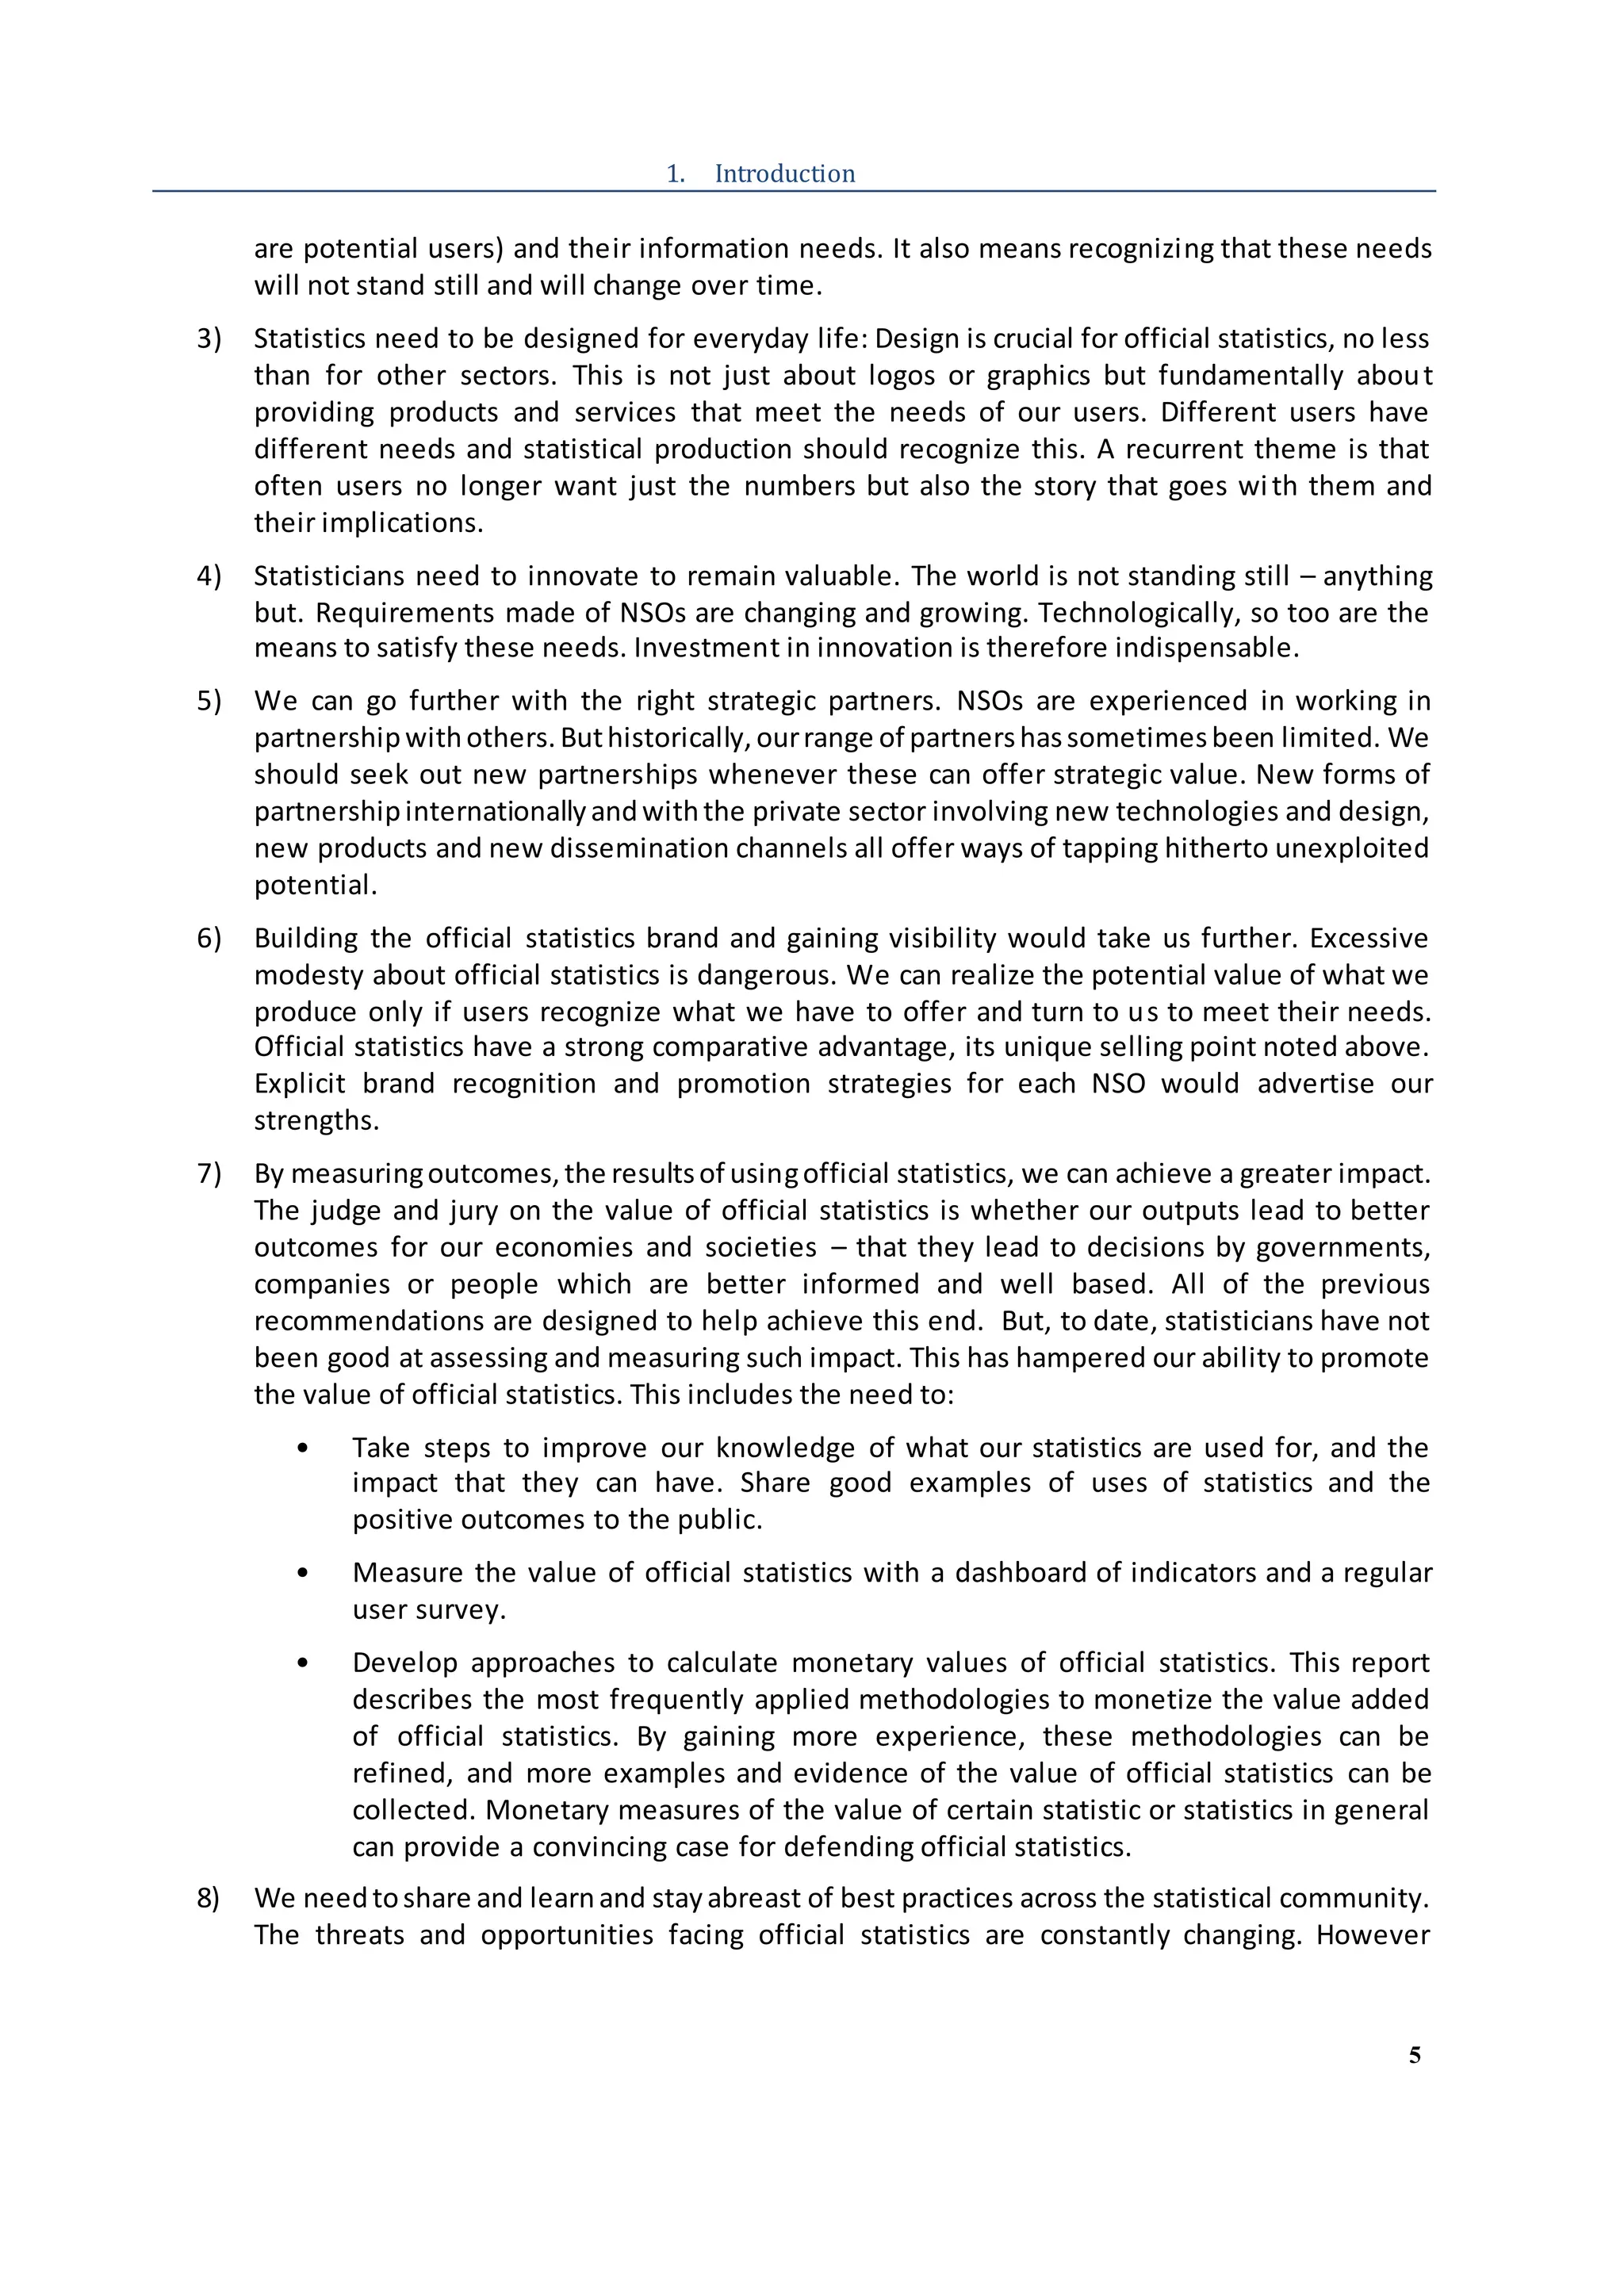
Annex 3 Generic user survey questions for statistical offices
Introductionto respondents:
Welcome to the User Survey of the National Statistical Office (NSO) [replace with a name of the
office]. The NSO is committed to compiling quality, independent, objective and trustworthy
official statistics.
Satisfaction of users is a priority for the NSO and our goal is to provide our users with the best
service required to meet their needs.
In order to help us find out whether we are satisfying your needs and expectations, we would
appreciate your help by taking a few moments to complete this survey. Your comments are
appreciated and will help us to learn about what we are doing well and what we need to do
better. Please be assured that your responses will be completely anonymous.
We appreciate your taking the time to participate in this survey which should take about xx
minutes to complete [replace with an estimate that takes into account the duration of the
national survey including common questions and specific national questions].
Please respond to all questions in each section which are relevant to you as a user of statistics.
You can submit your survey by [indicate how].
Thank you.
Optional usersurvey questions:
Characteristics of data users
1. Please tell us about you.
(We will notpublishanypersonal information.)
Age group Dropdownlist
Gender Female /Male
Highestlevel of educationattained Dropdownlist
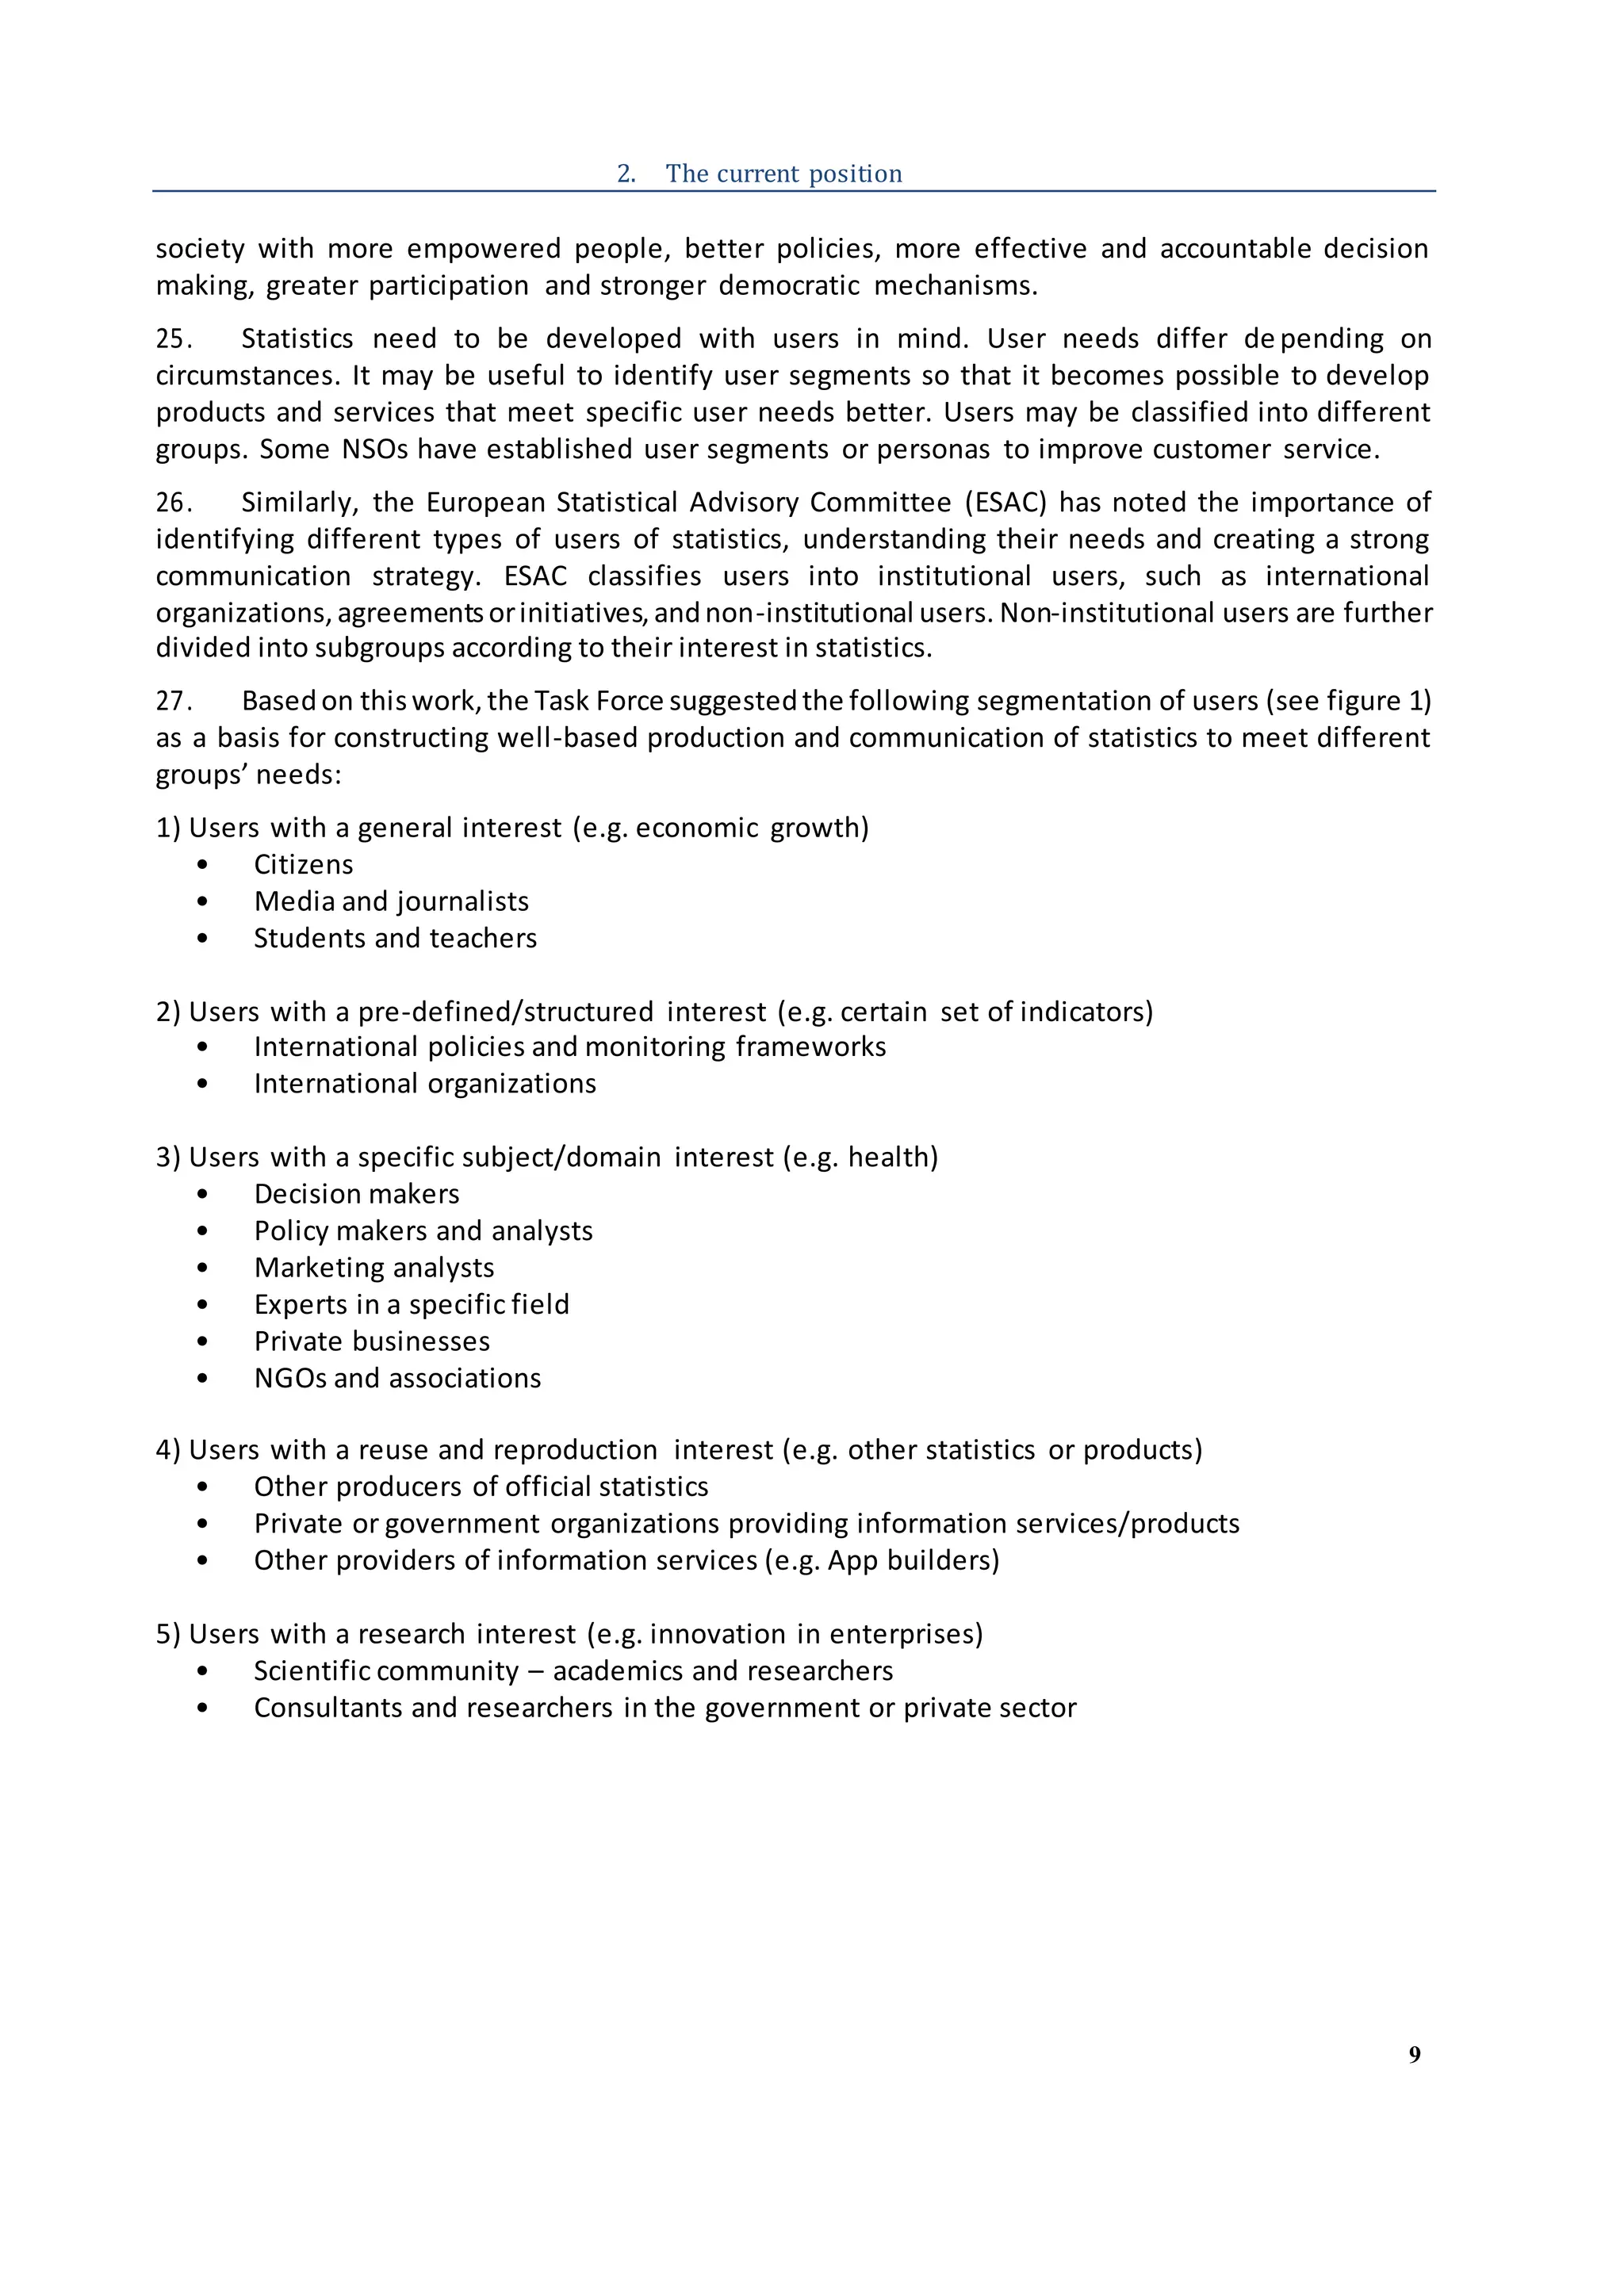
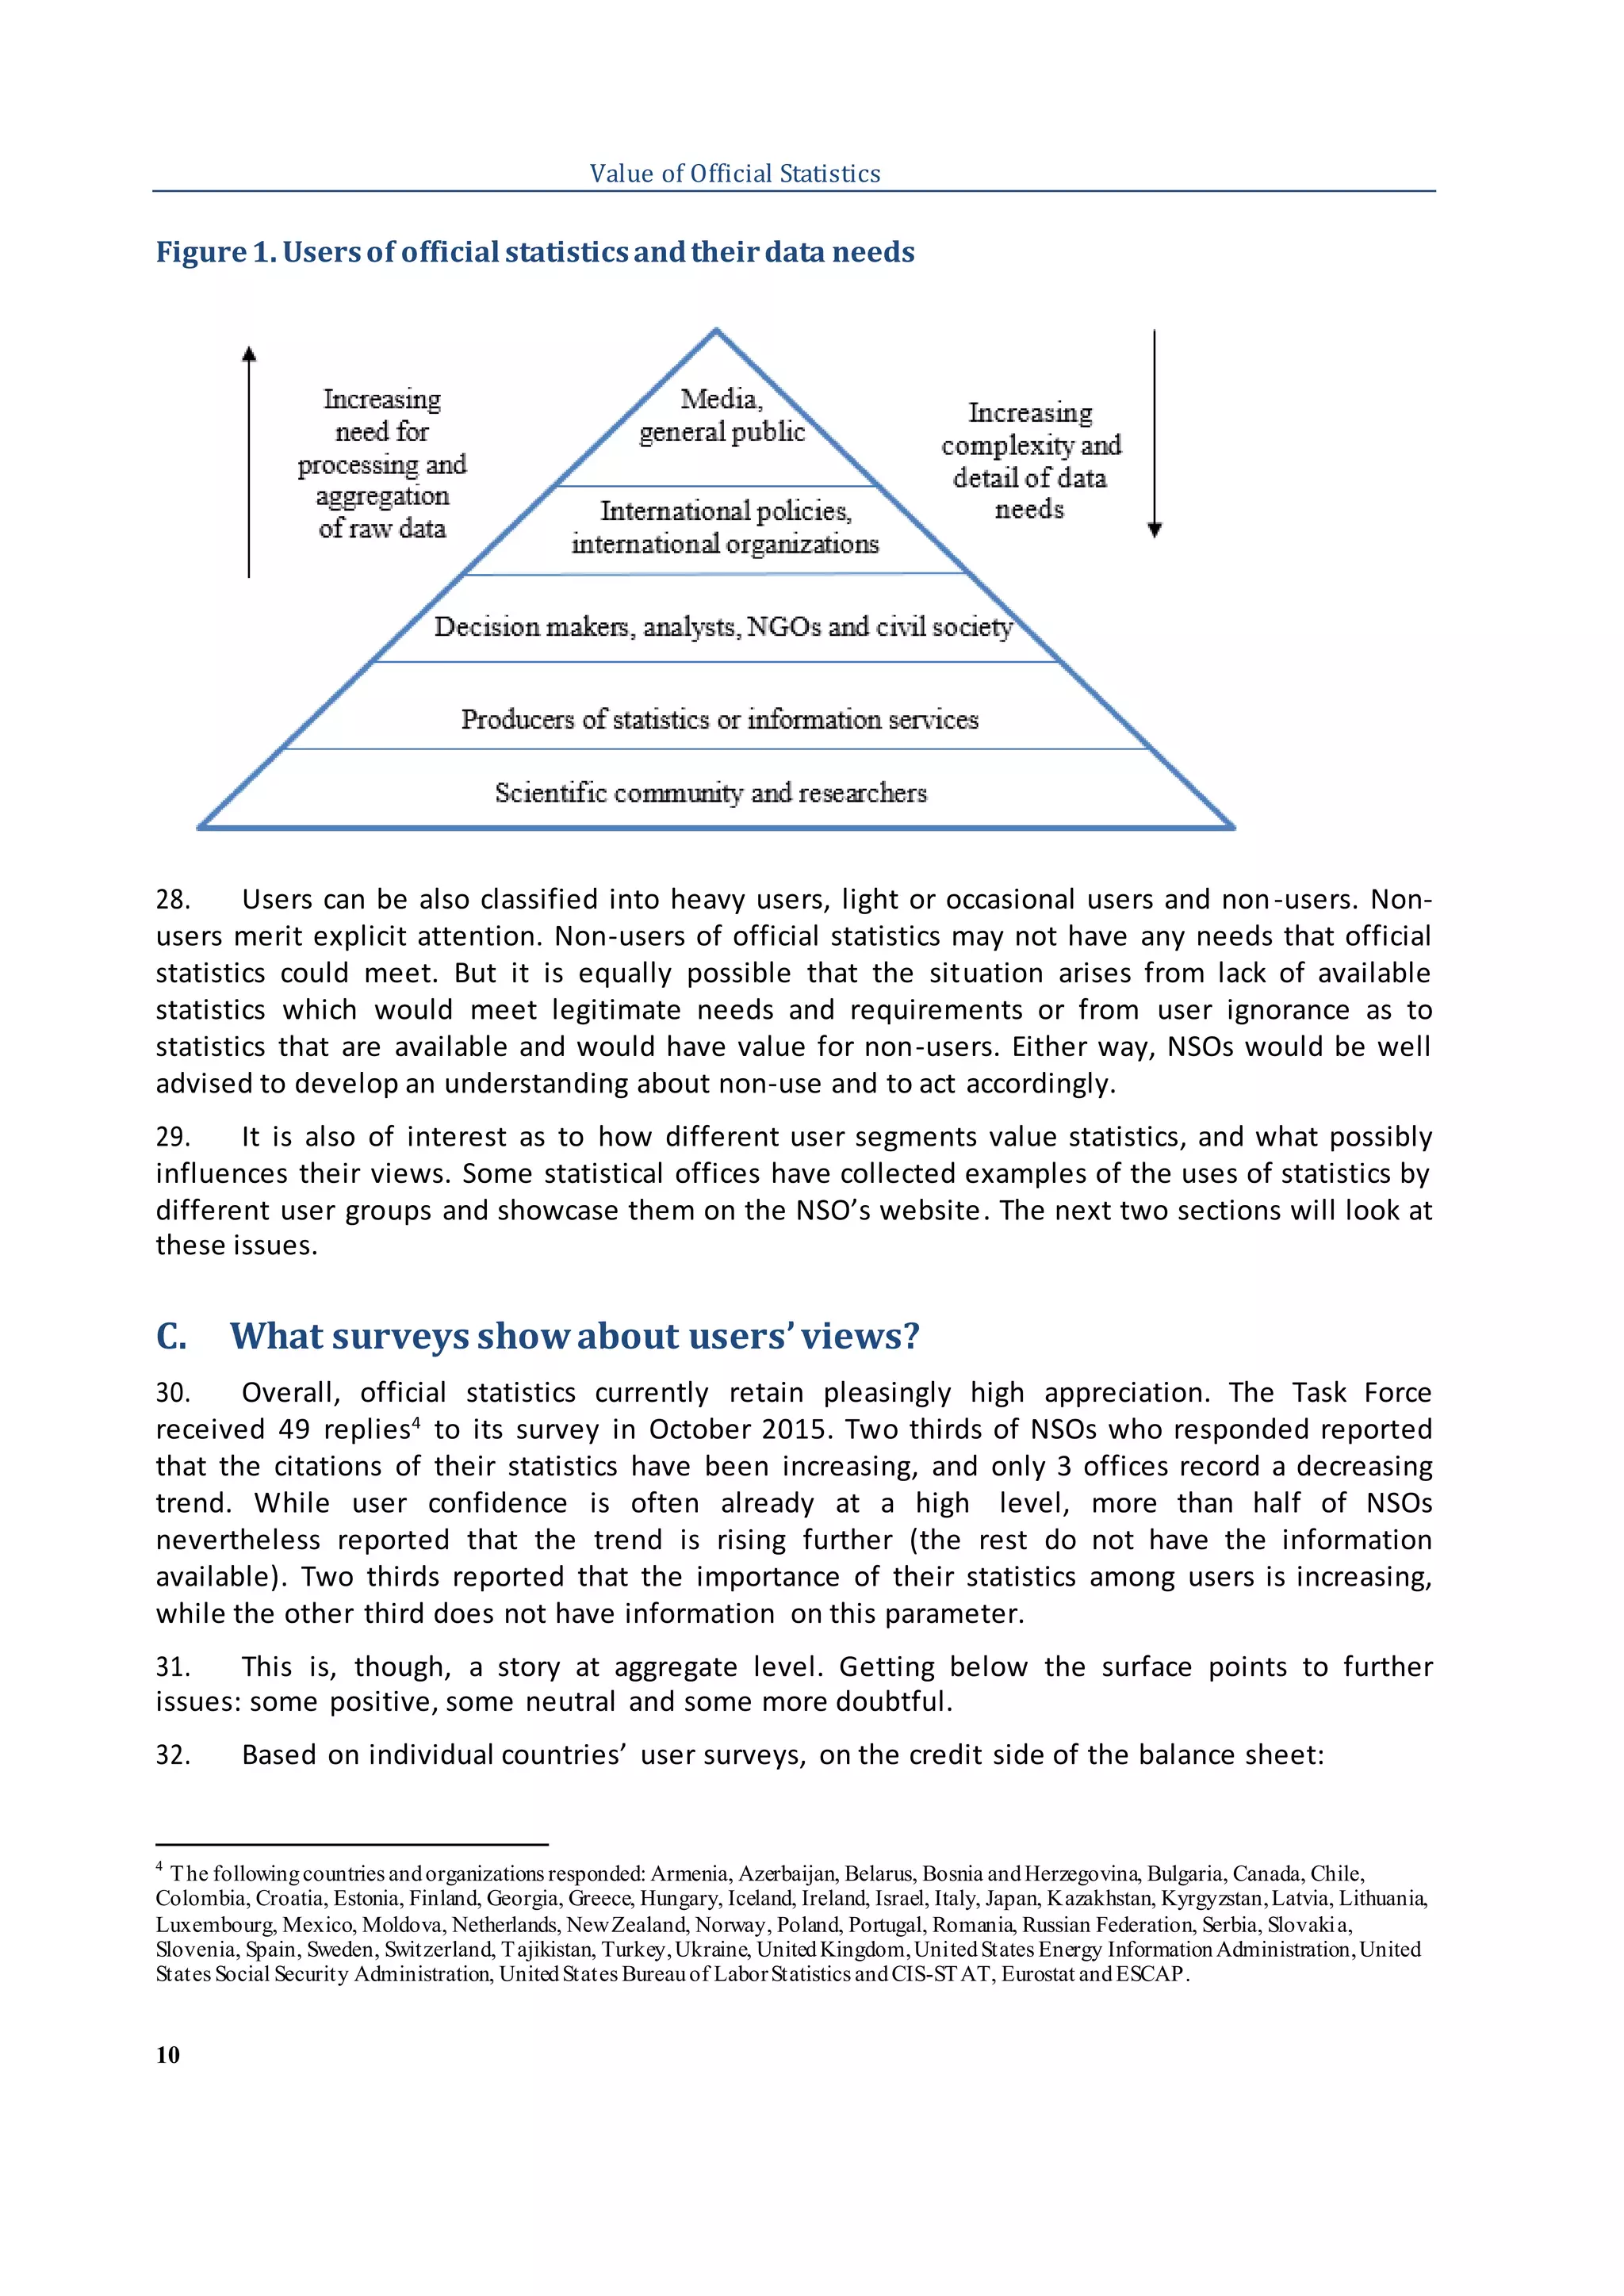
Sector/Industry Dropdownlist
Use of statistics
2. Whendidyou last contact the NSO or use its
statistics?
Dropdownlist
Academic or student
Central government
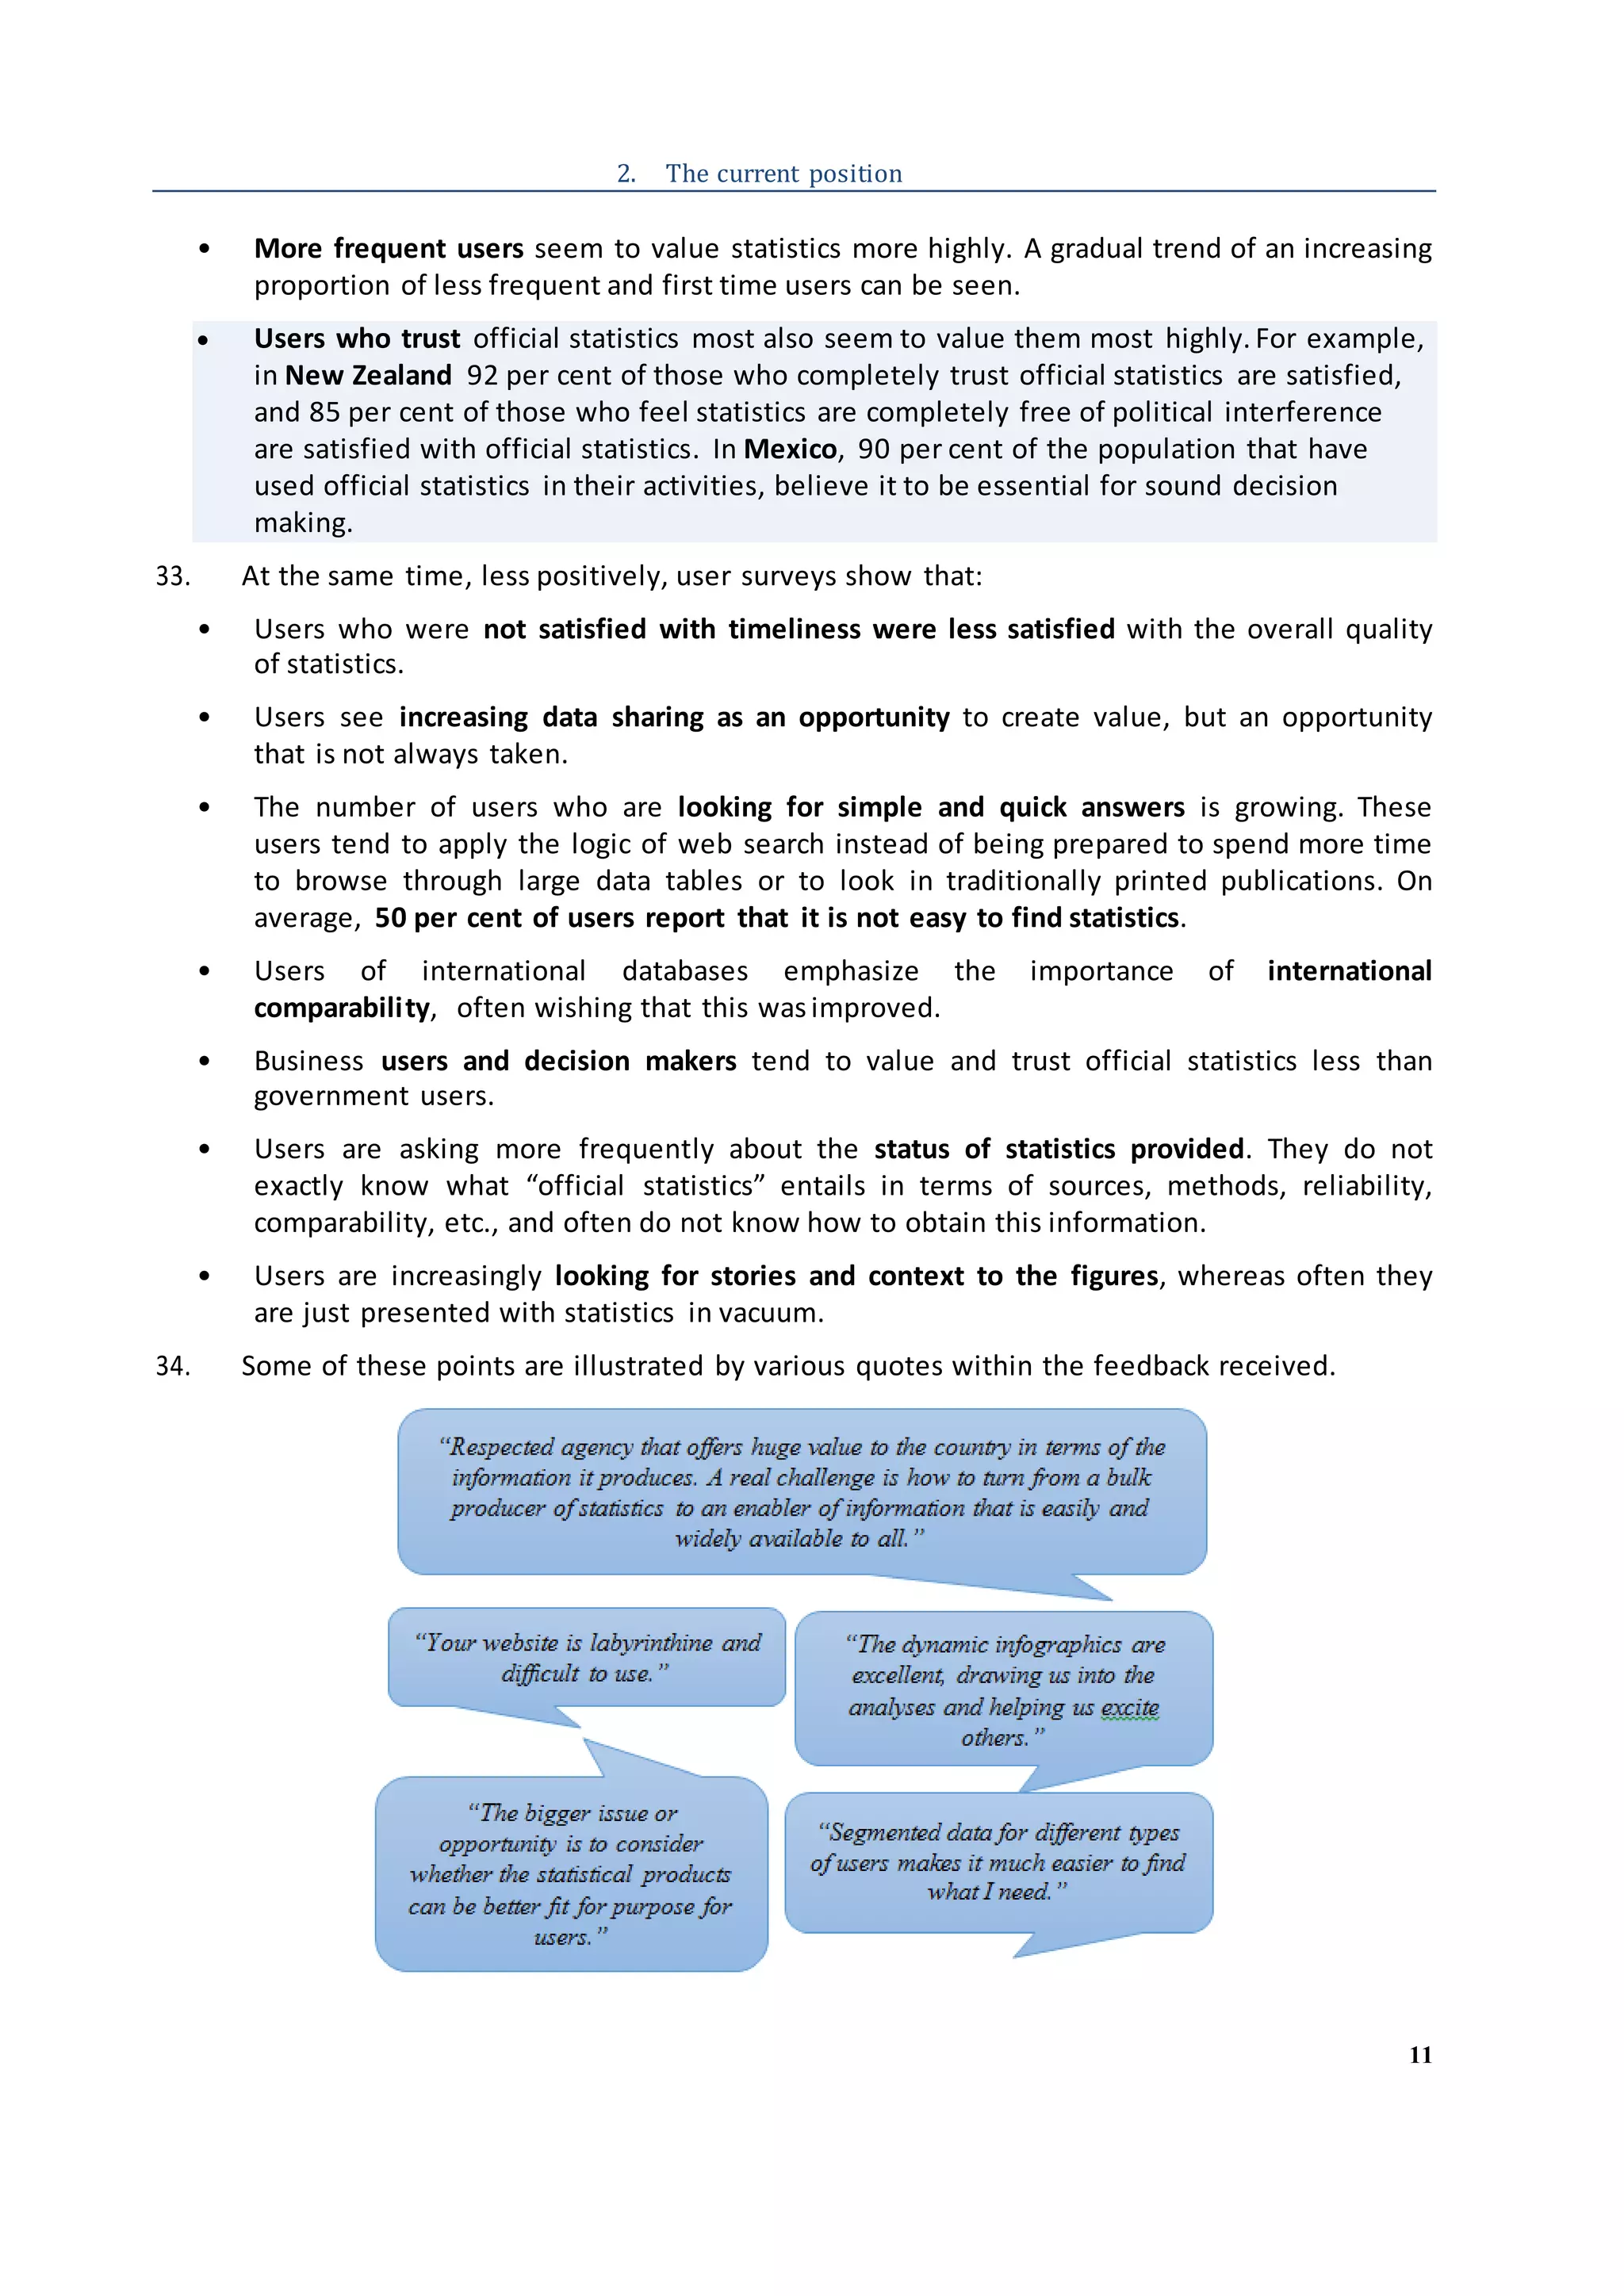
International organization
Local government
Media
Non-governmental organization
Political party or organization
Privatebusiness
Privateuser
Trade association
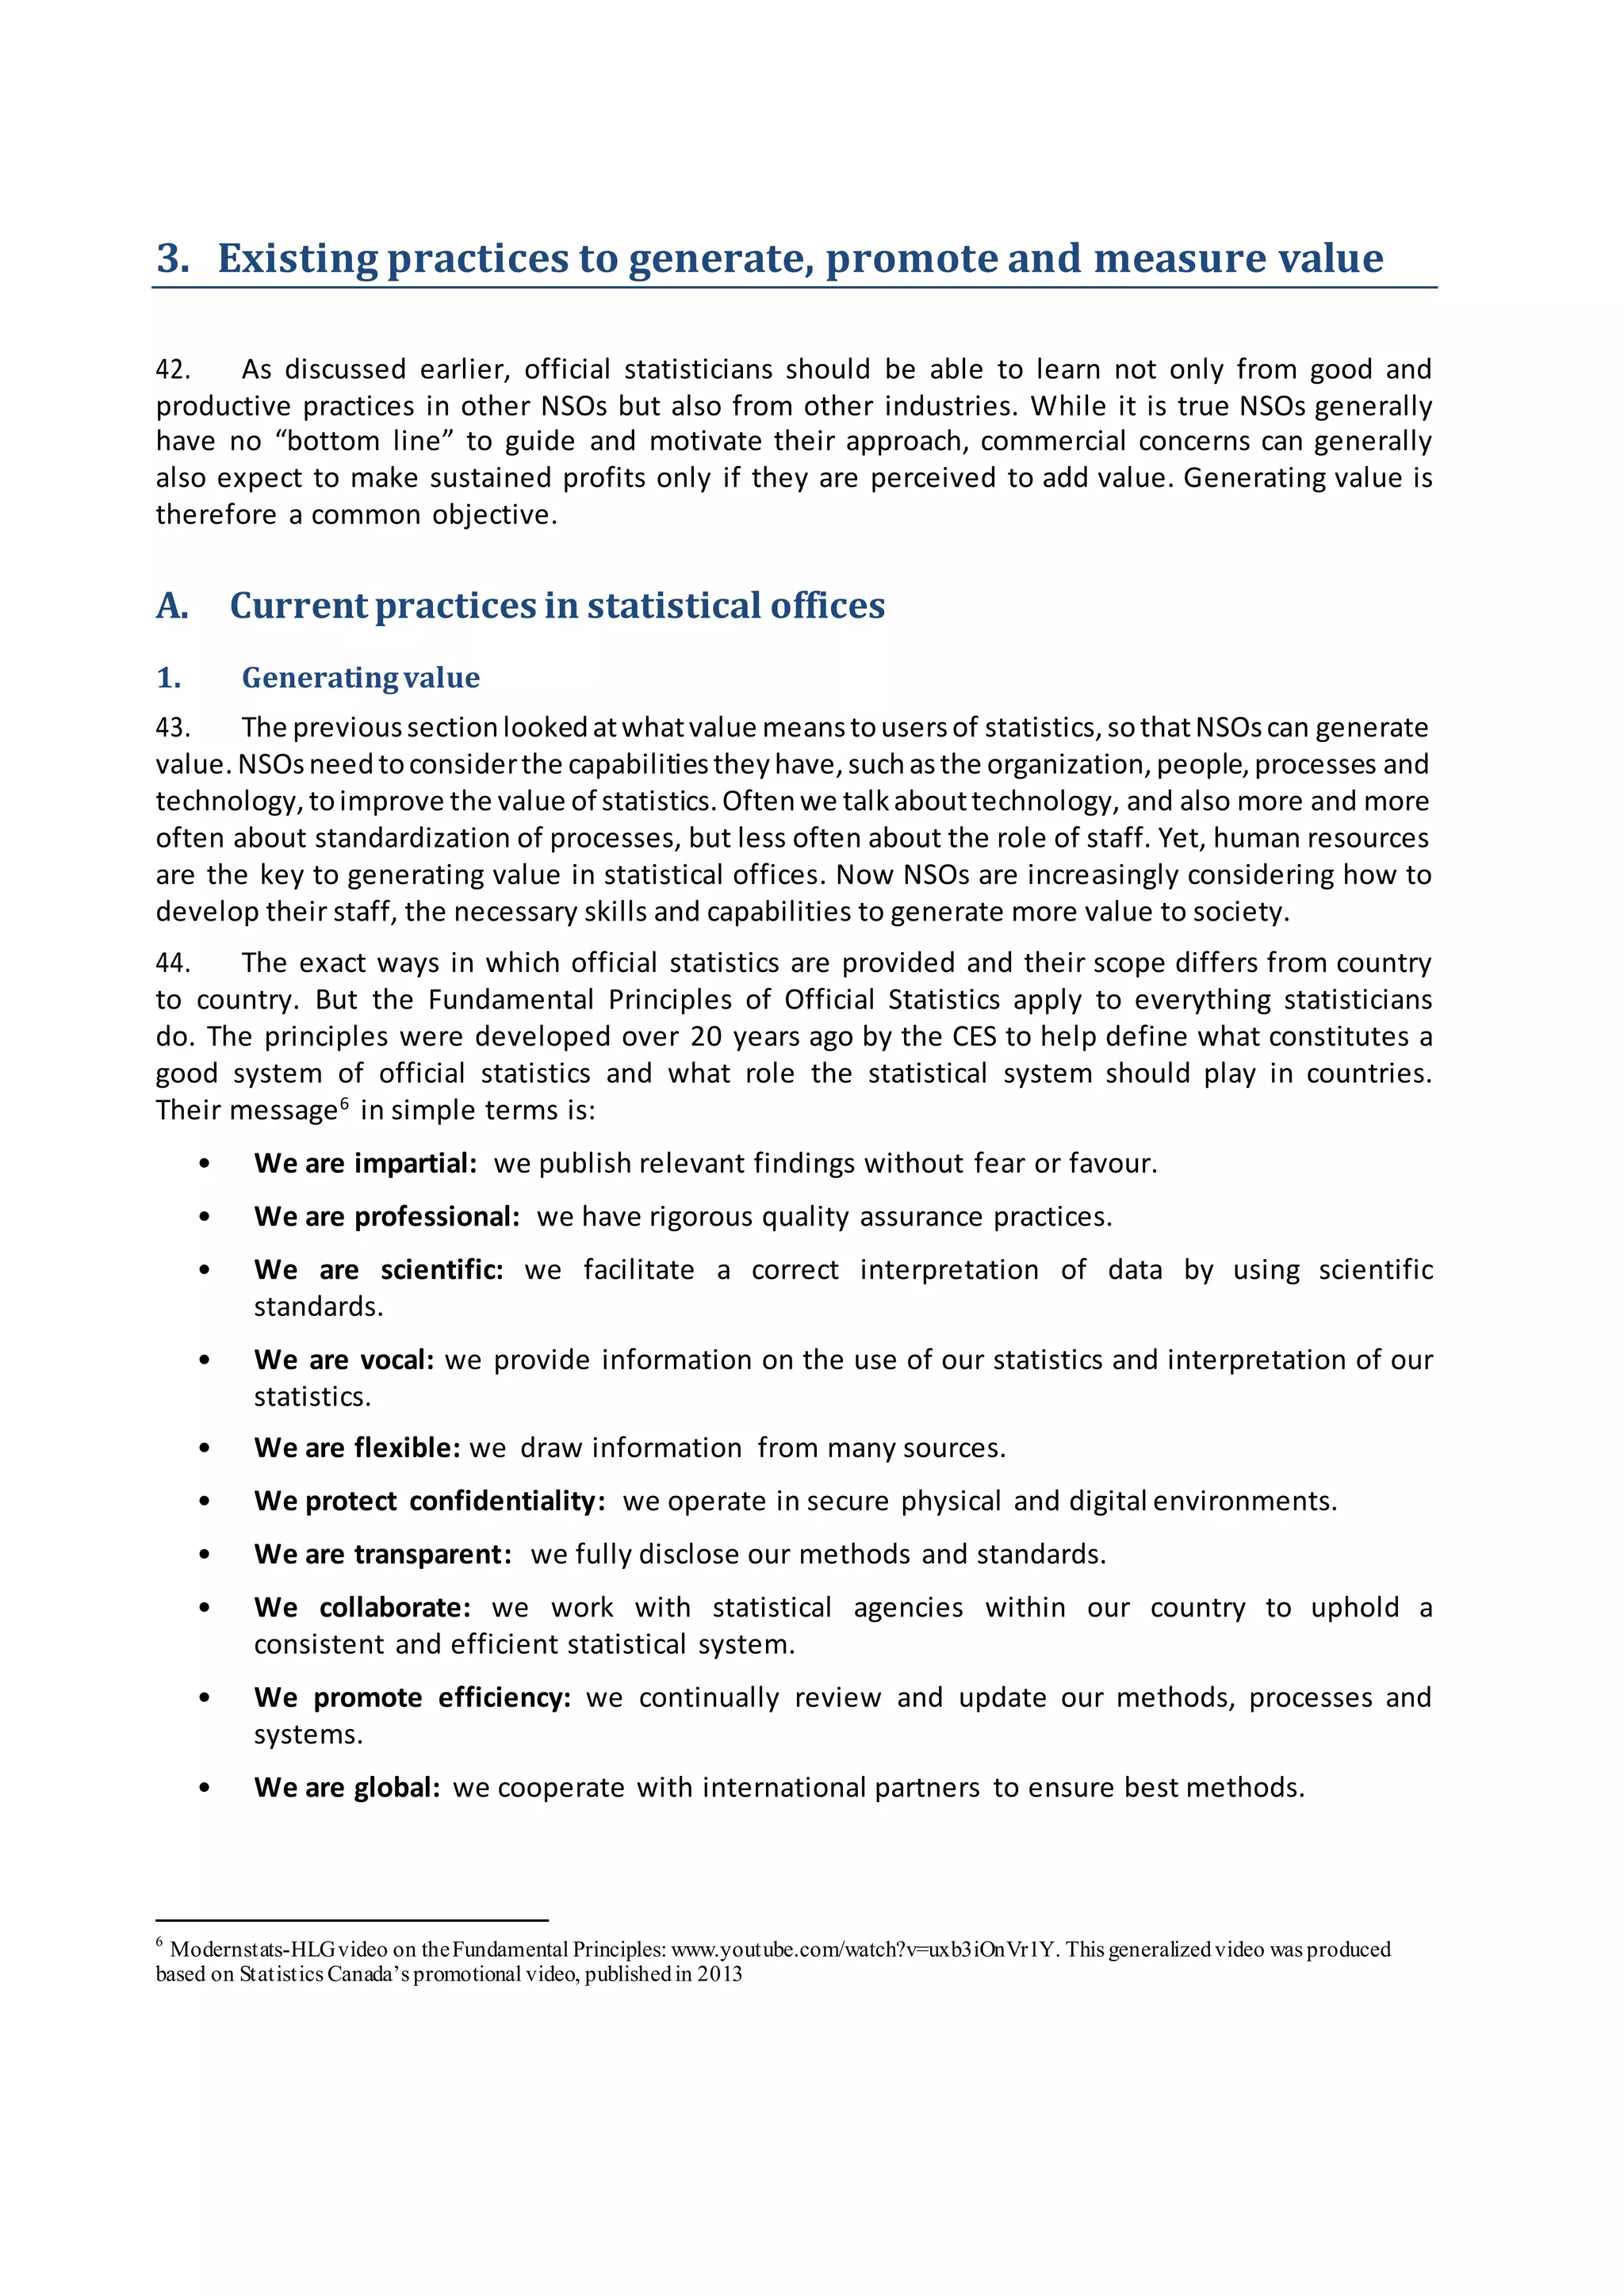
Other (pleasespecify)
[Replace dropdown lists with
nationally relevantversions.]
Primary school
High school
College
Master’s degree
Doctorate
Other (pleasespecify)
Earlier today
Yesterday
2-3 days ago
About a week ago
2-3 weeks ago
About a month ago
2-3 months ago
4 months or more
I have never been in touch with the
NSO](https://image.slidesharecdn.com/ces04-valueofofficialstatistics-170406131350/75/Value-of-official-statistics-Recommendations-on-promoting-measuring-and-communicating-the-value-of-official-statistics-63-2048.jpg)
![64
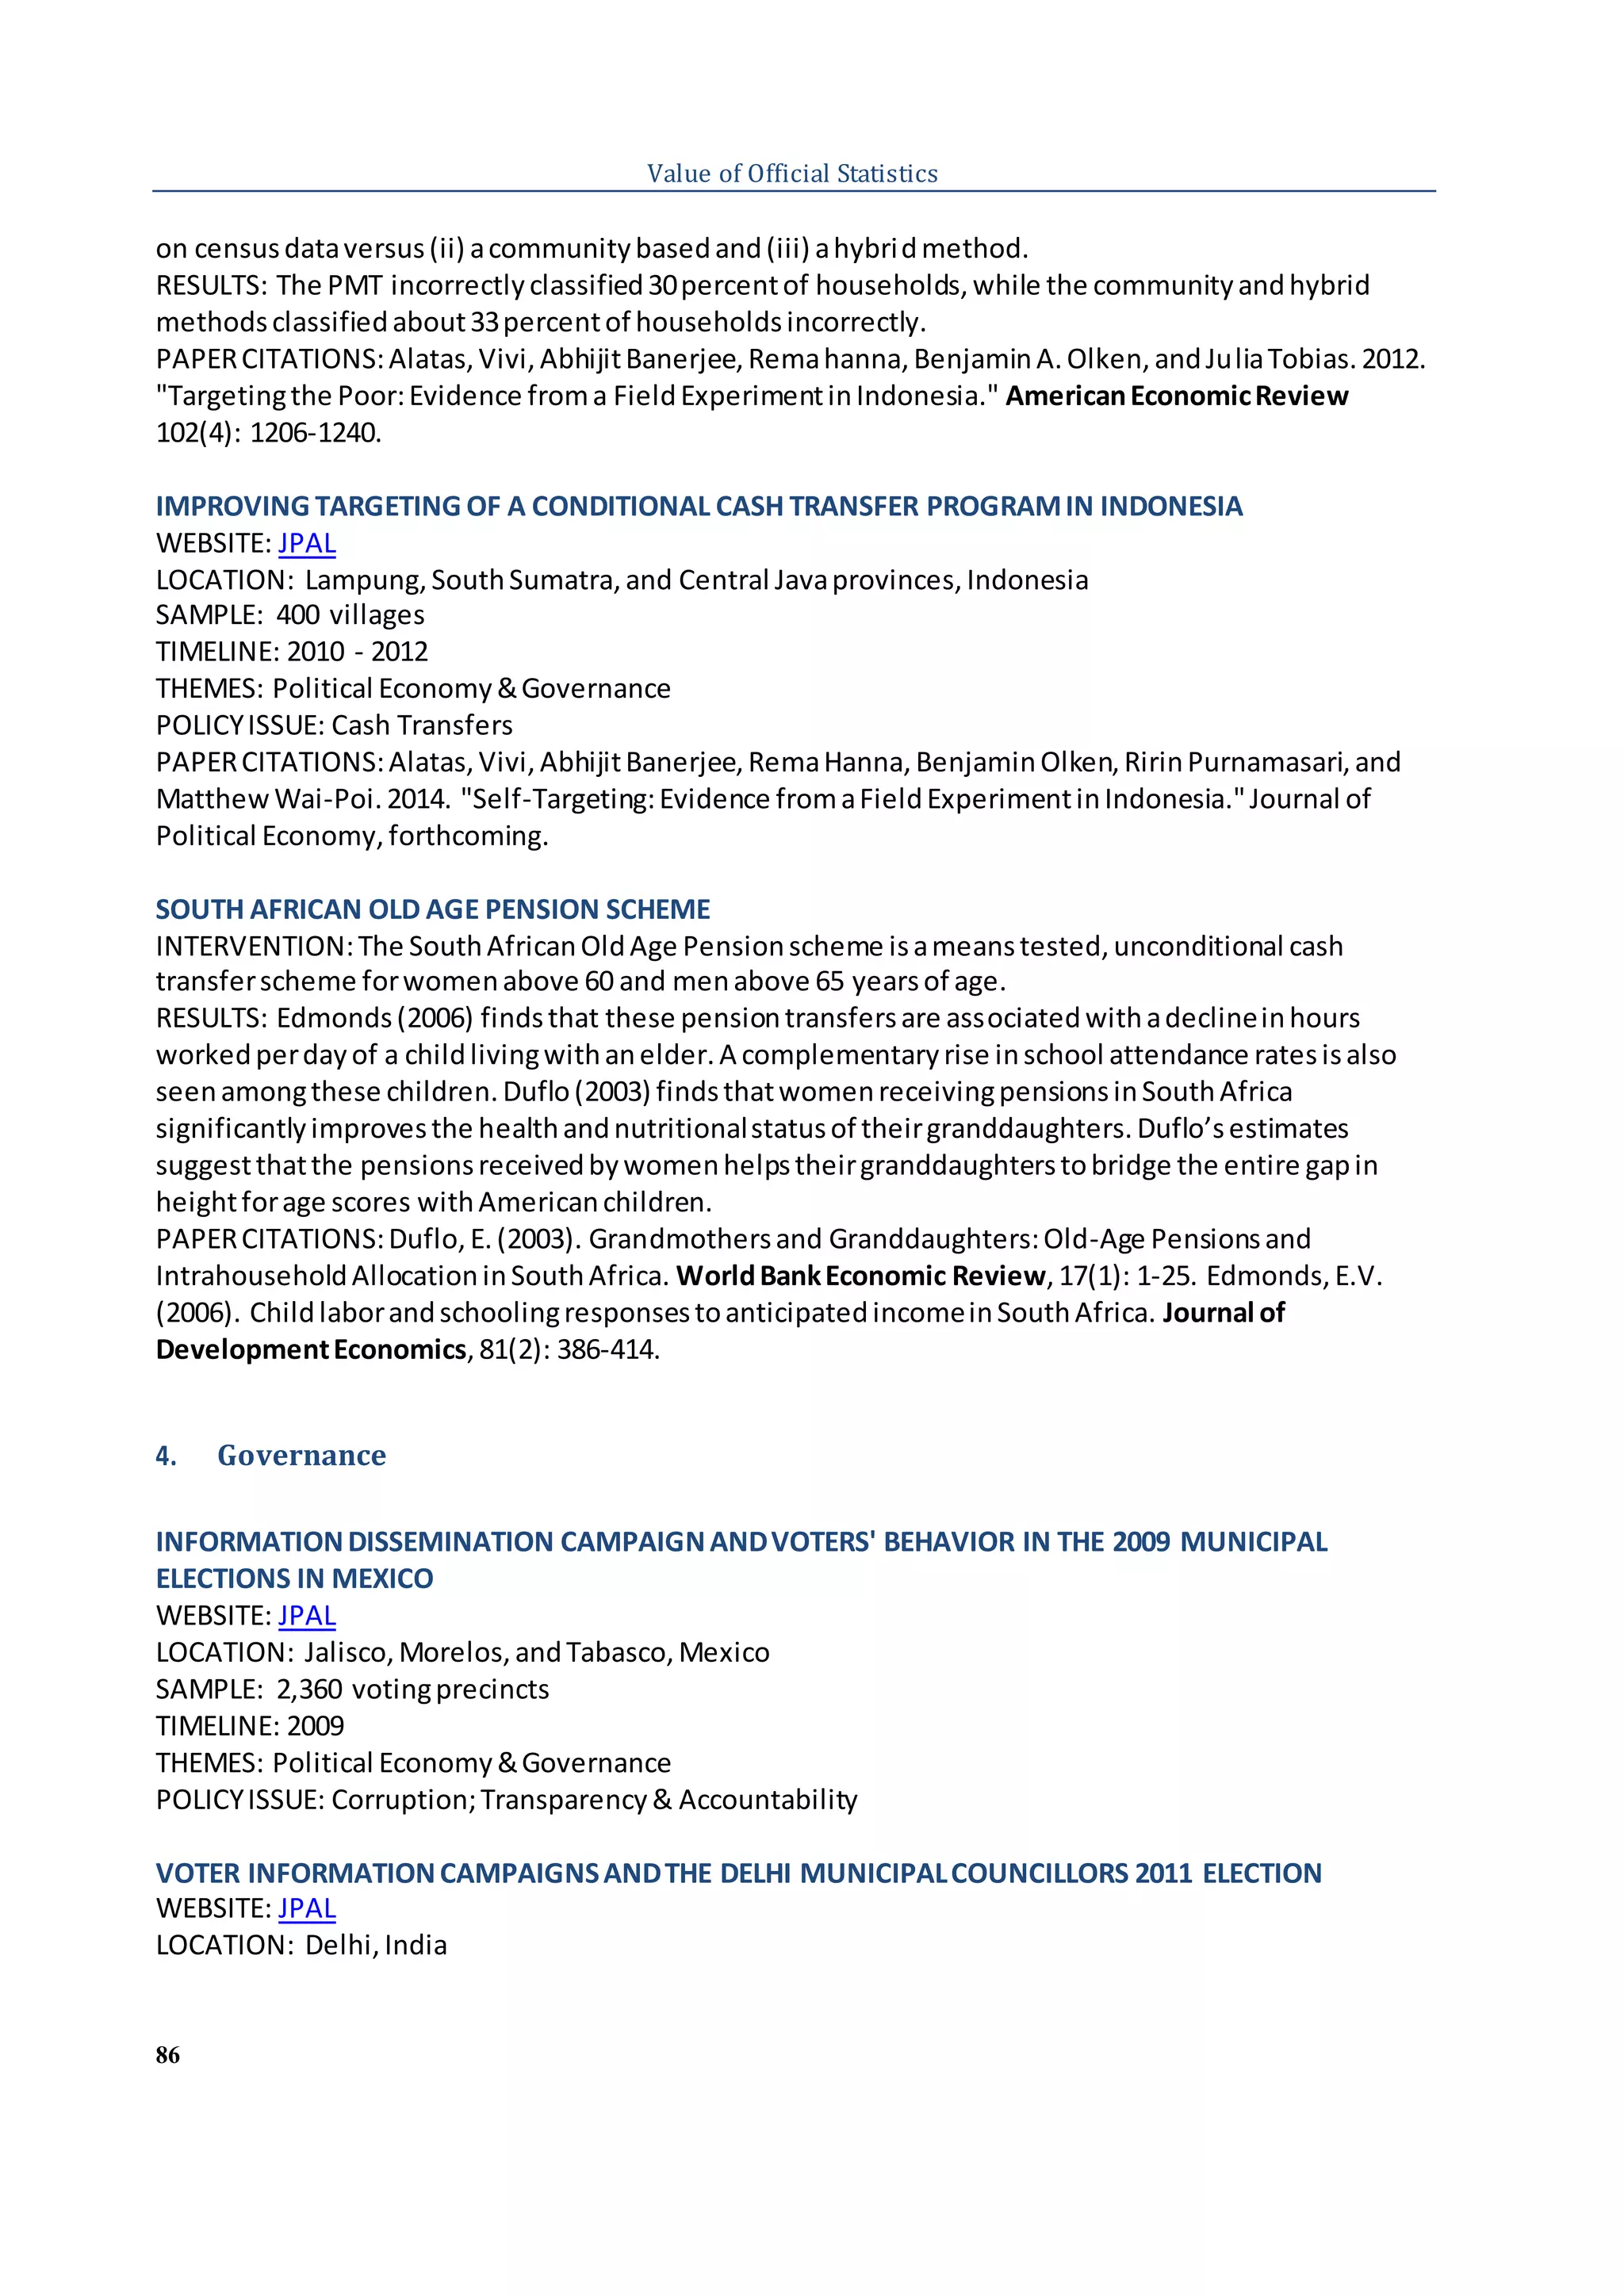
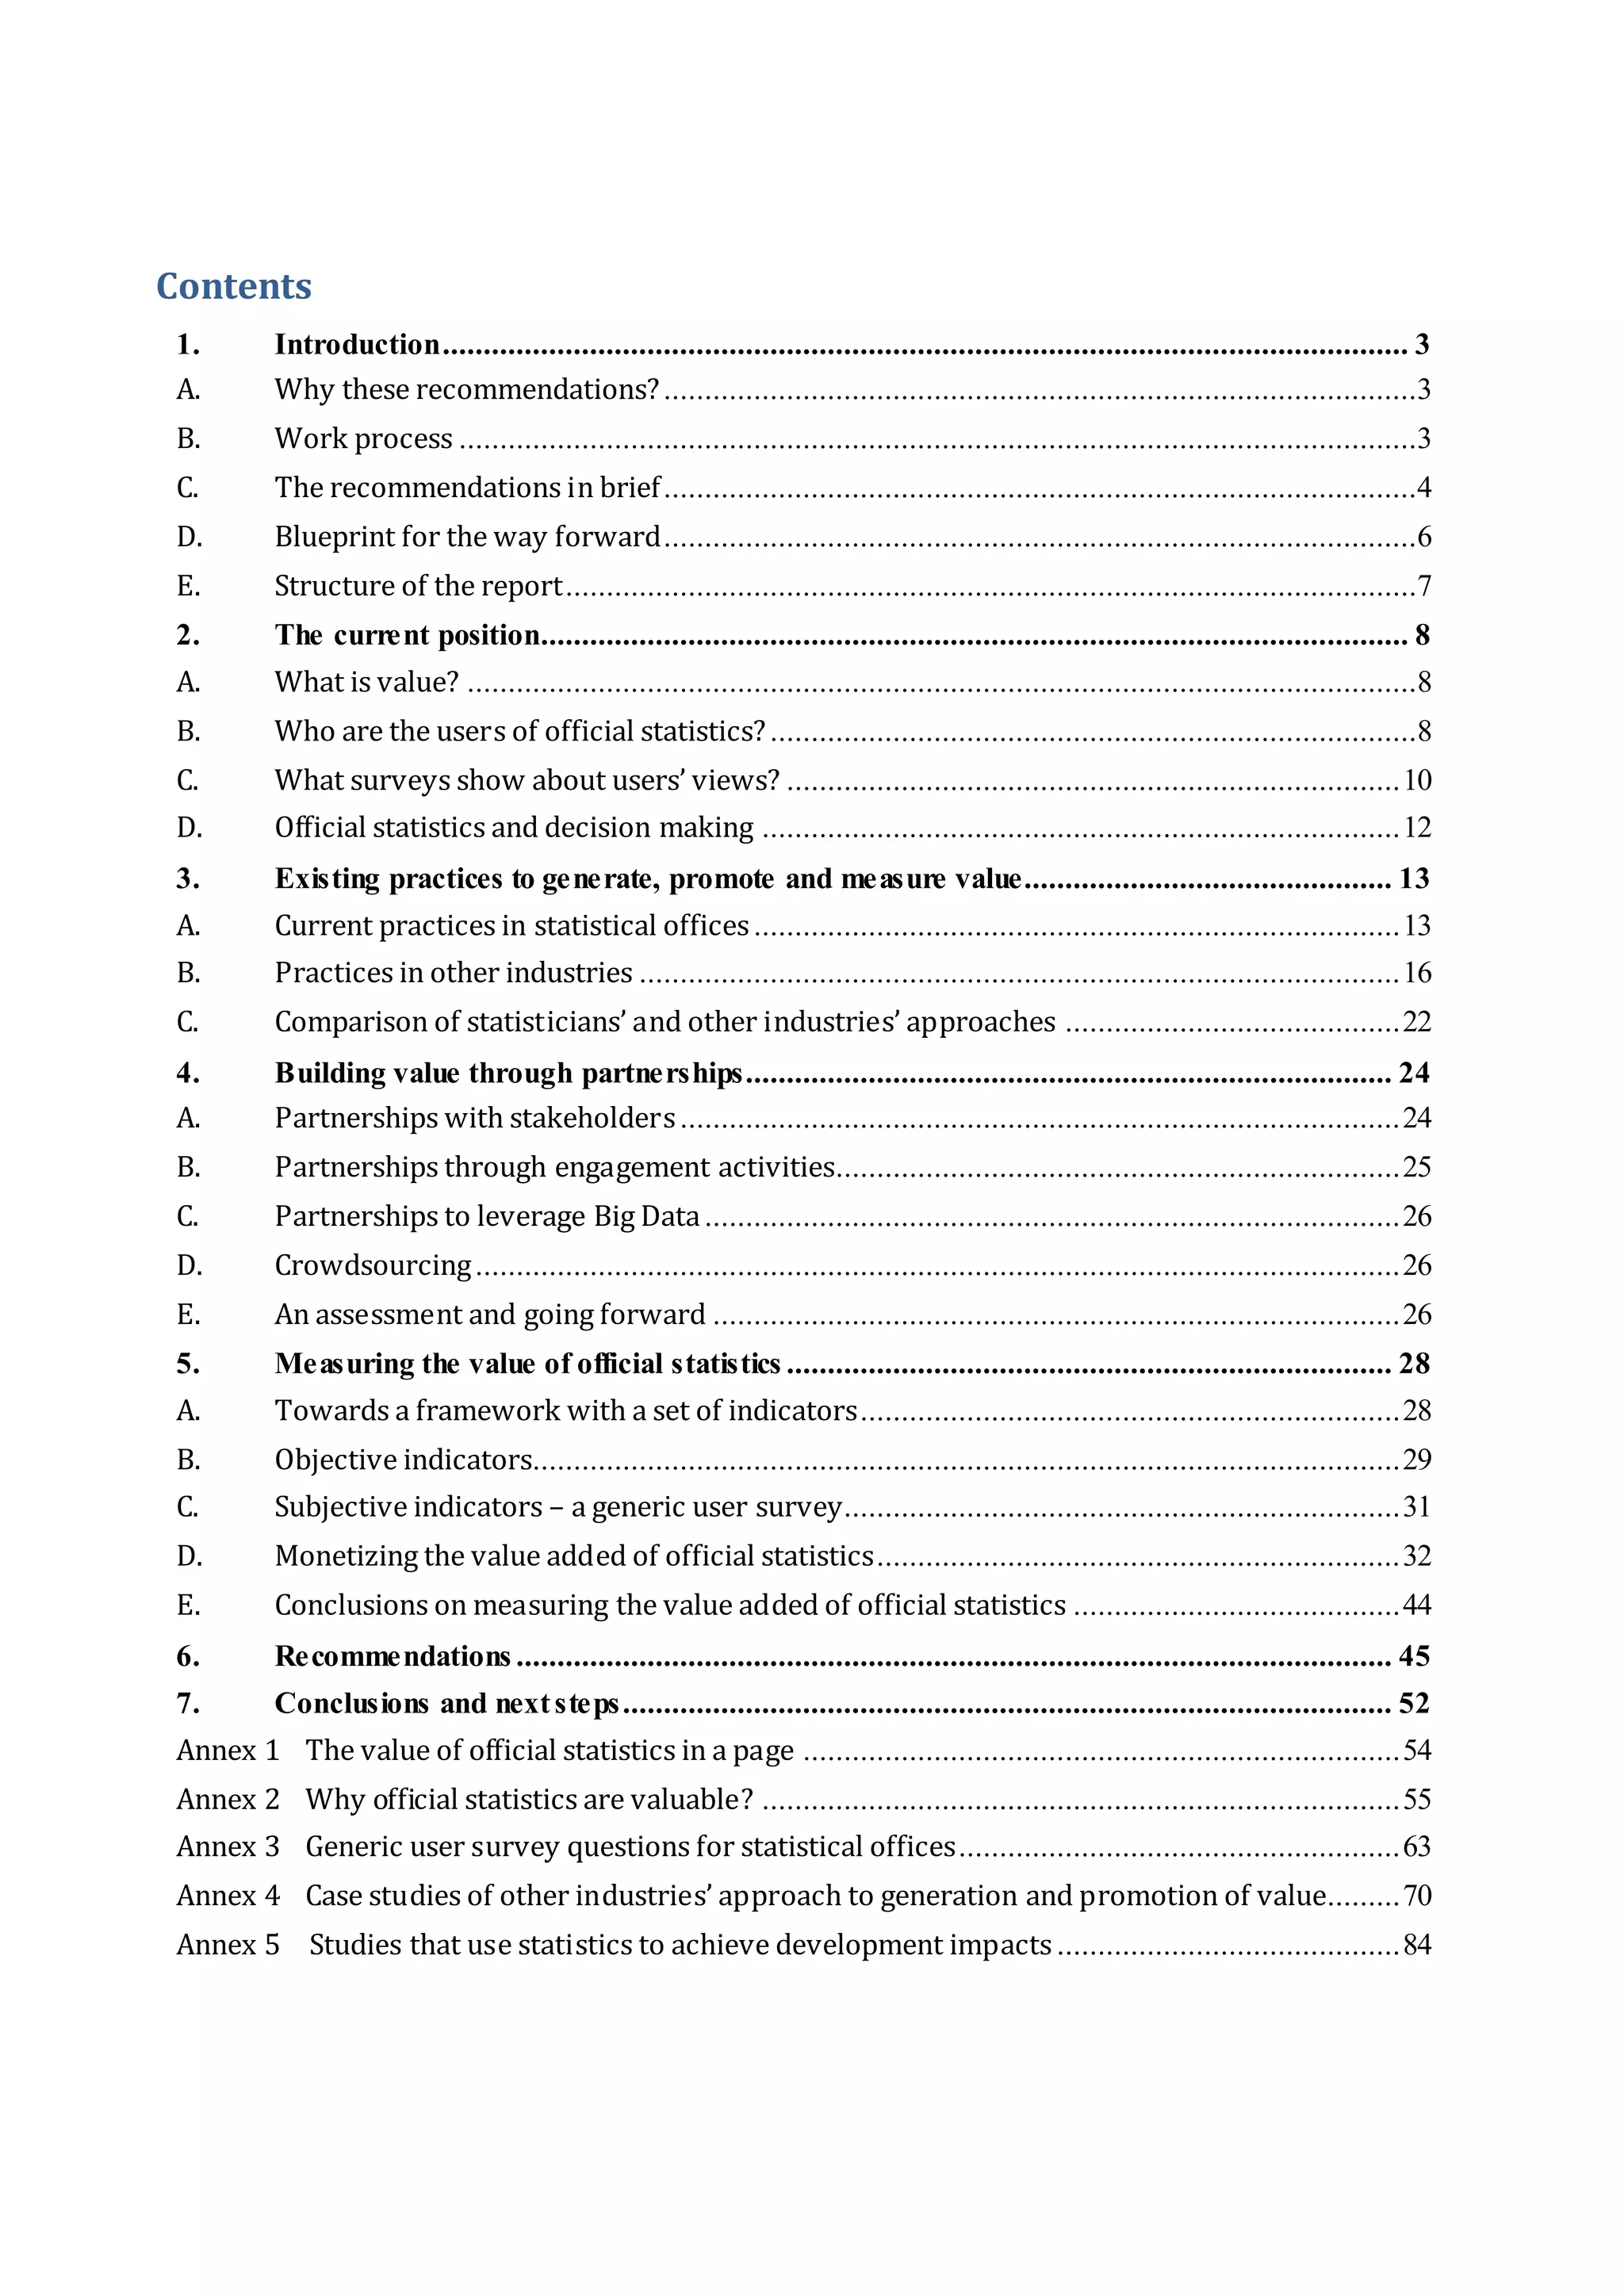
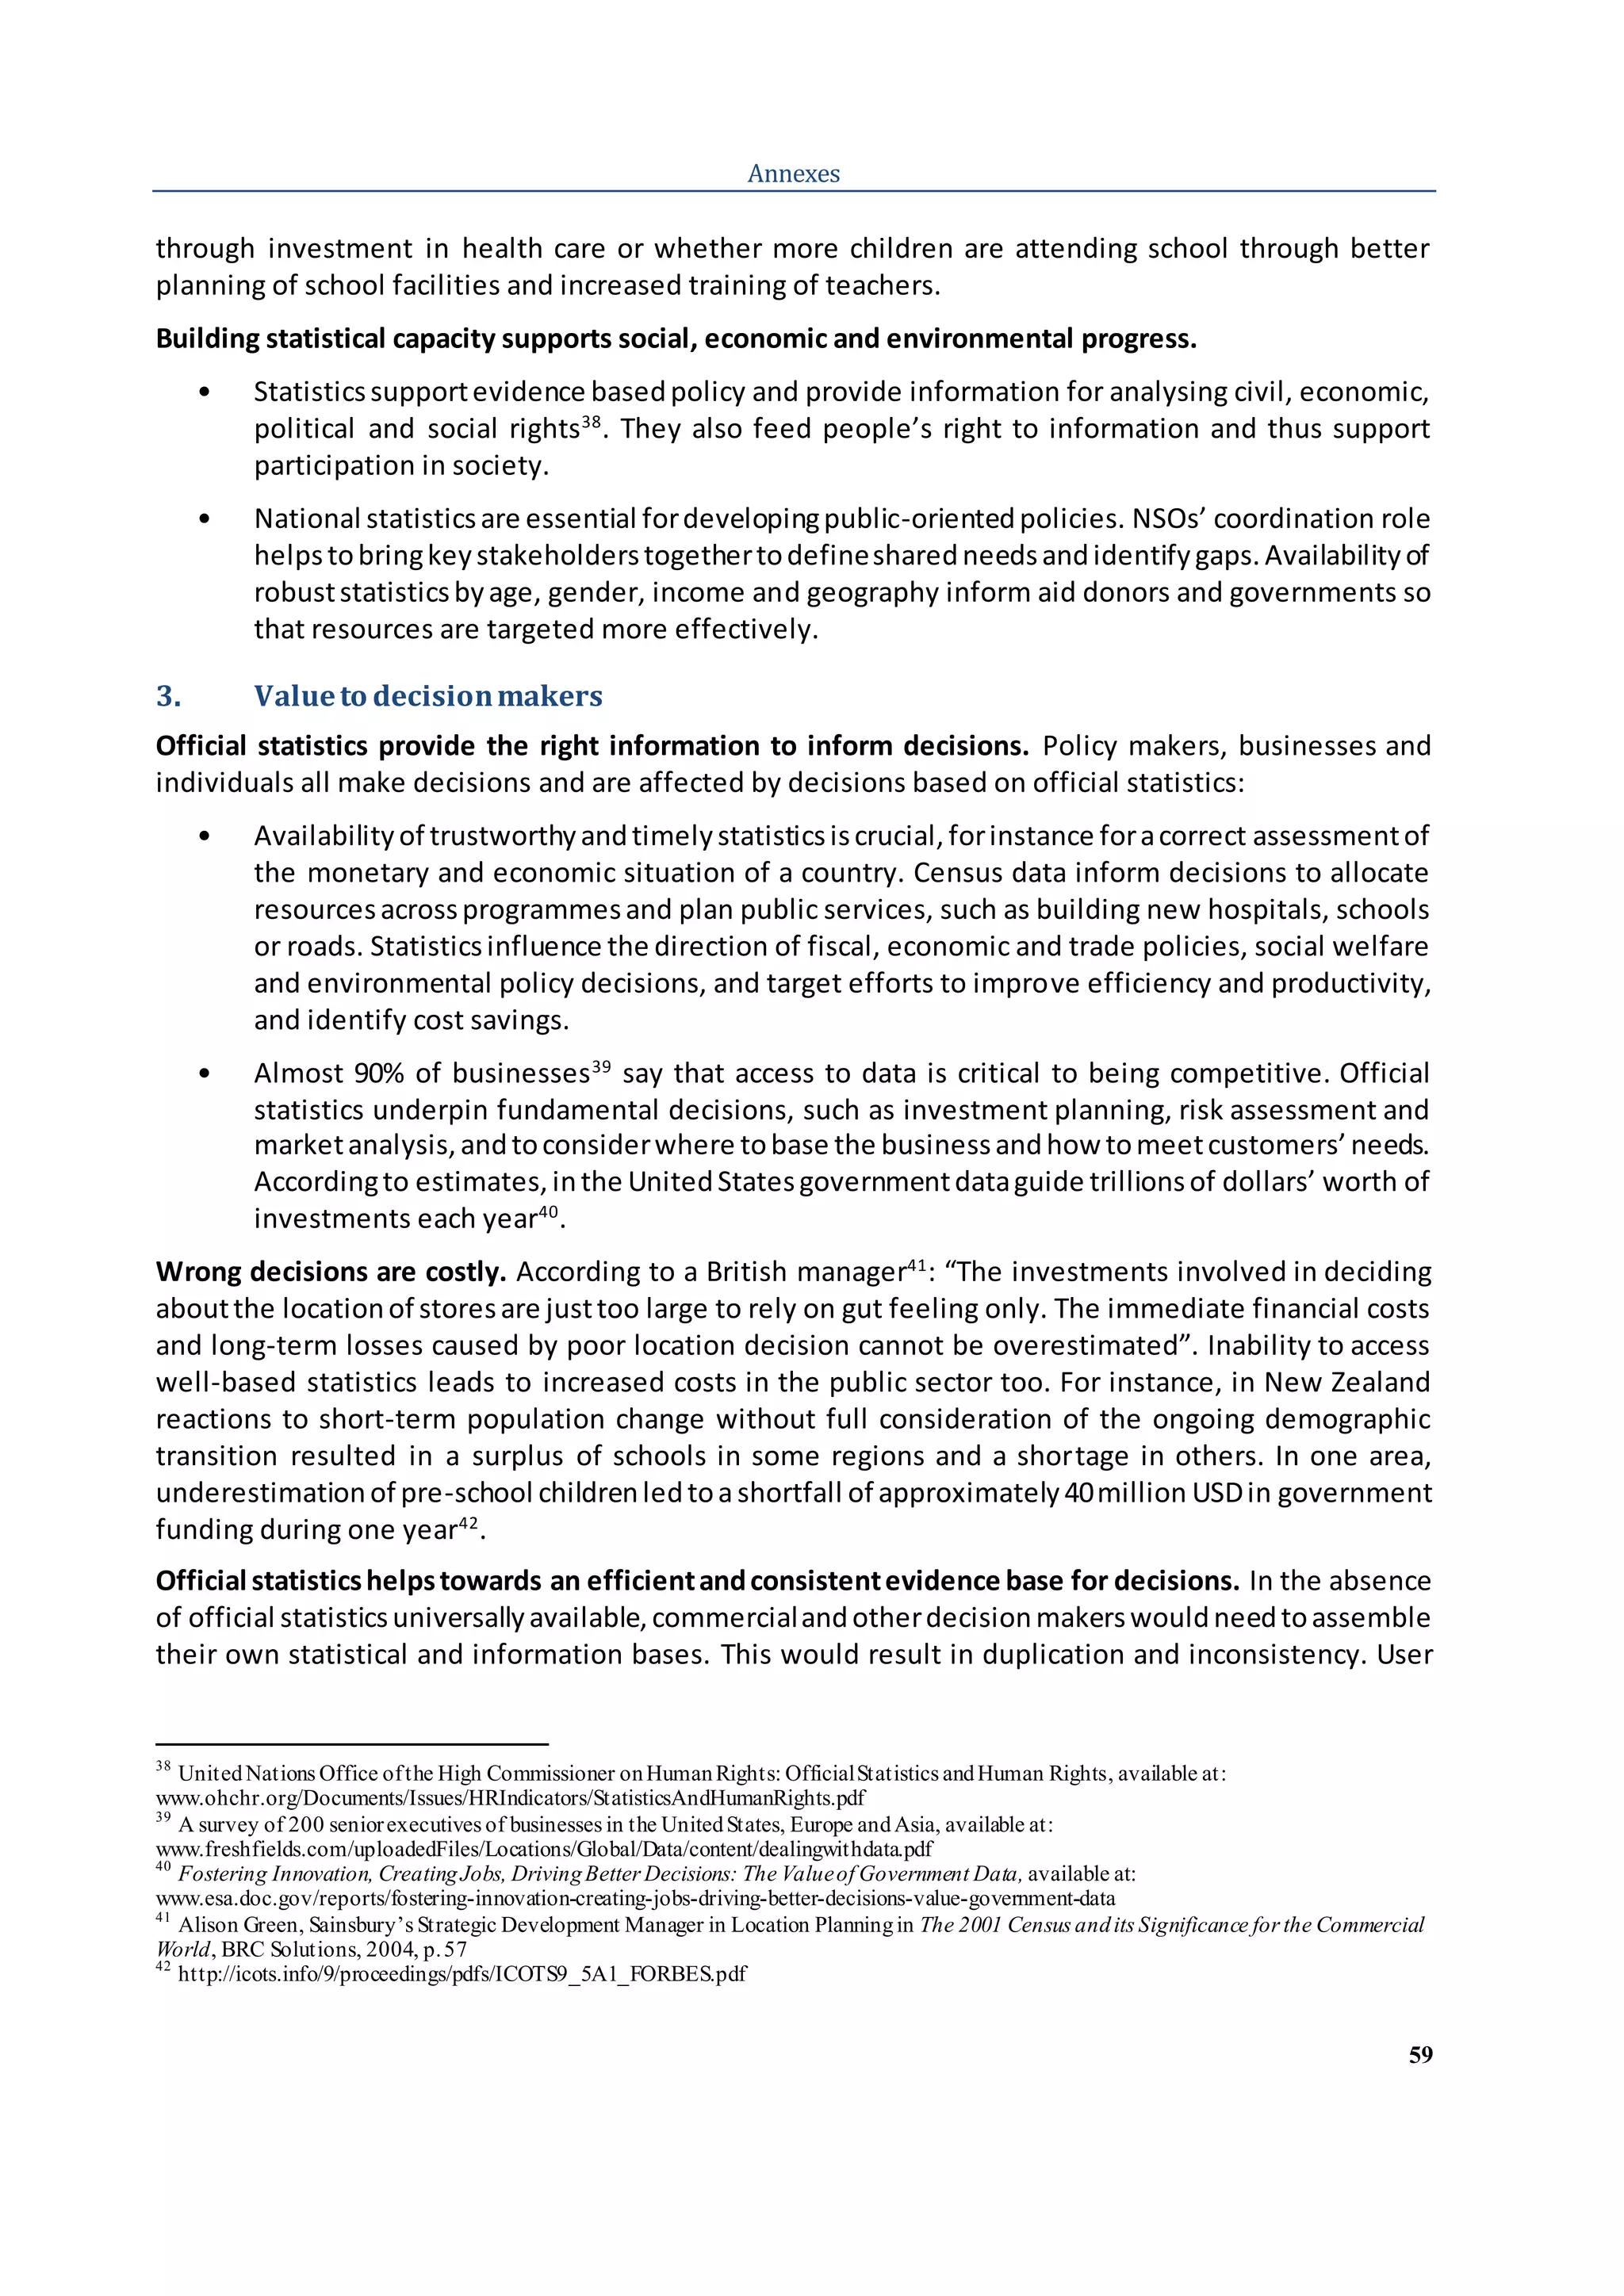
Value of Official Statistics
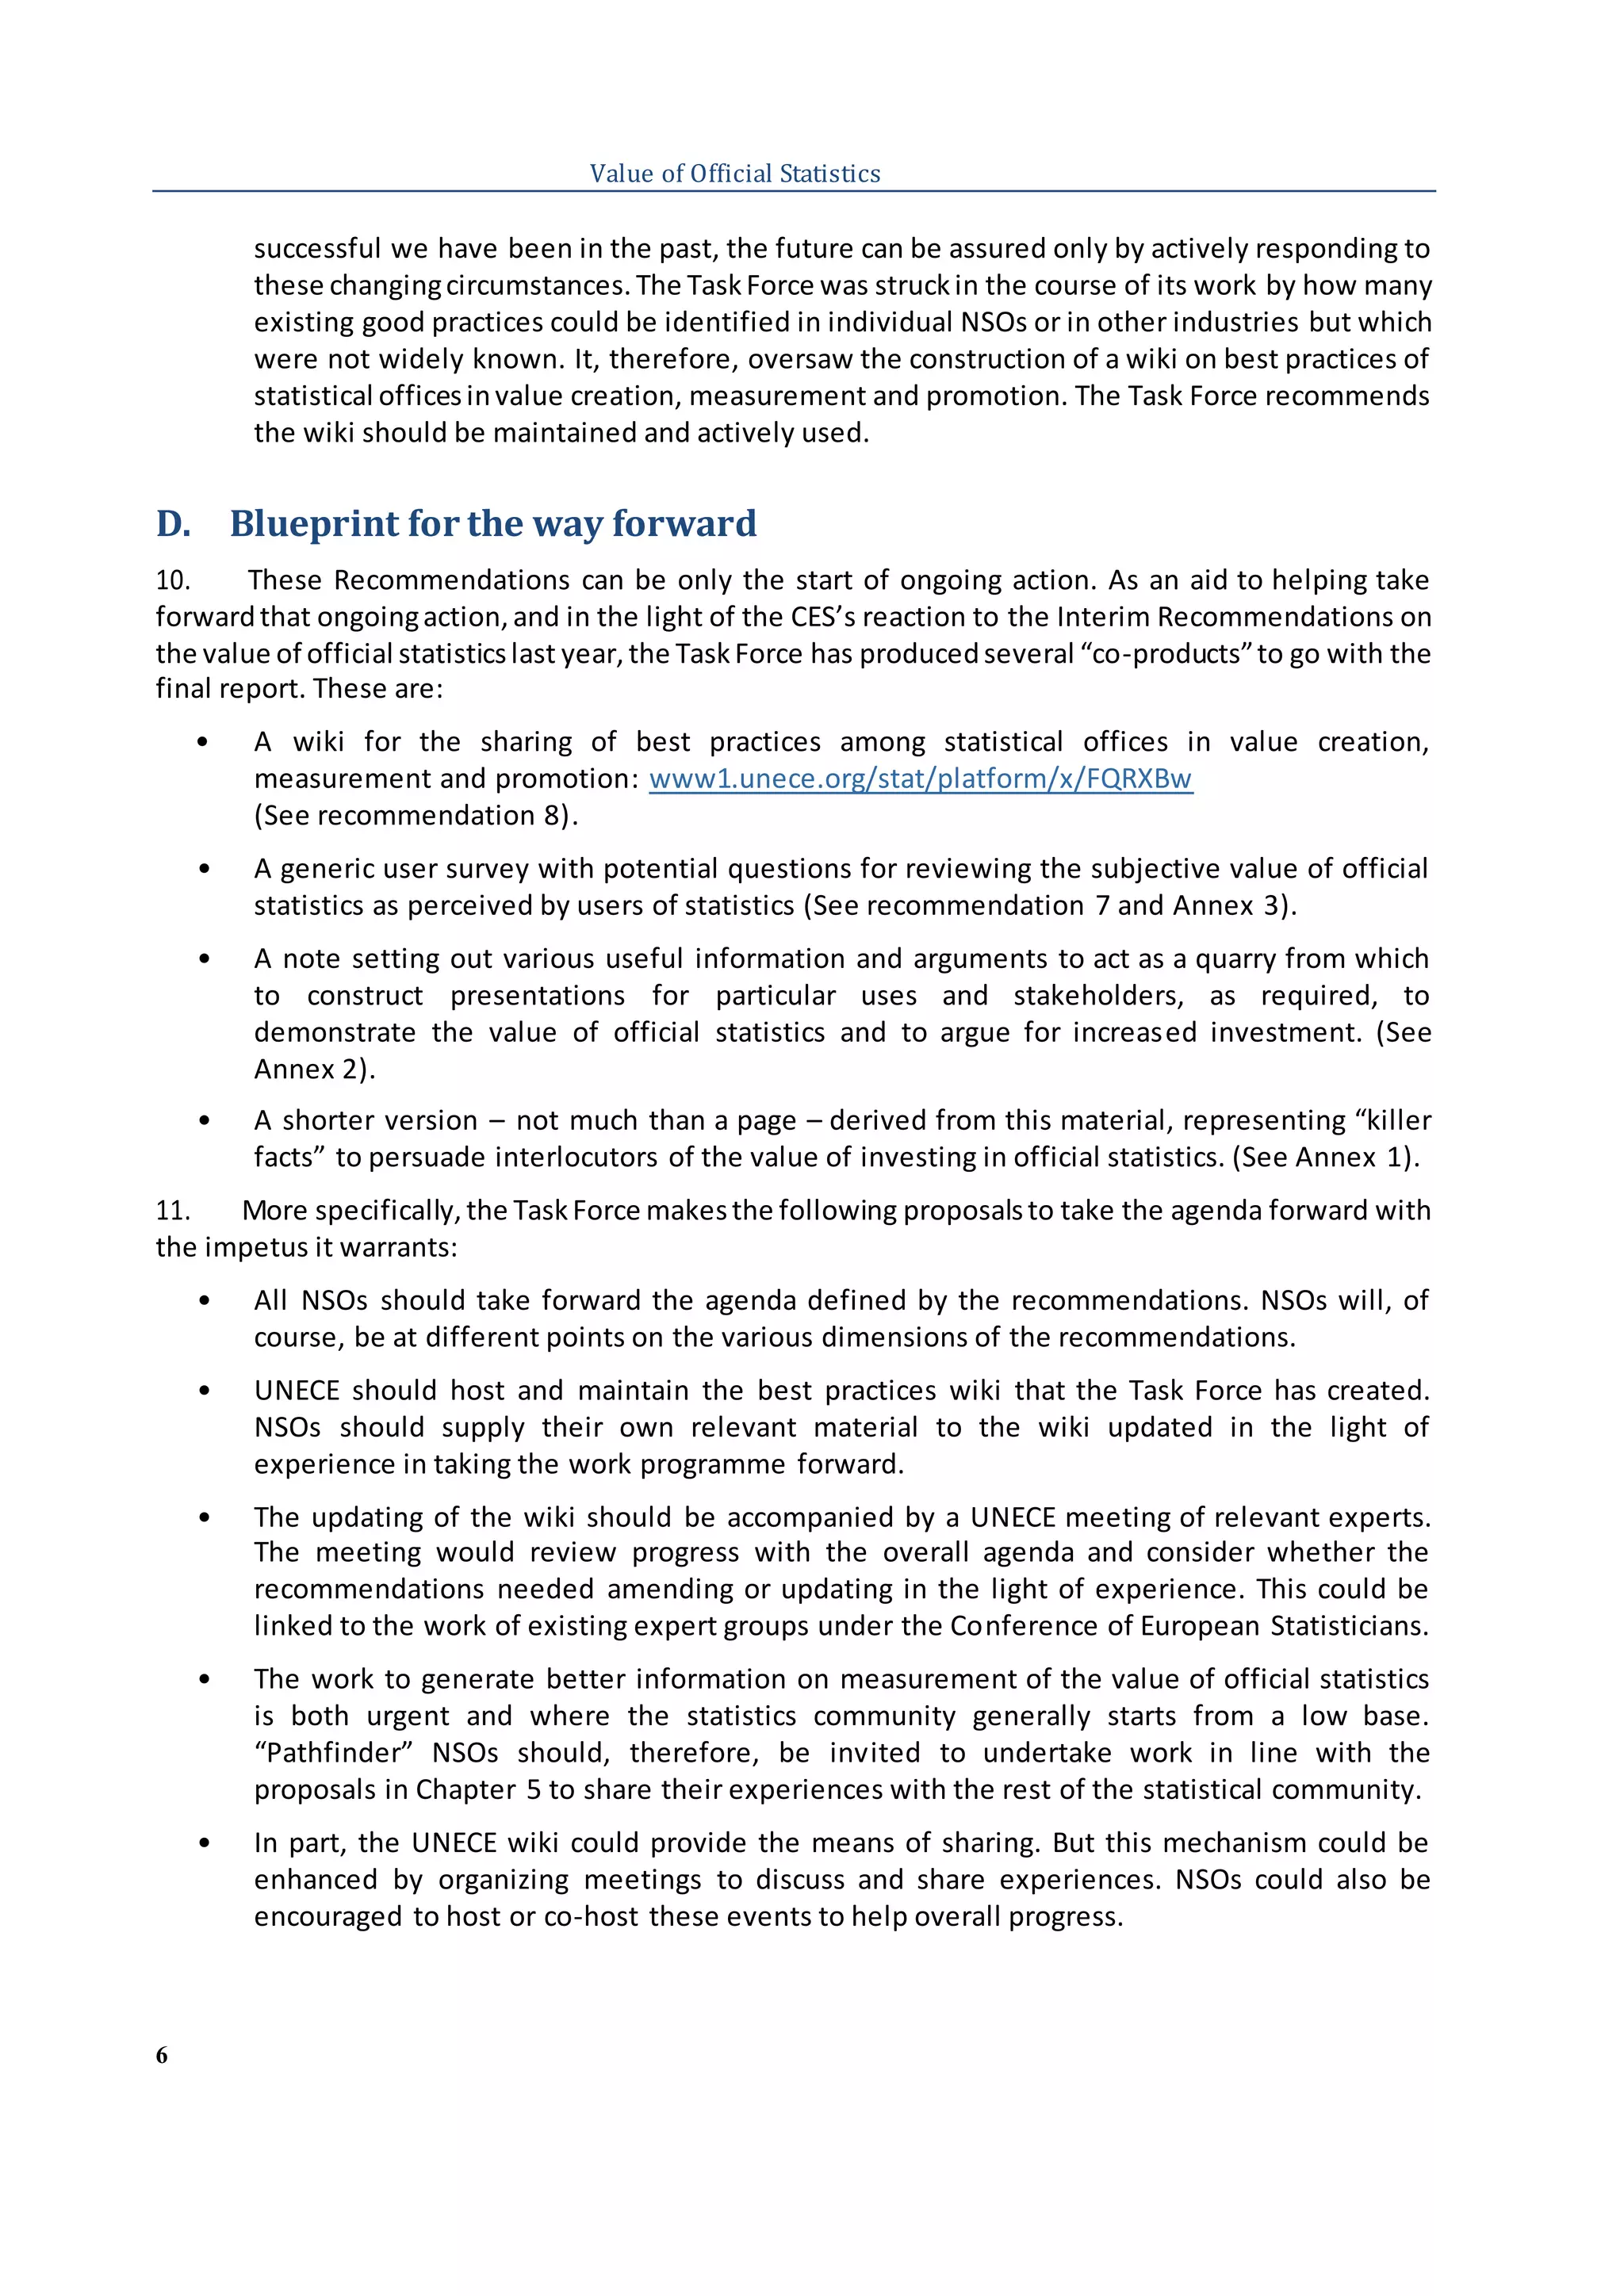
2b. [if anoption more than a monthago selected]
Whyhave you not contacted the NSO/usedthe
NSO statistics inthe past month?
Dropdownlist
3. How frequentlydoyou usually use NSO
statistics?
Dropdownlist
If Never,please specifywhy?______
4. For which purposesdo you use statistics?
Please selectall that apply.
Dropdownlist
4A. [Optional]Howimportant are the NSO’sstatistics for the purpose you mentioned?
[Displaysonlythose purposesthatwere selected]
Essential Important Background
information
Of minor
importance
Of no
use
Don’t
know
Work in general
Business or market analysis
Education
Legislativework
Media use
Modellingor forecasting
Negotiations
Personal interest
Policy formulation/monitoring/evaluation
Regional analysis
Reports or publications
Research
Reuse in other products
Service planning
Work in general
Business or market analysis
Education
Legislativework
Media use
Modellingor forecasting
Negotiations
Personal interest
Policy formulation/monitoring/evaluation
Regional analysis
Reports or publications
Research
Reuse in other products
Service planning
Other (pleasespecify)
Daily
Weekly
Monthly
Quarterly
Annually
Less often
Never
I have had no need for any statistical information
I have found another website/source to use that suits me better
I find itdifficultto navigatethe CSO’s website
I prefer the design of another website/source
I prefer the infographics/reports provided by another website/source
I had not known about the CSO before now
Other (pleasespecify)](https://image.slidesharecdn.com/ces04-valueofofficialstatistics-170406131350/75/Value-of-official-statistics-Recommendations-on-promoting-measuring-and-communicating-the-value-of-official-statistics-64-2048.jpg)
![65
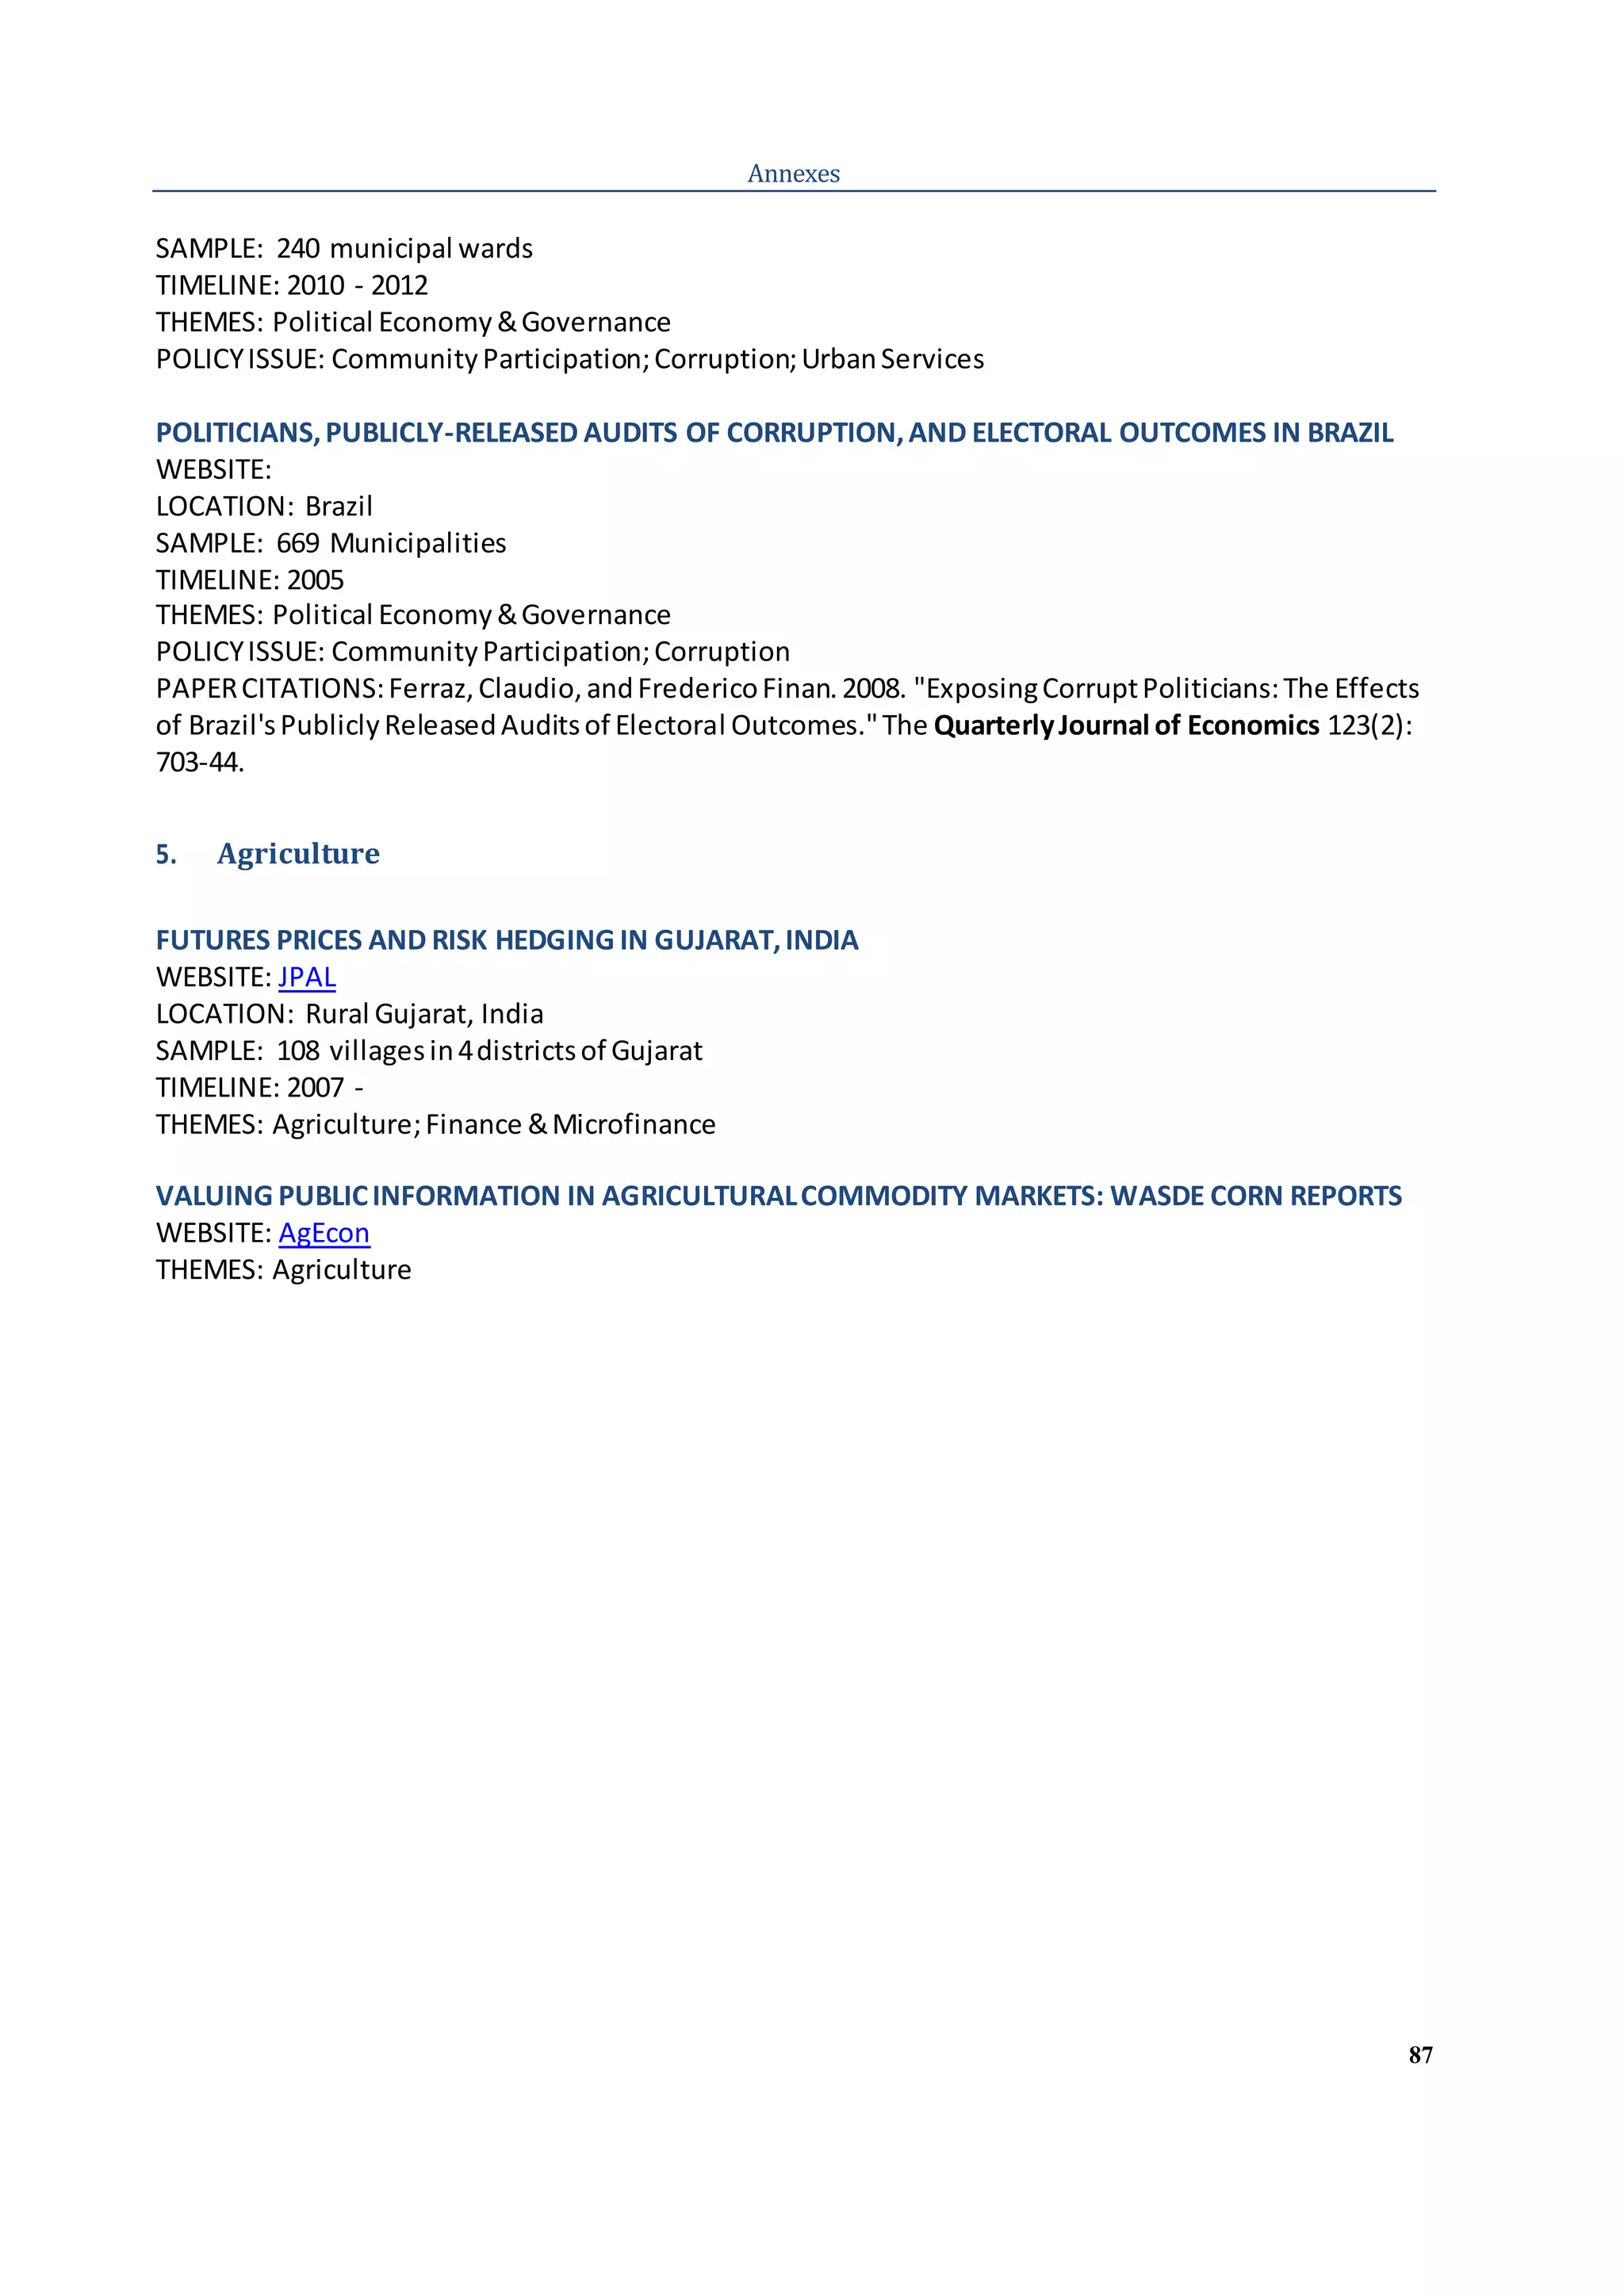
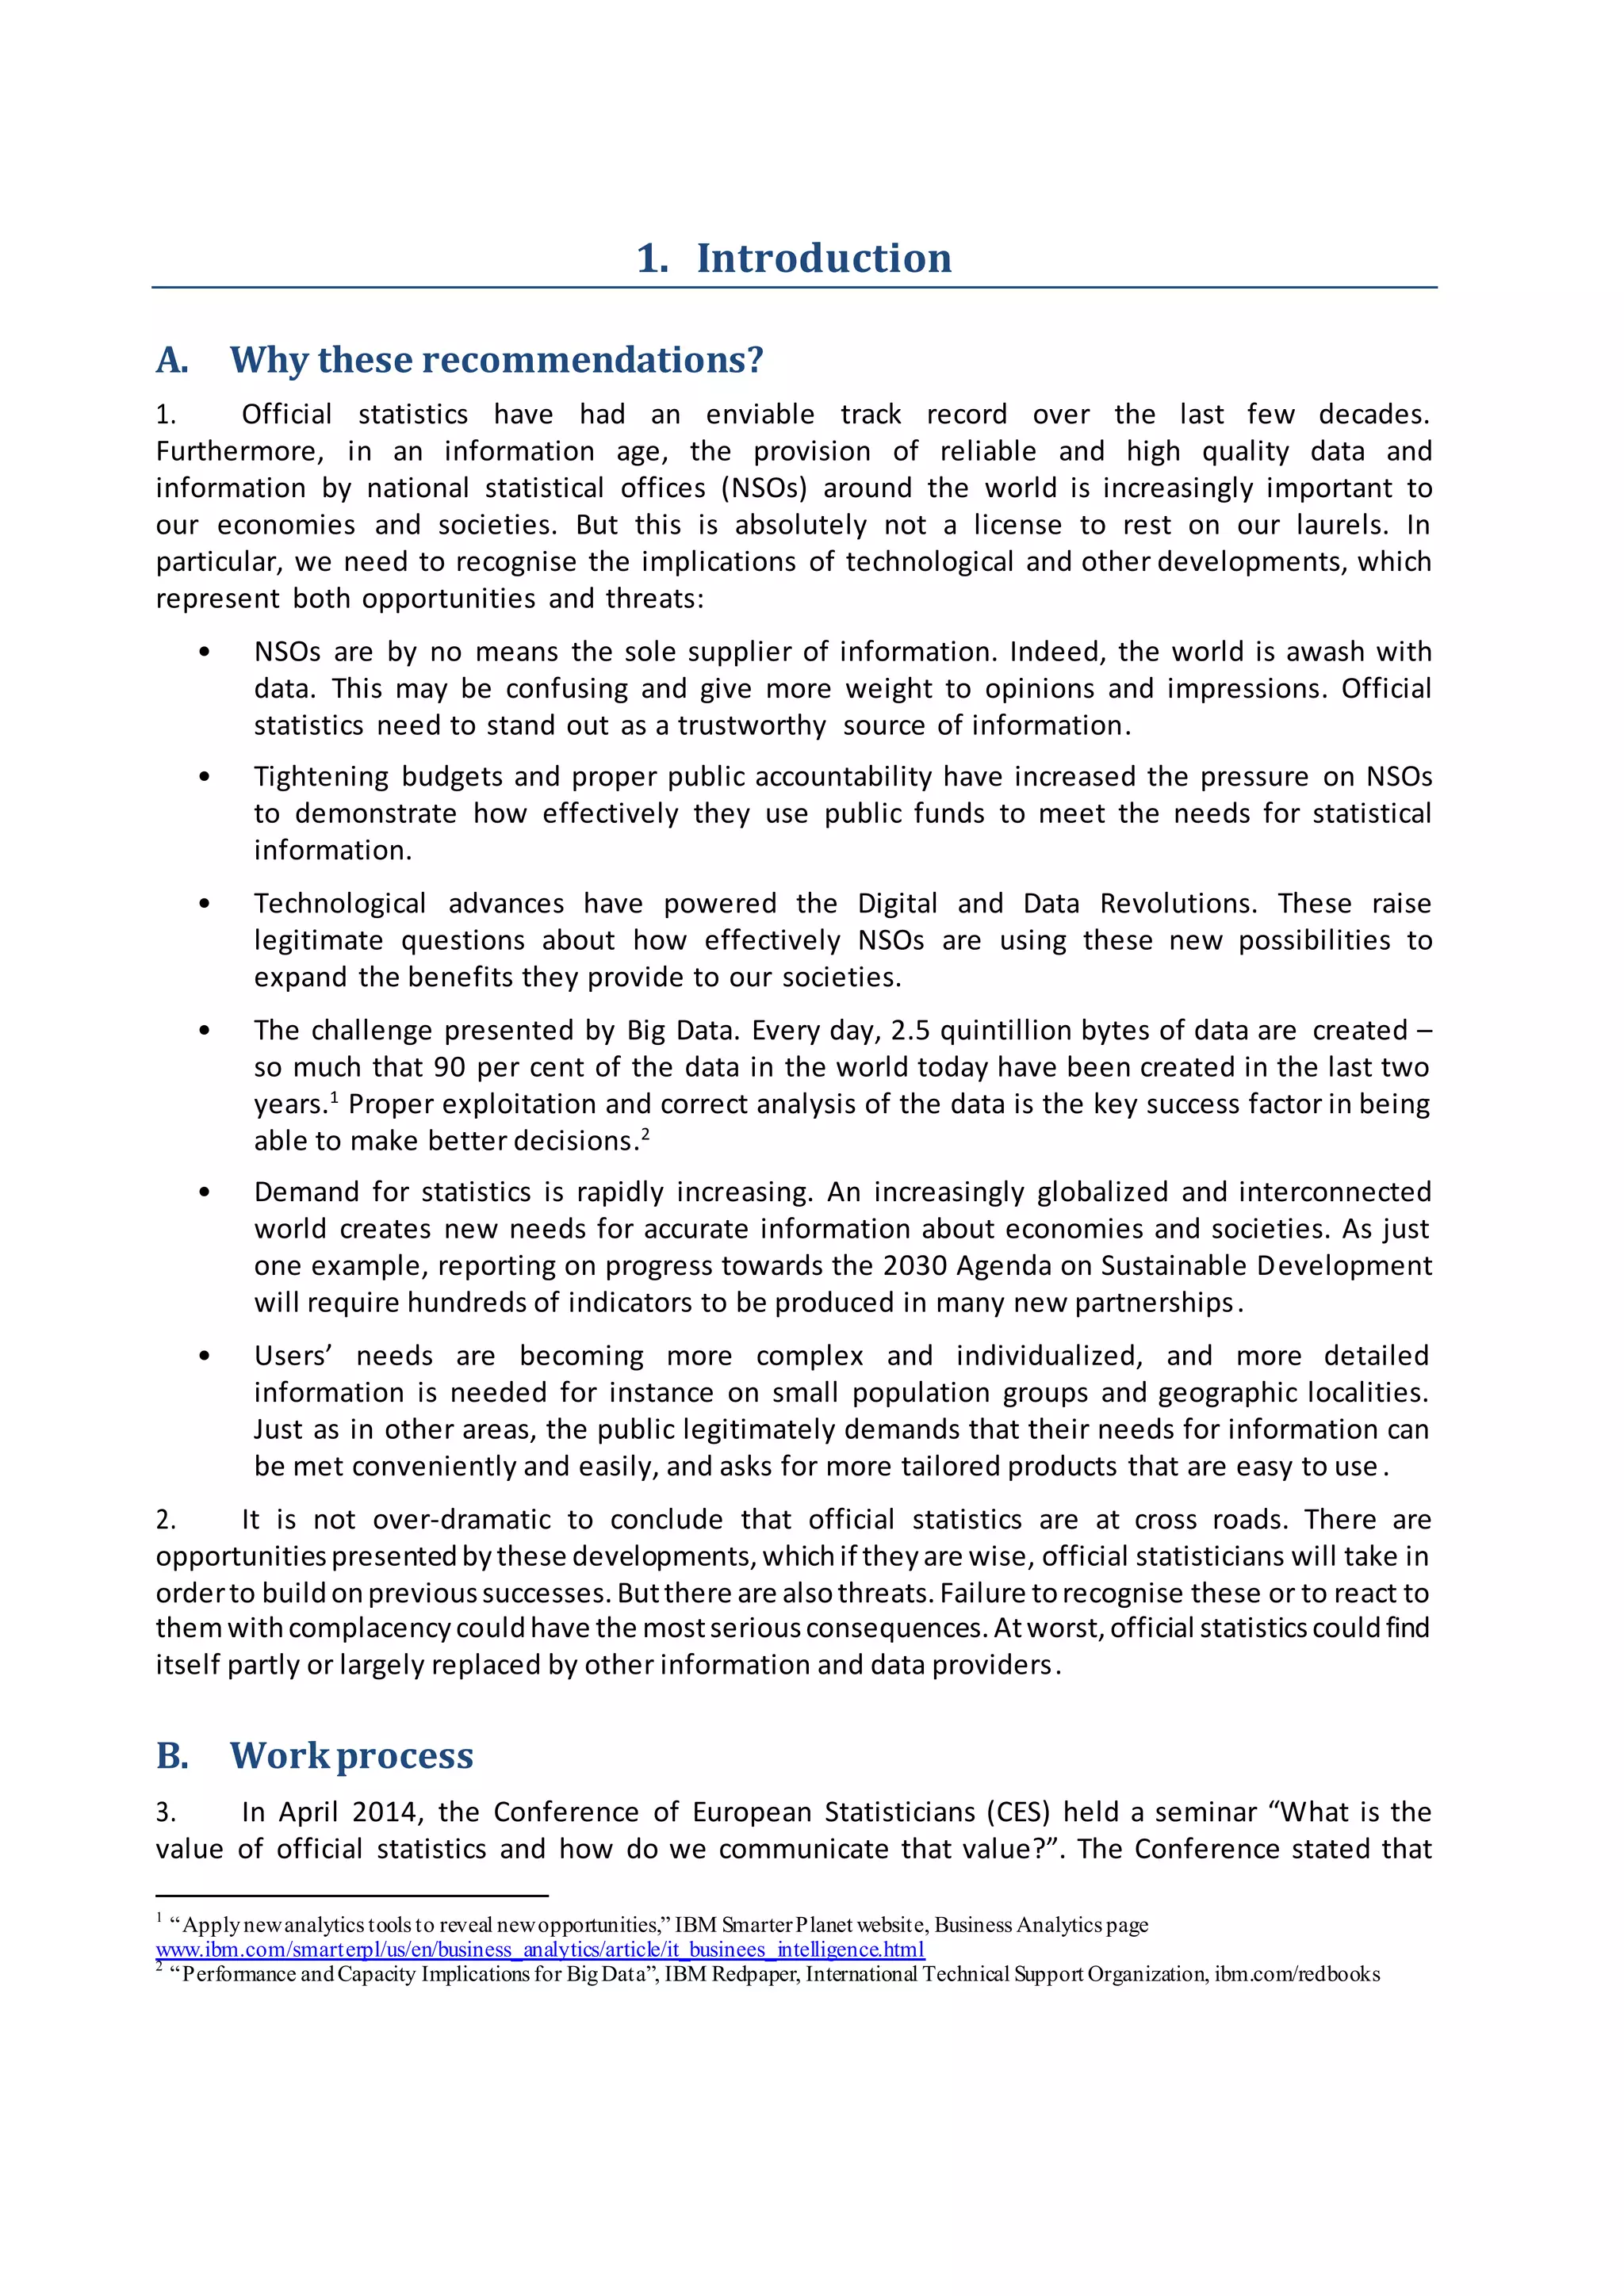
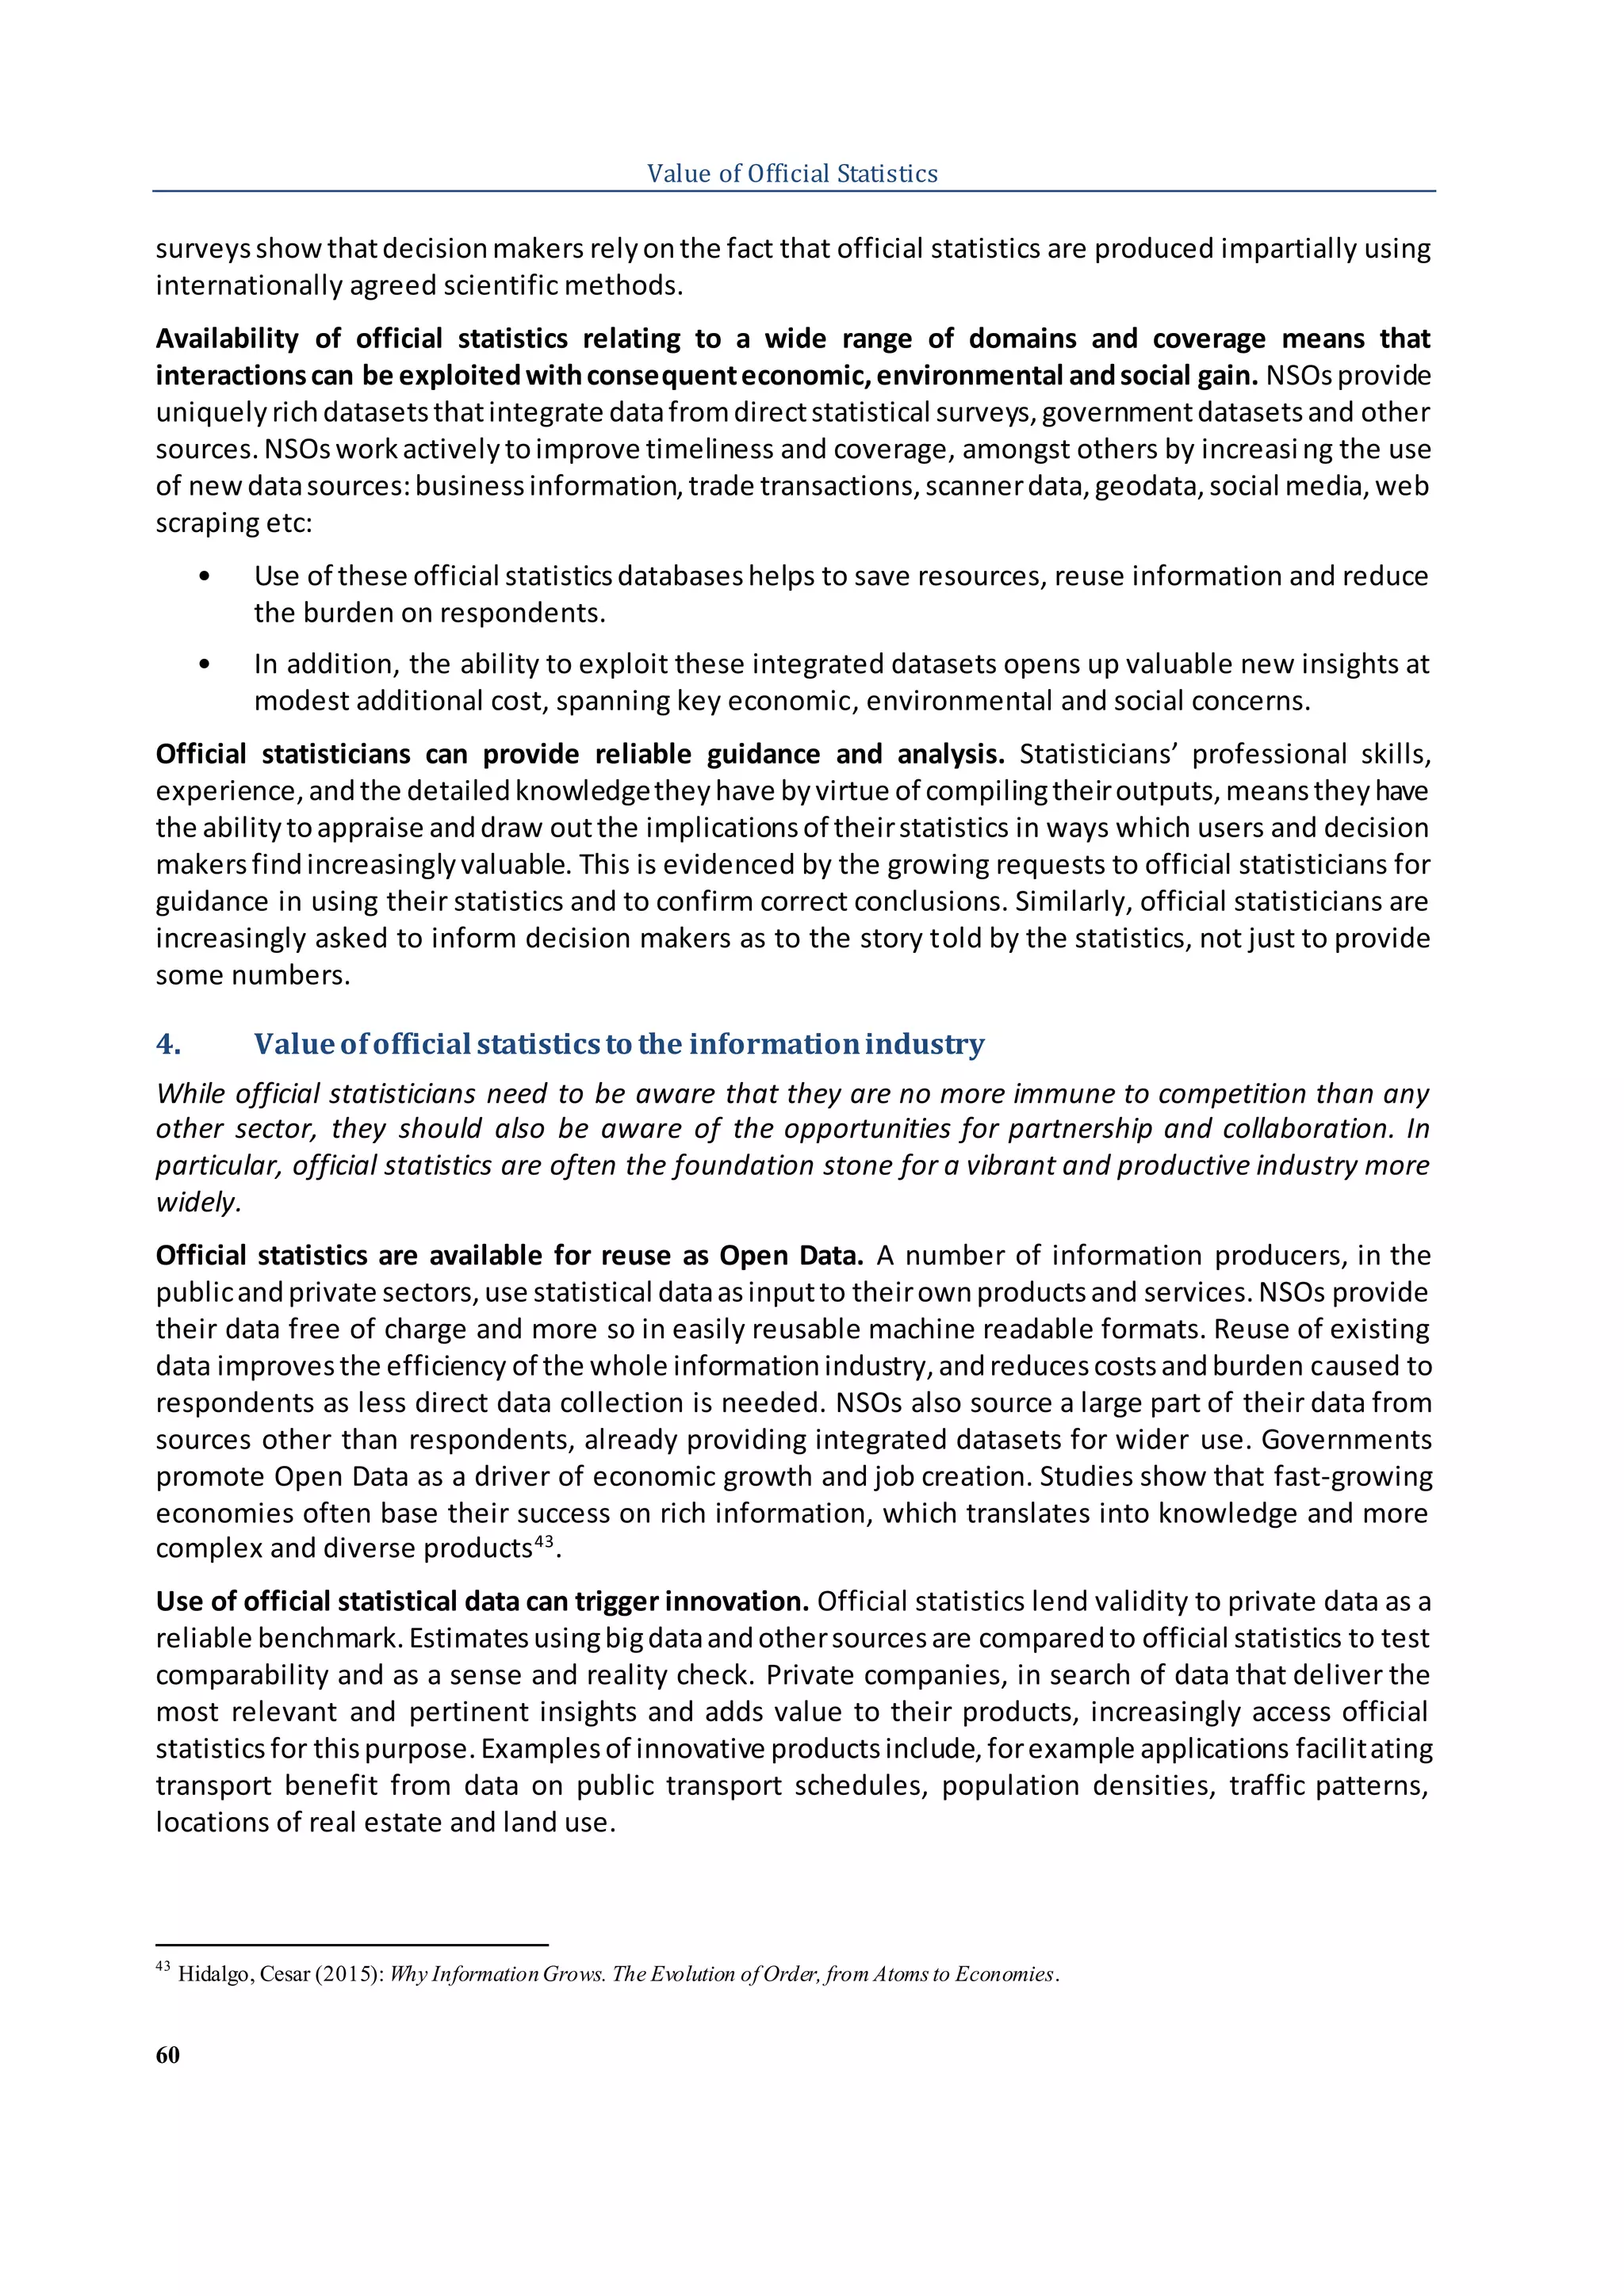
Annexes
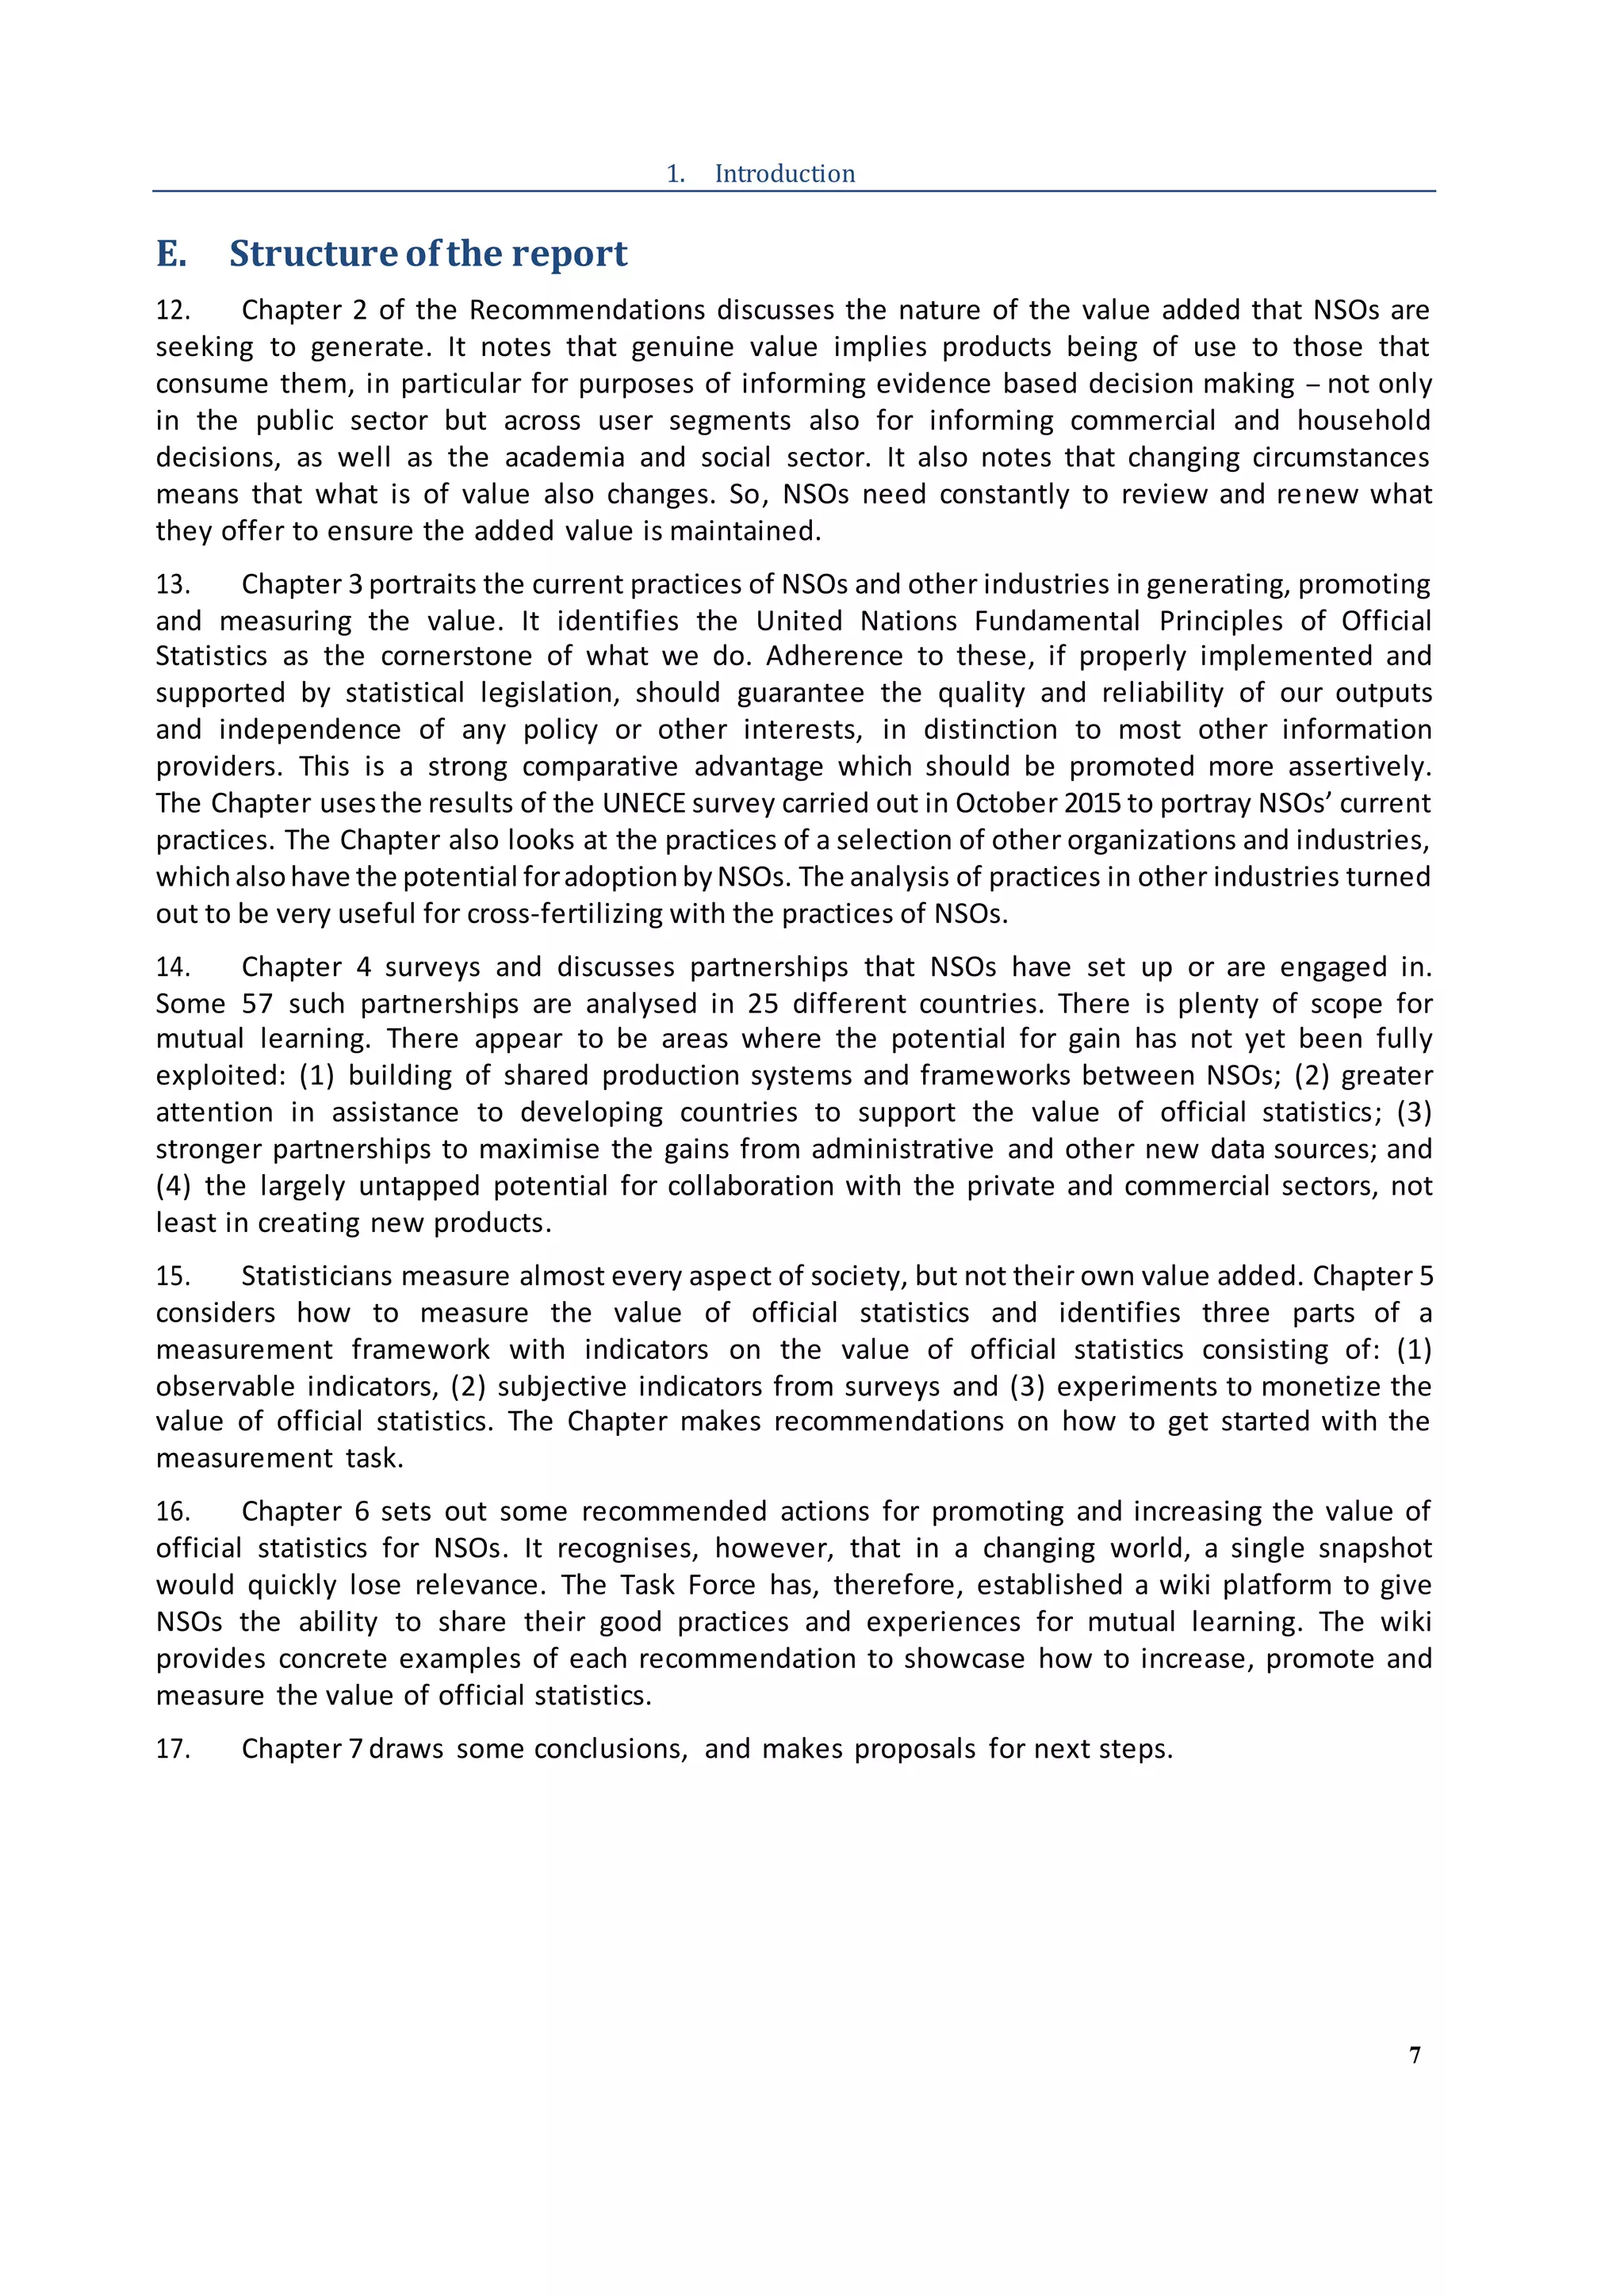
5. Whichstatistics do you use most often?
Please selectall that apply.
Dropdownlist
Accessing statistics
6. How do you usually accessNSO statistics and
information?(Select1-3 options)
Dropdownlist
7. How do you become alertedto the latest NSO
statistics?
Dropdownlist
8A. Whichdevice doyou use to access statistics?
8B. [Optional] If morethan one: Whatis your
preferred device to accessstatistics?
8C. [Optional] Whichdevice doyouuse most
oftento access statistics?
Dropdownlist
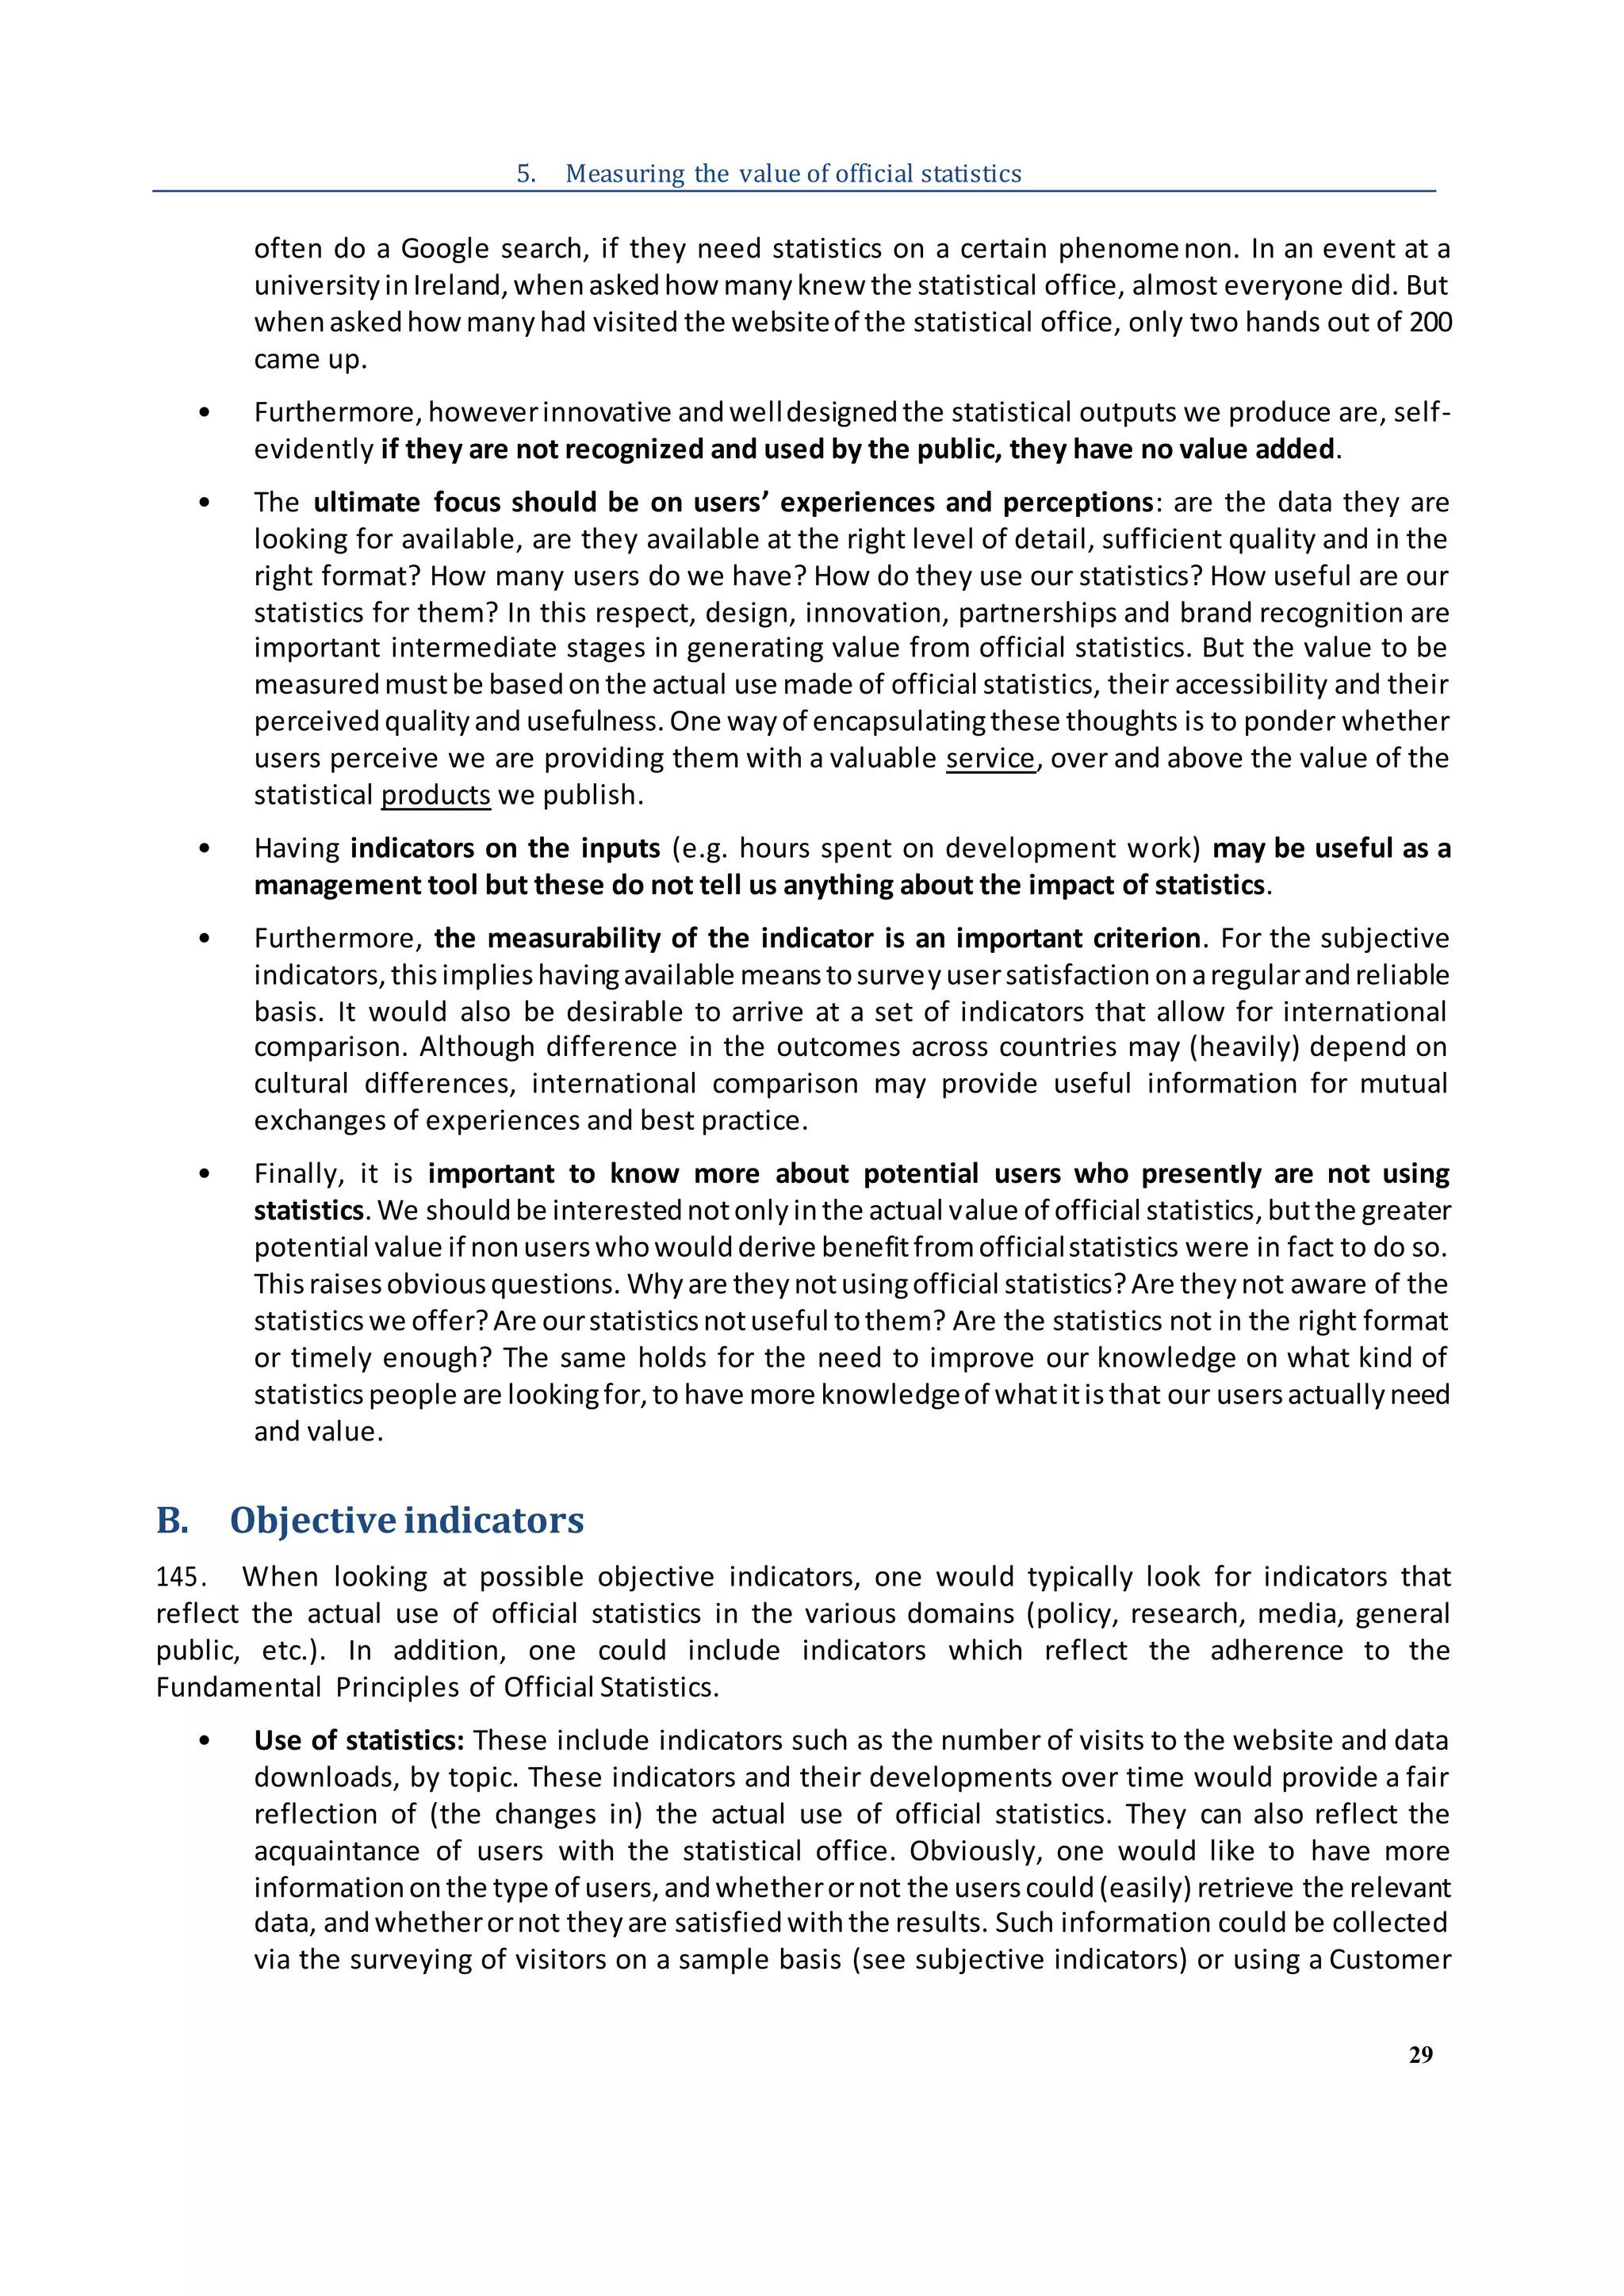
(selectall
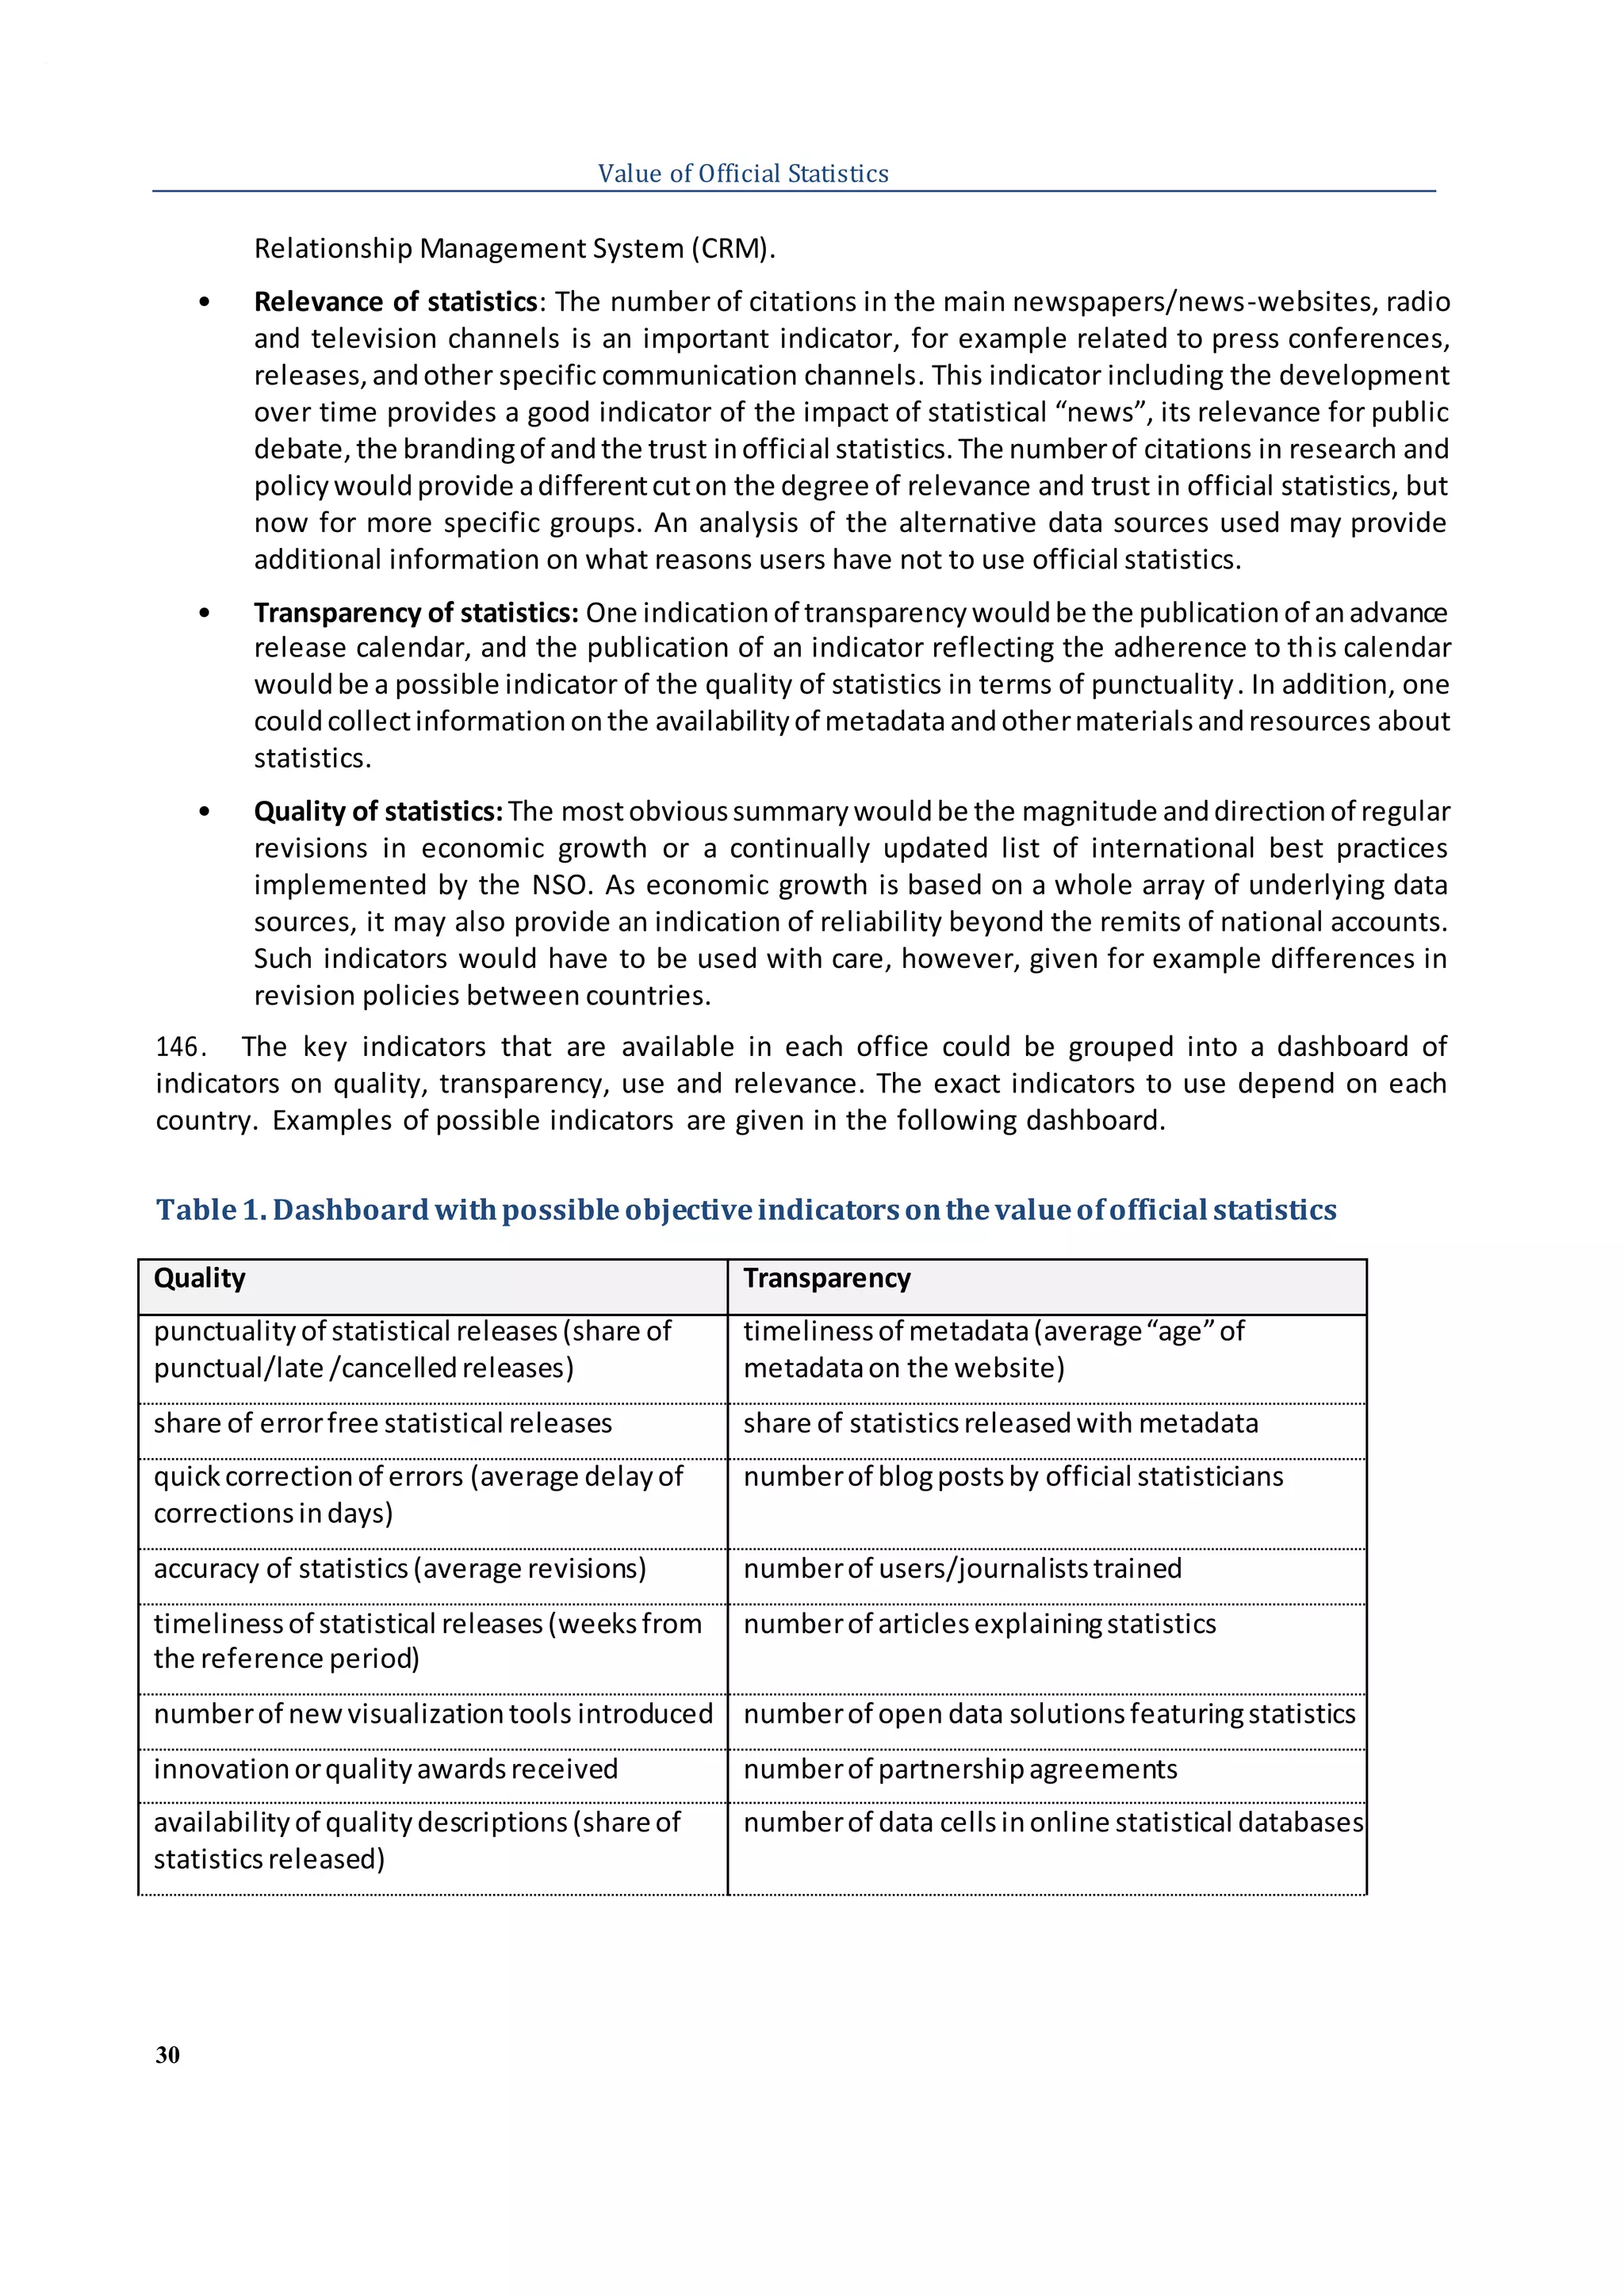
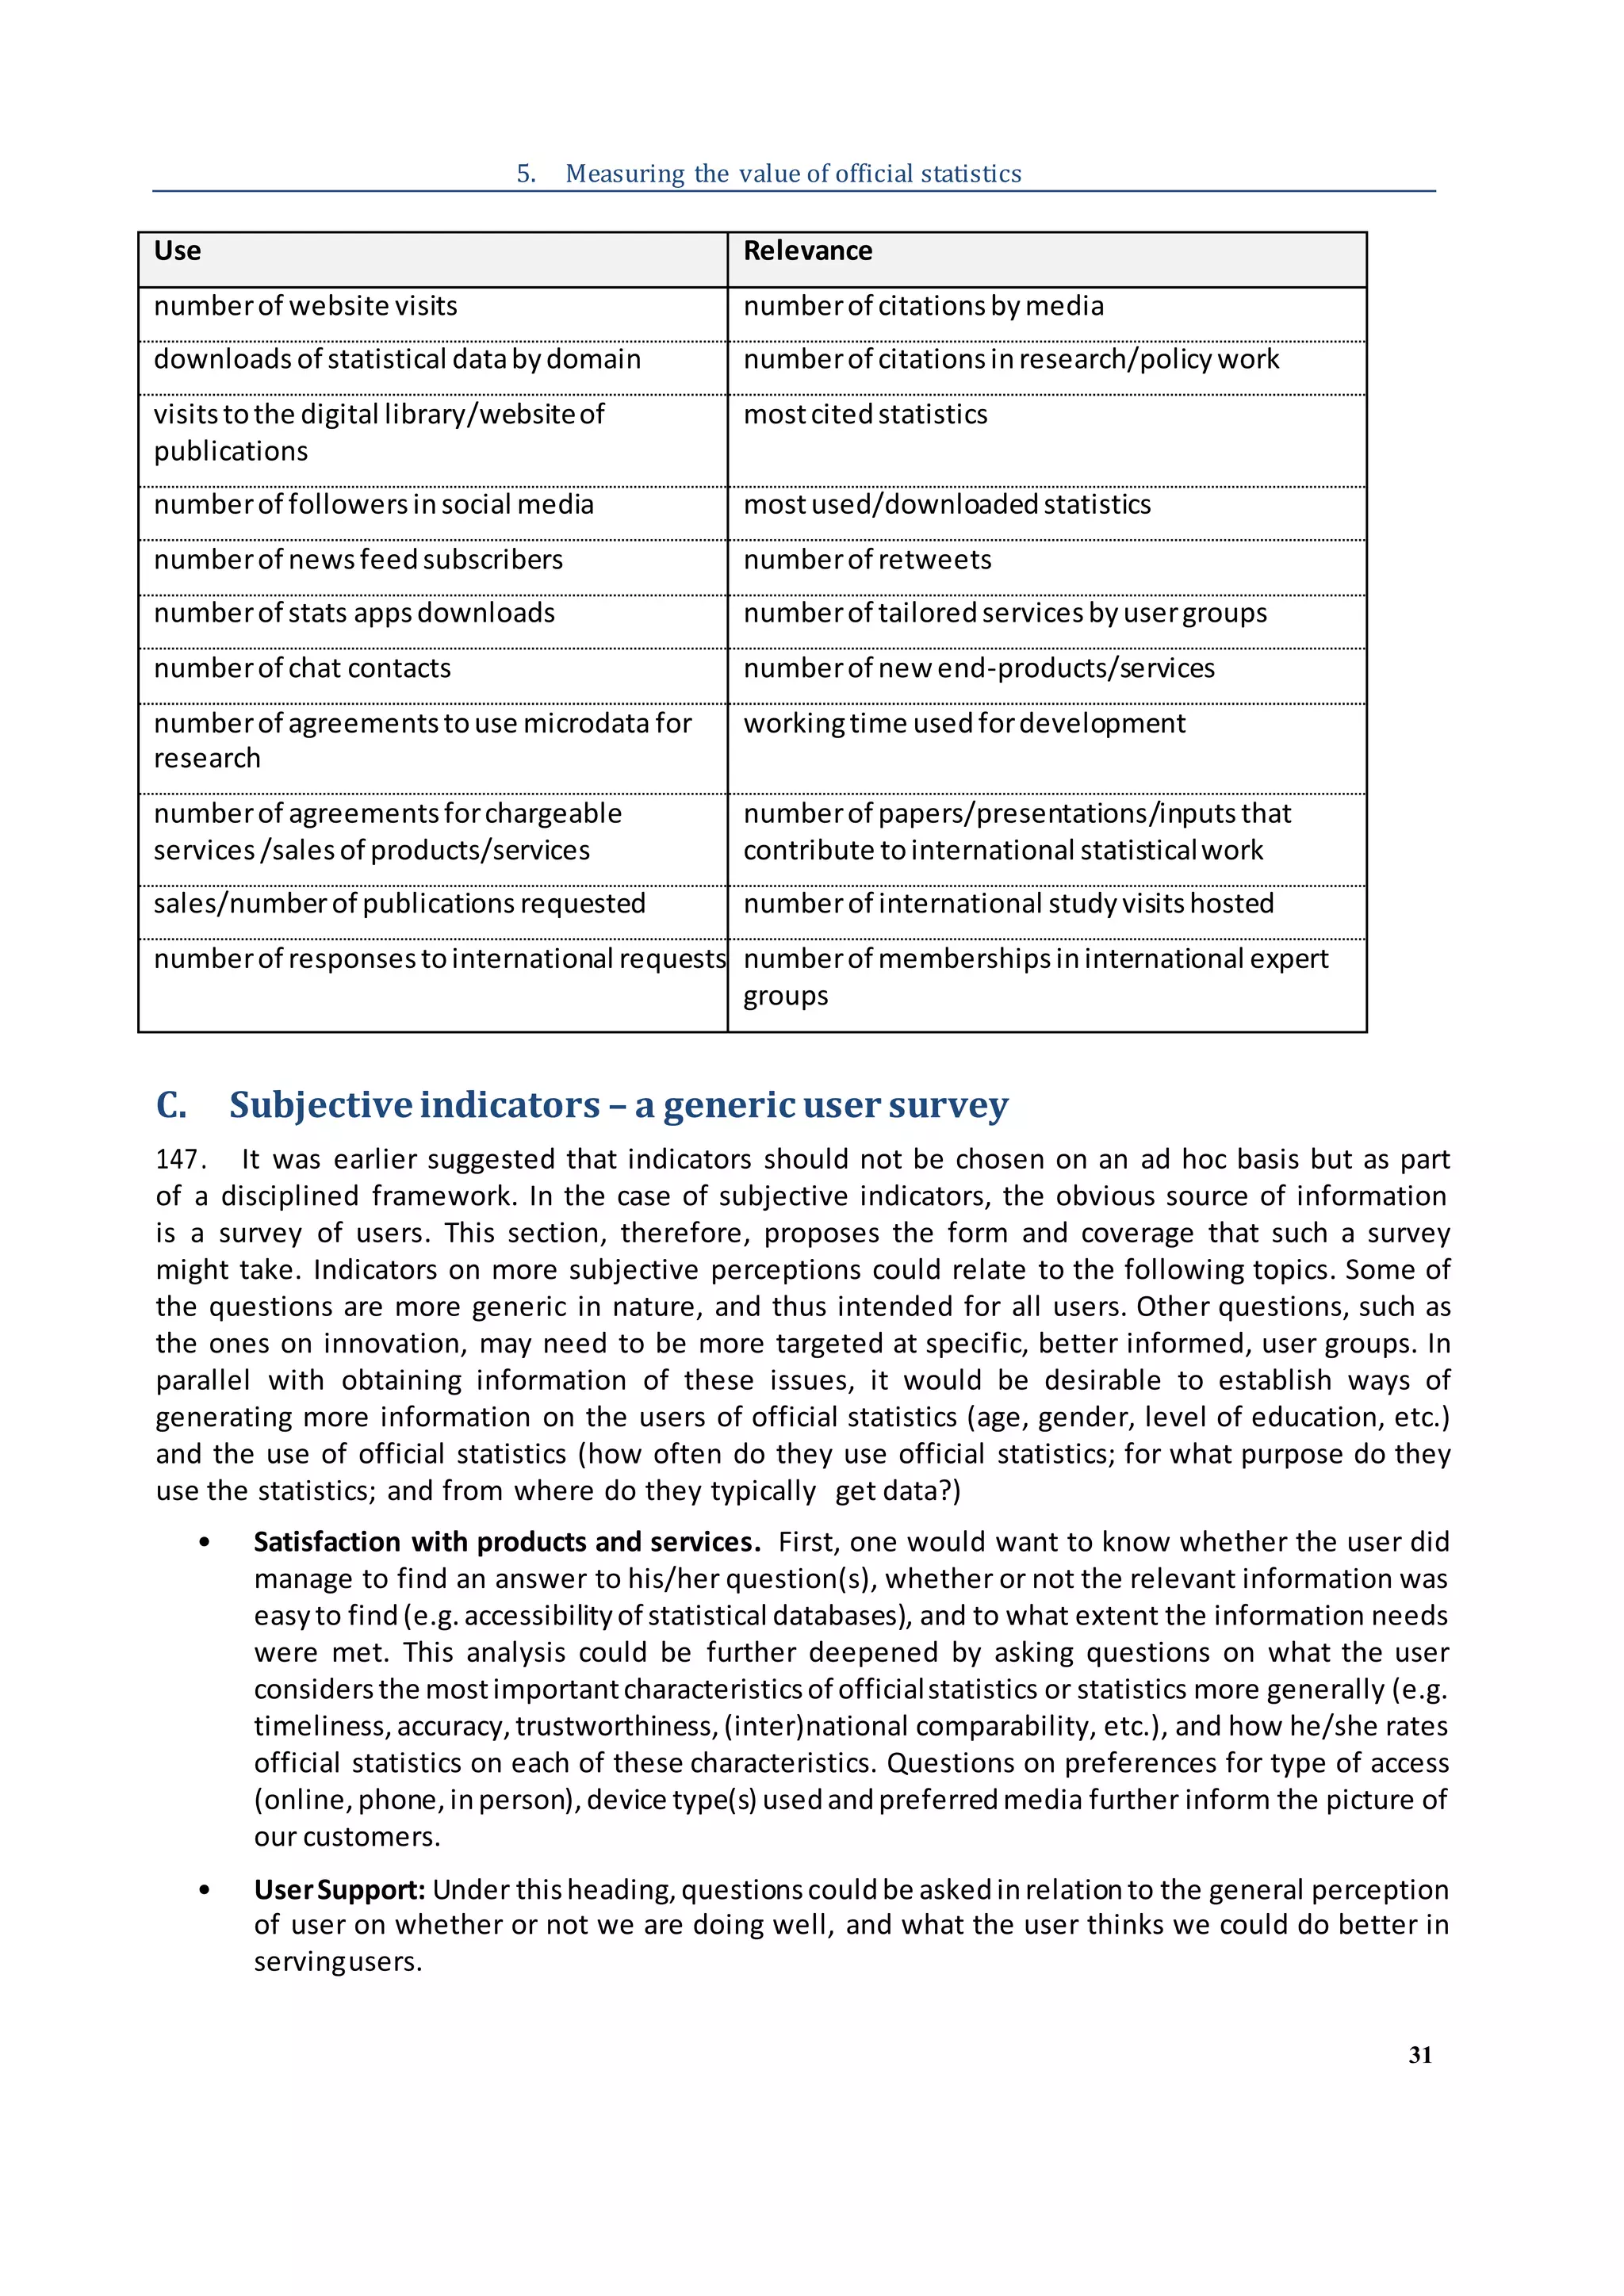
devicesused)
Population (e.g. census,education,migration, gender)
Labour market (e.g. employment, productivity,earnings)
Health (e.g. lifeexpectancy)
Income and consumption
Education
Energy
Justiceand crime
Travel and tourism
National accounts (e.g. GDP)
Business (e.g. construction,industrial production, retail trade)
Globalization (e.g. trade, foreign affiliates,balanceof payments)
Prices and costs (e.g. consumer and producer prices,livingcosts)
Science, technology and innovation
Environment and climate
Sustainabledevelopment
Regional
Other (pleasespecify)
NSO website
StatBank
NSO Twitter
NSO Facebook
Contact NSO staff
Email NSO staff
Phone NSO staff
NSO Application ProgrammingInterface(API)
NSO Anonymised Microdata Files (AMFs)
NSO Research Microdata Files (RMFs)
Printed publications
Press
Radio
Social Media
Statistical releases
TV
Other (pleasespecify)
NSO Calendar
NSO website
NSO twitter
NSO Facebook
NSO email contact
Press / newspapers
Radio
TV
Other printed publications
Social Media
Other (pleasespecify)
Laptop
Desktop
Mobilephone
Tablet
Printed Media
Other (pleasespecify)](https://image.slidesharecdn.com/ces04-valueofofficialstatistics-170406131350/75/Value-of-official-statistics-Recommendations-on-promoting-measuring-and-communicating-the-value-of-official-statistics-65-2048.jpg)
![66
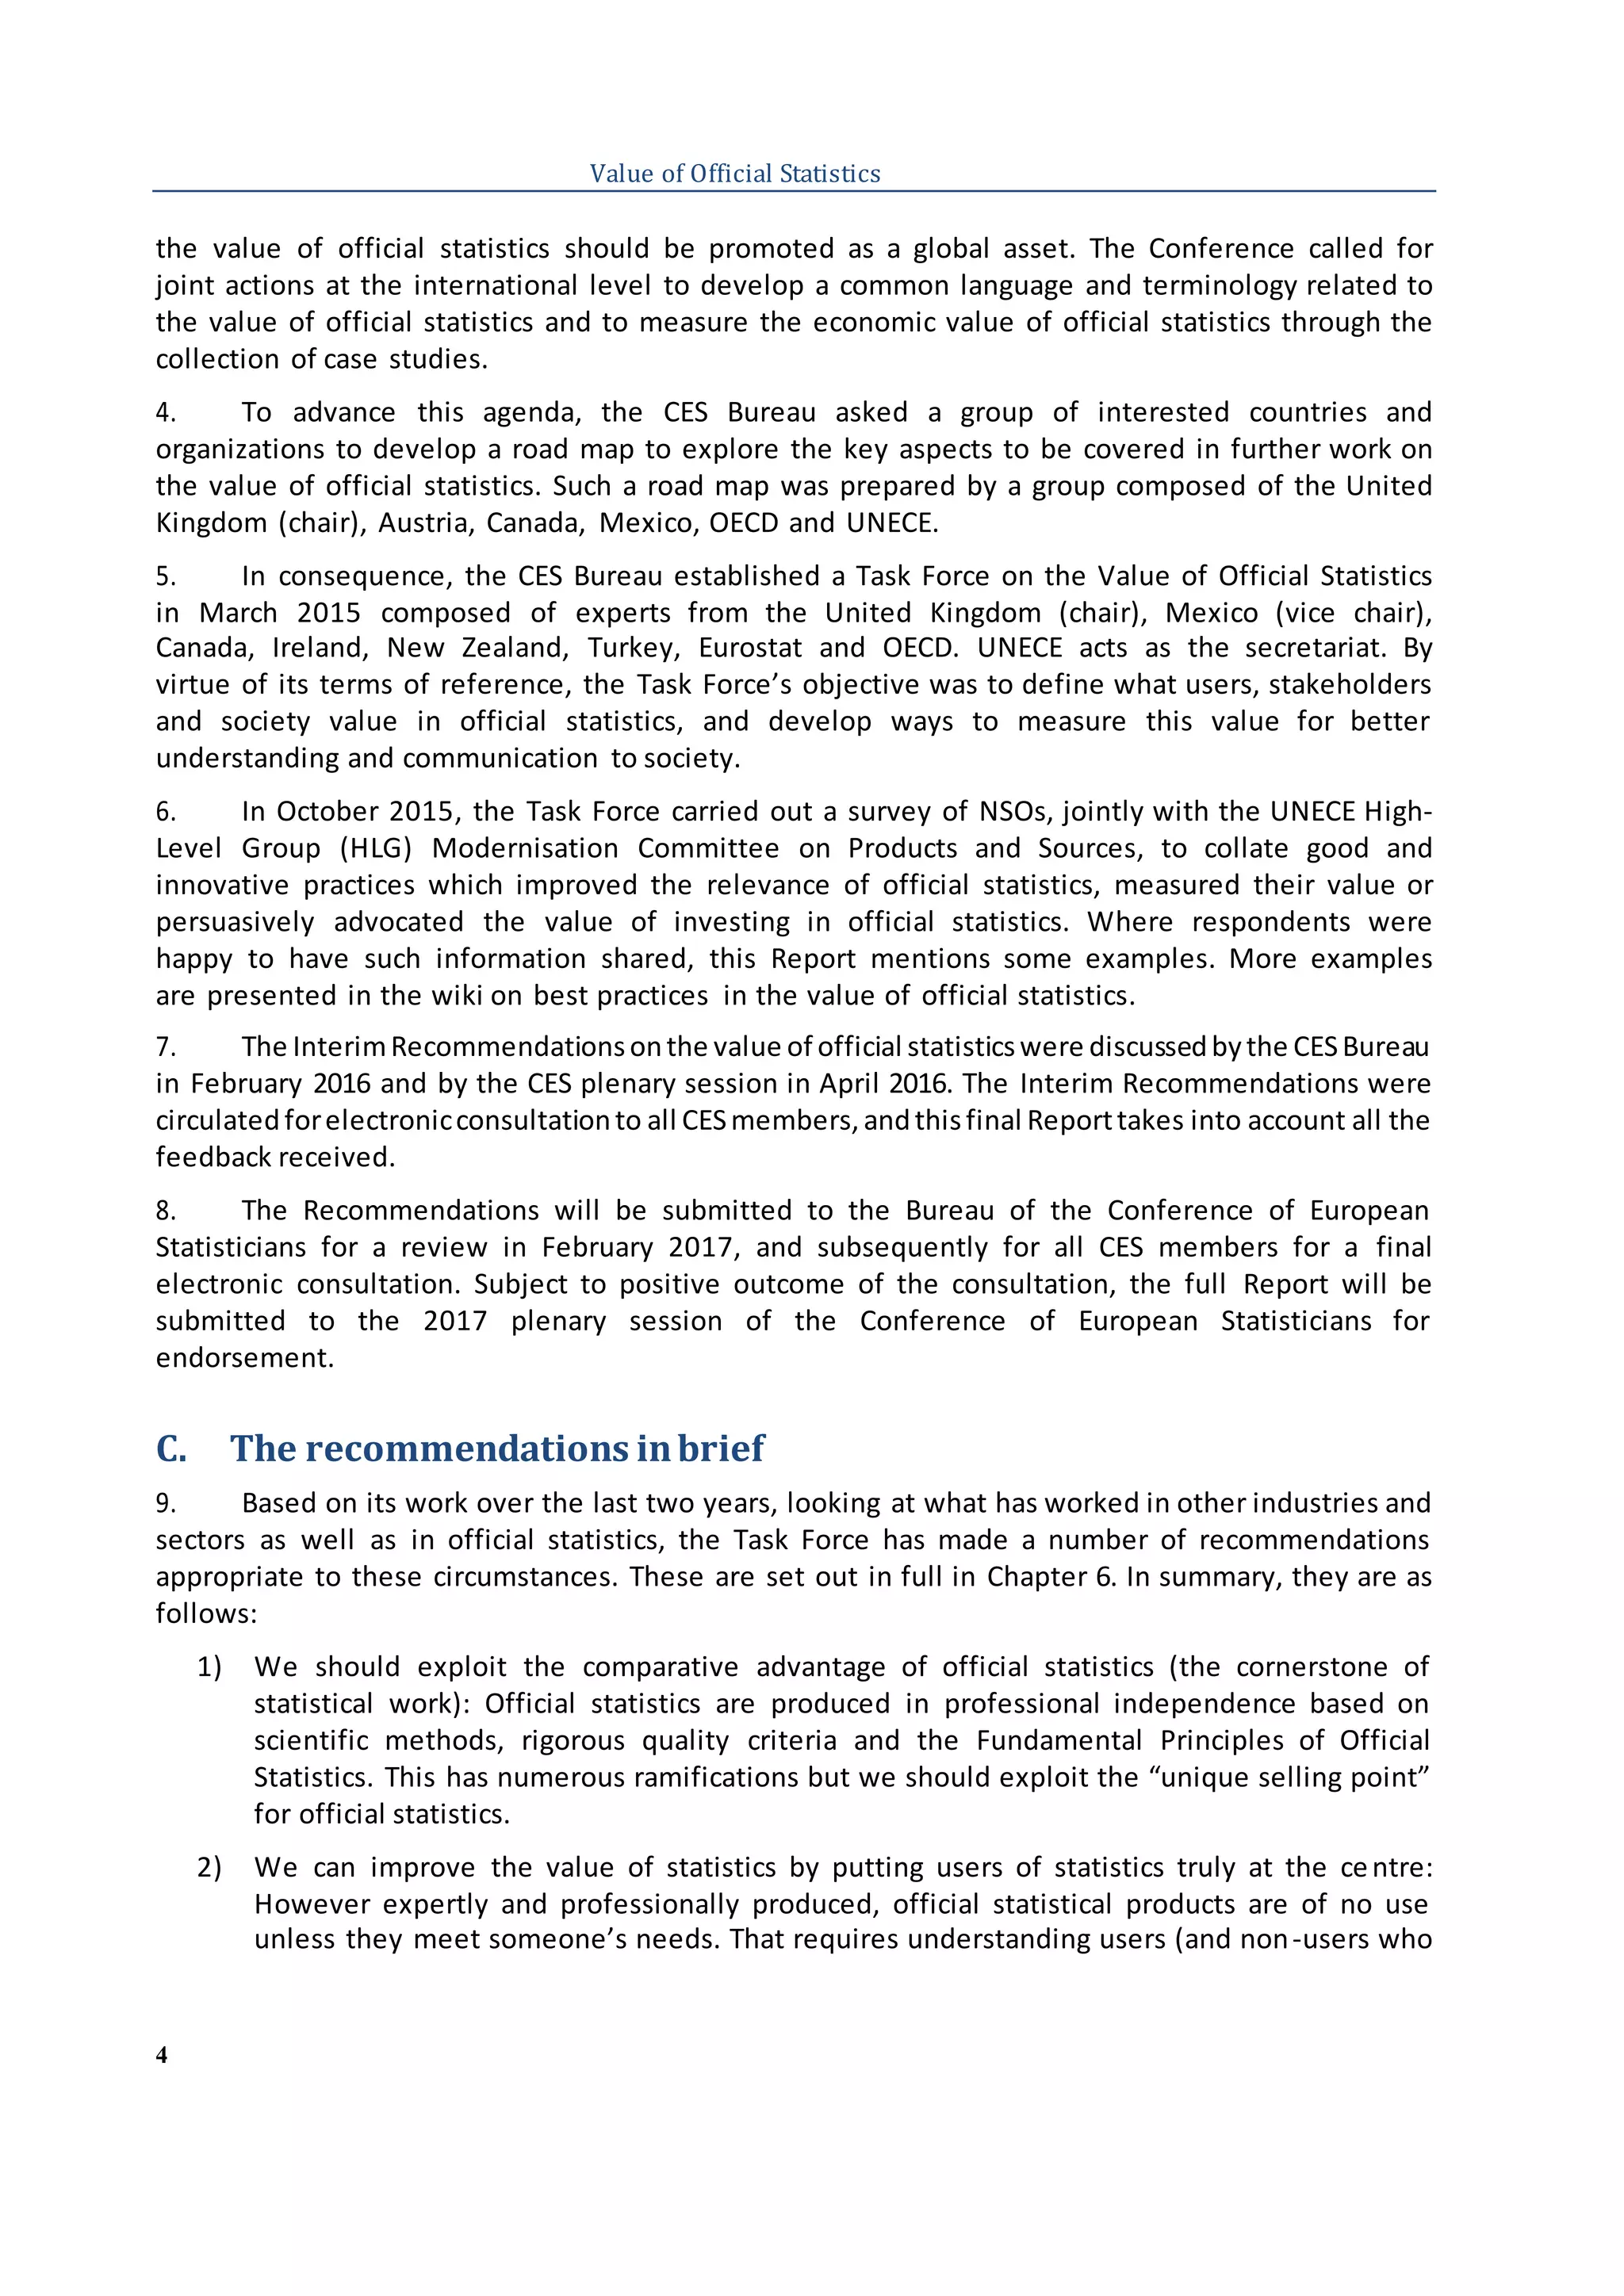
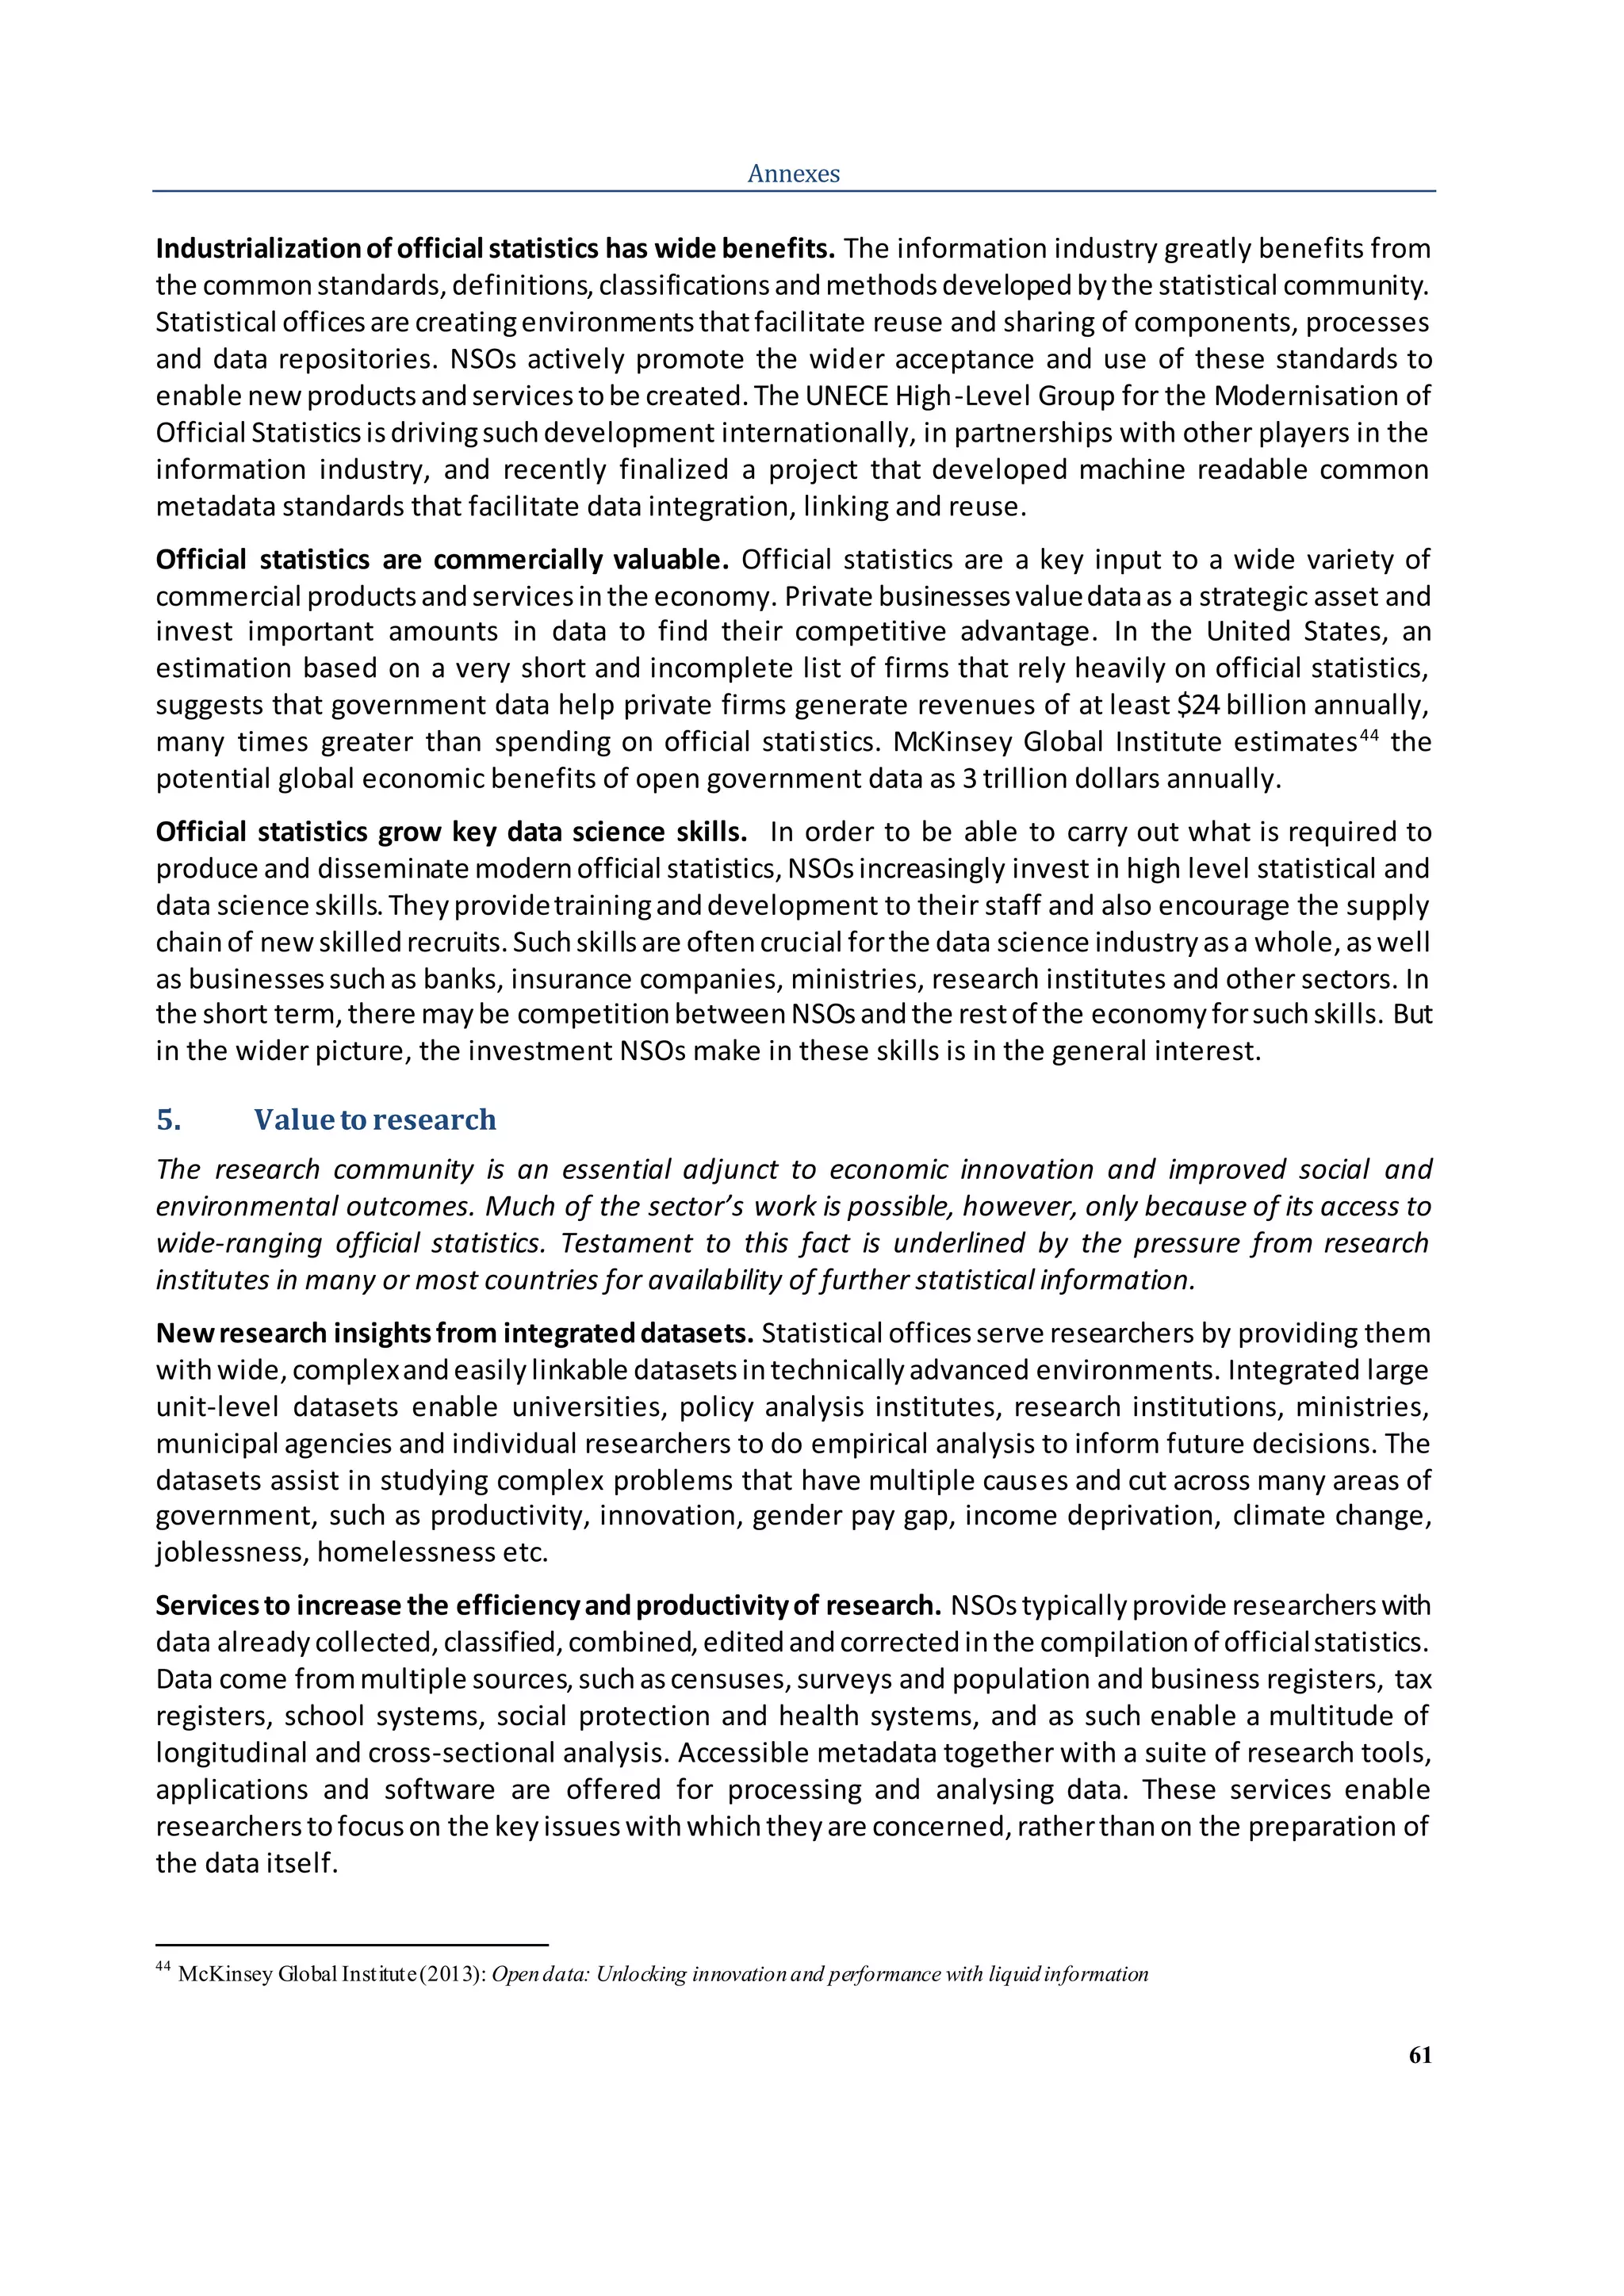
Value of Official Statistics
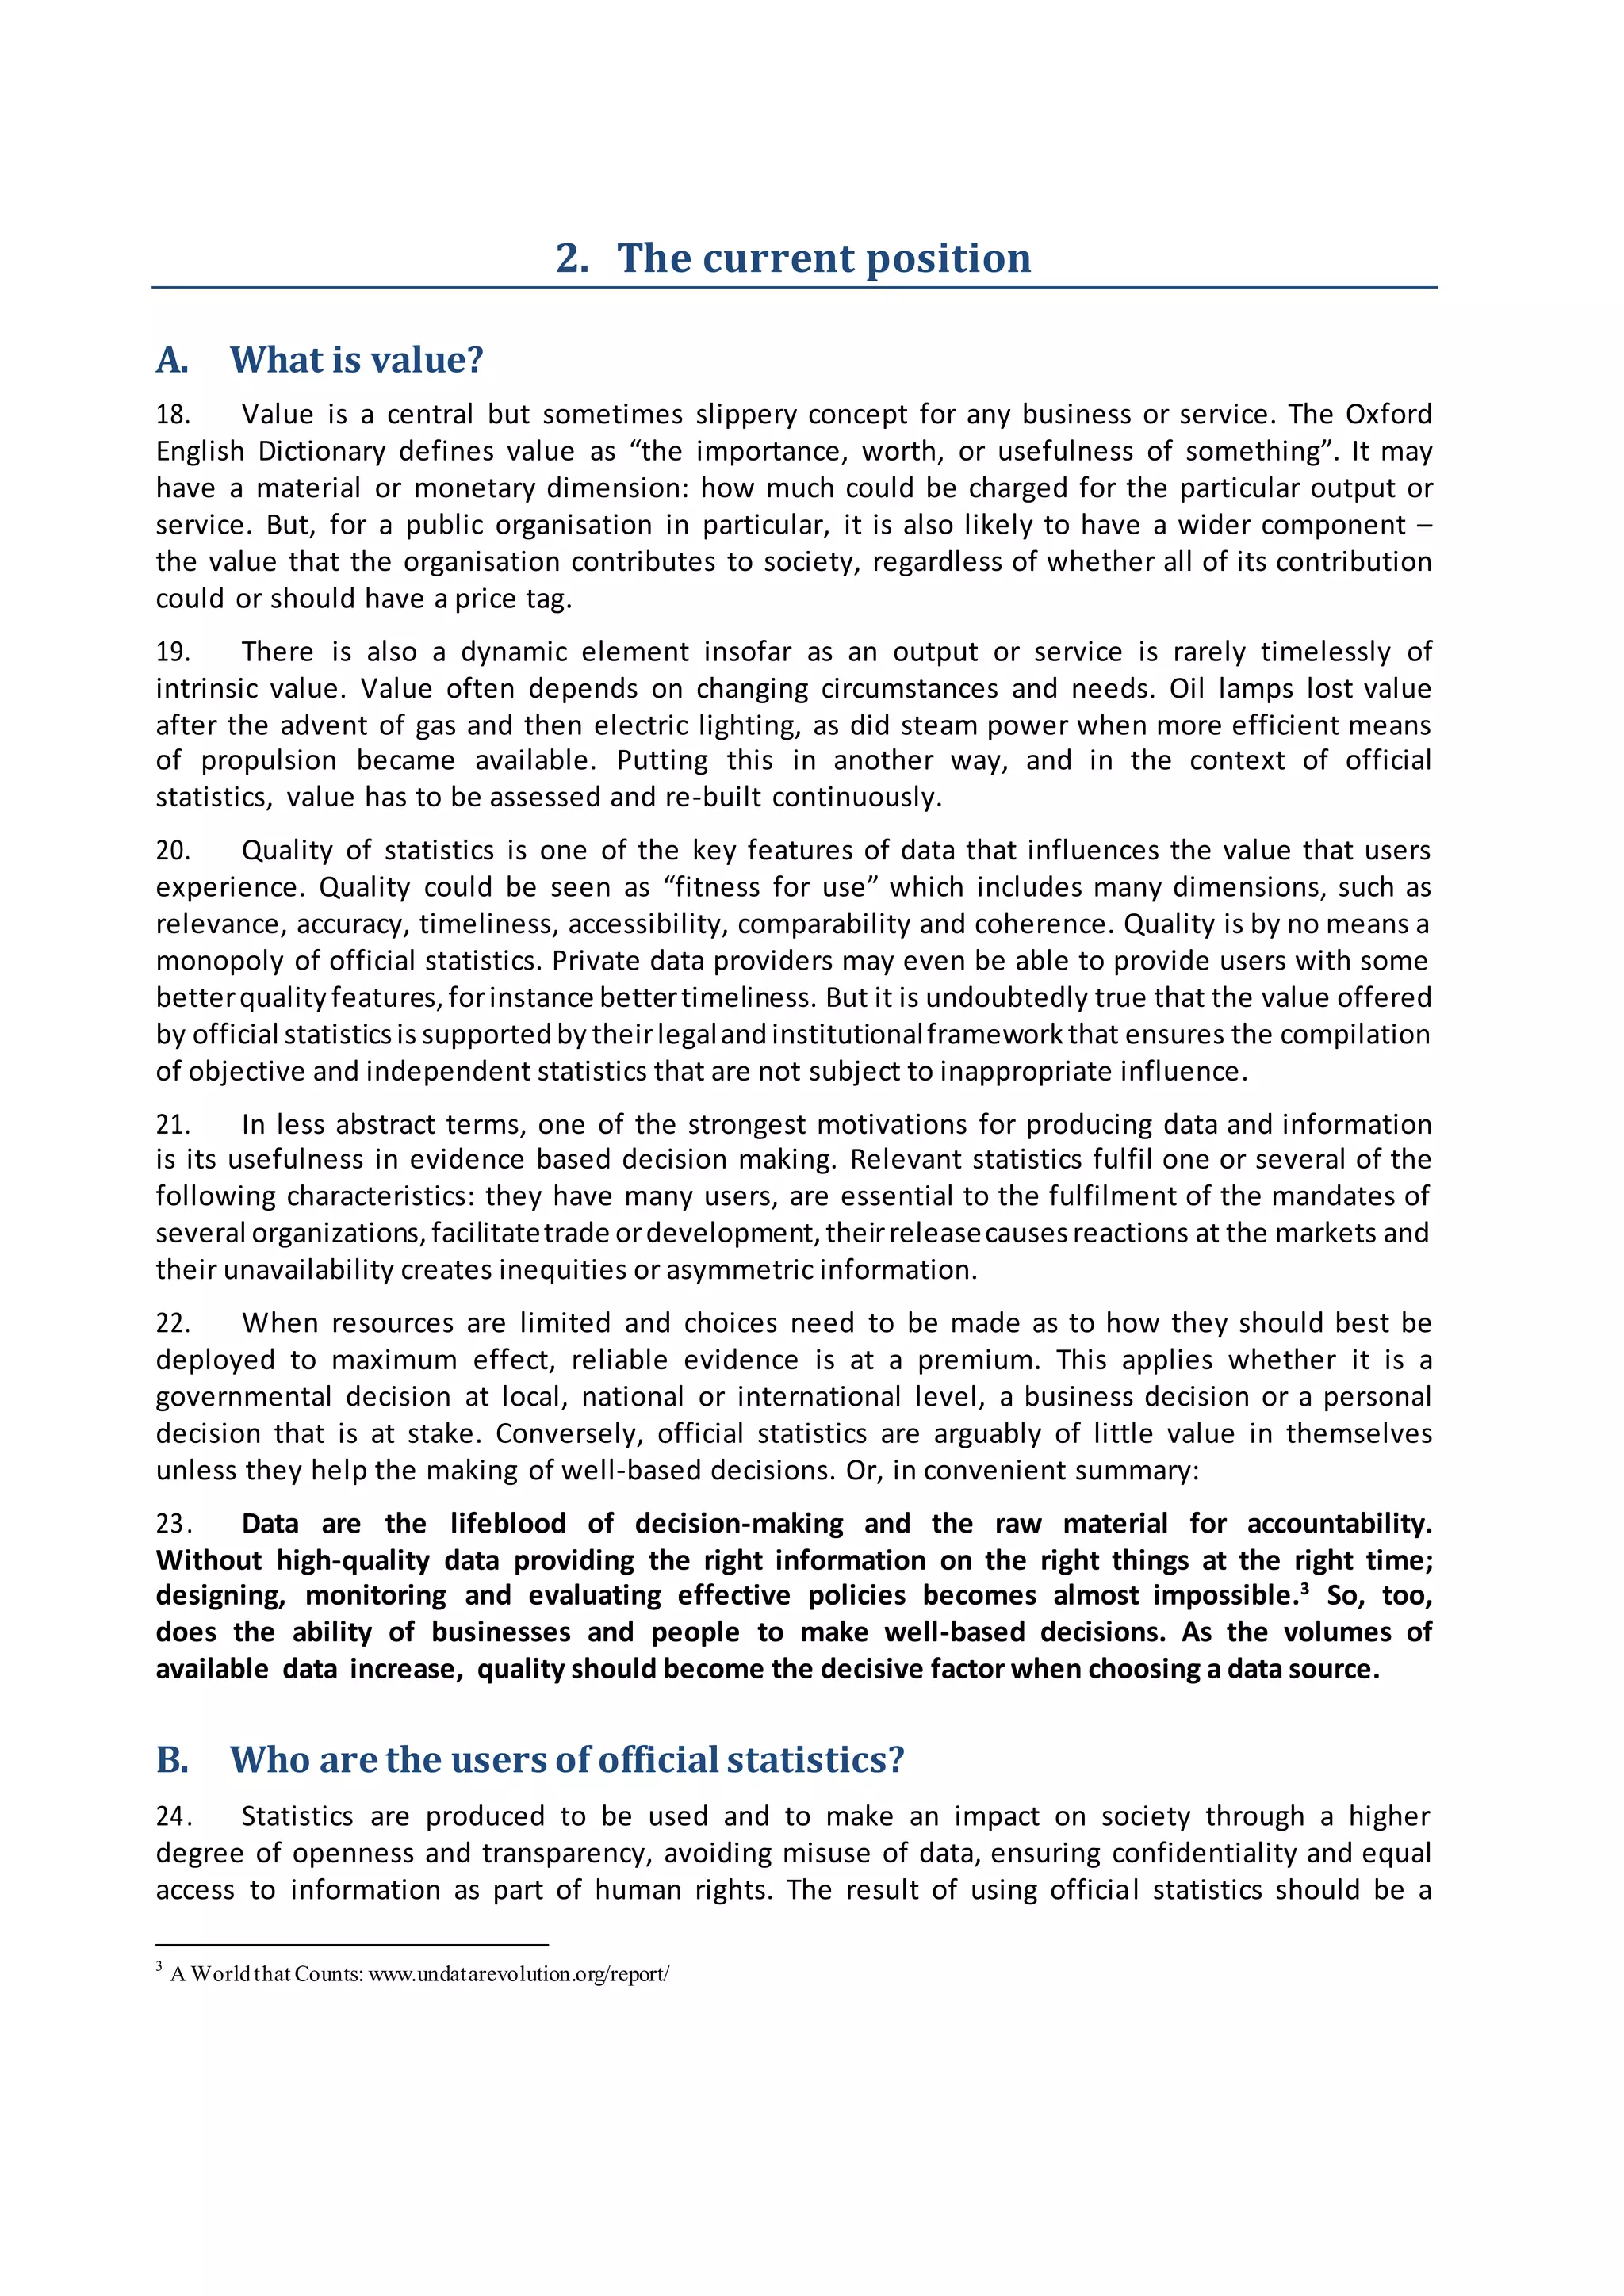
User satisfaction
9. How satisfiedare you with the extentto which the NSO statisticsyou use…
Very
satisfied
Satisfied Neither satisfied
nor dissatisfied
Dissatisfied Very
dissatisfied
Meetyour needs
Are accurate
Are trustworthy
Are free frompolitical interference
Are clearlypresented
Are easyto find
Are easilyunderstood
Are timely
Are detailedenough
Are clearlydocumented
Enable comparisons
Are up to date
Are frequentenough
Are visuallyappealing
[Optional forthe issueswithwhichthe respondentisnotsatisfied]
Please provide us with detailsofsuggested improvementsrelatingto NSO statistics(Q9) in…:
Relevance and innovation
10. To what extentdo you agree withthat the NSO…?
Strongly
agree
Agree Neither agree
nor disagree
Disagree Strongly
disagree
Is independent
Providesaquality customerservice
Has knowledgeableandcompetentstaff
Collectsanddisseminationuseful statistics
Protectsconfidentialityof individual data
Explainsdatasourcesandmethodsclearly
Supportsthe interpretationanduse of statistics
Visualizesinformationwell
Communicatesclearly
Meetsyour informationrequirements
Is active indevelopingnew services
Is activelypresentinSocial Media
Helpspeople understandourcountry
Effectivelyinformspublicdebate
Providesvaluable servicesandstatistics
Is trustworthy](https://image.slidesharecdn.com/ces04-valueofofficialstatistics-170406131350/75/Value-of-official-statistics-Recommendations-on-promoting-measuring-and-communicating-the-value-of-official-statistics-66-2048.jpg)
![67
Annexes
11. Please tell us:
What youthinkthe NSO is doingwell?
What youthinkthe NSO coulddobetter?
What the NSO shoulddo to informyourwork
that itdoesnot currentlydo?
What the NSO currentlydoesthatyou
considerobsoleteornotuseful?
What are the mostimportant outcomesor
benefits resultingfromusingourstatisticsor
services?
12. Please selectthe choice that applies:
NSOstatisticsandservicesare Dropdownlist for mywork or studies
13. Have NSO’s statisticsand serviceshelpedinformany decisionsorpoliciesmade by you (or by your
organization) over the last years?
Yes No Don’tknow/NA
[If yes] Please provide examples:
14. Do you thinkNSO statistics differfrom otherdata and statistics,and how?
Yes No
[If yes] Please explainbrieflythe difference:
15. The NSO as country X’s national statistical office isresponsible forcollectingdata and producing
official statisticsthat helppeople to understandbetter theircountry – its population,resources,
economy,society,environment,culture etc. The NSOconducts about X studieson all aspects ofour
lives.
15. Wouldyou say the NSO work
makes a
contributionto the wellbeingandlife of inour country?
Awareness and trust
16. How well informedare you about the work ofthe NSO? Dropdownlist
Essential
Important
Background information
Of minor importance
Of no use
Very well informed
Fairly well informed
Not very well informed
Not at all informed
Don’t know/not sure
major
moderate
little
no](https://image.slidesharecdn.com/ces04-valueofofficialstatistics-170406131350/75/Value-of-official-statistics-Recommendations-on-promoting-measuring-and-communicating-the-value-of-official-statistics-67-2048.jpg)
![68
Value of Official Statistics
17. To what extentdo you trust the NSO statistics? Dropdownlist
18. How wouldyou describe your overall viewof the NSO? Dropdownlist
19. How likelyisit that you would recommendthe NSOstatistics and
servicesto a friendor a colleague (usinga scale from 0 to 10)?
Selectavalue
Specific products and services
20. How satisfiedare you with the followingNSOproducts and services?
Very
satisfied
Satisfied Neither satisfied
nor dissatisfied
Dissatisfied Very
dissatisfied
n.a.
Articlesandstorieson statistics
Online statistical releases
Maps and infographics
Methodological descriptions
NSOTwitter
NSOFacebook
NSOnewsalerts
NSOwebsite
NSOdata explorer
Publicuse filesand microdata
Release calendar
etc.
[Optional] Pleaseprovide uswithdetailsof suggestedimprovementsrelatingto NSO products and
services(Q19)?
Additional comments:
21. What, if anything else,wouldyou like to say
about the NSO or its statistics?
_________________
Trust them greatly
Tend to trust them
Neither trust nor distrust
Tend not to trust them
Distrust them greatly
Don’t know/not sure
I would speak highly of NSO, without being asked
I would speak highly of NSO, if someone asked
I would be neutral about NSO; if someone asked
I would be critical of NSO; if someone asked
I would be critical of NSO; without being asked](https://image.slidesharecdn.com/ces04-valueofofficialstatistics-170406131350/75/Value-of-official-statistics-Recommendations-on-promoting-measuring-and-communicating-the-value-of-official-statistics-68-2048.jpg)