Market volatility is part of investing in stocks. But how often does the market turn down? What is the long term impact? For buy-and-hold investors, it is important to have some perspective on the vulnerabilities and resiliency of the stock market.
10 Key principals of using evidence investing to improve your odds of success in reaching your goals. This includes embracing the market and using diversification.
The Cogent Advisor, and independent wealth manager in Chicago helping successful professionals simplify their complex financial lives and reach their goals. 312-382-8388. www.thecogentadvisor.com.
Know more on the benefits of investing in ICICI Prudential Quant Fund:
● Limited Human Intervention to avoid any biases.
● Diversification across various sectors, styles and businesses.
● Systematic approach of investing by combining investing experience and avoiding human error.
● Passive Investing through a model using a combination of factors.
● Team with prior experience in managing quantitative models for asset allocation.
See the Chart of Indian IIP Trend in Narnolia Securities Limited Market Diary 14.02.2014
http://www.narnolia.com/index.php/category/archieve/market-diary/
What are realistic expectations for long-term capital market returns, and how are they forecast? Check out this month's Investment Insights for a historical look.
MarketTrend Advisors - Coping With Bear Markets 023009Garrett Beauvais
This presentation provides a historical review of the returns of prior bull markets and bear markets and recommends an active investment strategy to capture gains and avoid losing money during secular bear markets.
As there has been a trend of performance concentration across market cycles, different investment styles may perform at different phases of a market cycle. Our Market Outlook for November 2020
Diversify into debt funds with ICICI Prudential Floating Interest Fund and aim to generate income by investing in floating rate instruments while maintaining the optimum balance of yield, safety and liquidity.
FIN 430 — Finance Theory and PracticeProject AssignmentsCalculat.docxssuser454af01
FIN 430 — Finance Theory and PracticeProject Assignments
Calculating theWeighted Average Cost of Capital (WACC)
foryour Company
For use in Conjunction with the Firm Valuation Project
First ensure that you have read relevant pages in the text. Some important sections would include the following, but you may also double-check the references in the text by using the index [see: Cost of Capital and Target (optimal) Capital Structure, etc.]:
The important Chapter in the text is the one entitled "The Cost of Capital," – with a particular focus on the section entitled “The Weighted Average Cost of Capital” and the section “Four Mistakes to Avoid” at the end of the chapter.
The WACC formula discussed below does not include Preferred Stock. Should your company use PS, be sure to adjust the equation for it, and see the section in the chapter on the Cost of Preferred Stock.
The WACC formula that we use is:
WACC = wdrd(1-T) + wsrs
We need to know how to calculate:
1. rsthe cost of common equity. Use the Security Market Line (SML) – this is why you learn how to calculate a company’s beta and also why you learn how to find the appropriate risk-free rate and market-risk premium. For a review, see the section the text, The CAPM Approach.
2. The weights (wd and ws – note that: wd + ws = 1; so you only have to calculate one of them). We need to calculate the weight of debt and the weight of equity (for the cost of debt, this simply means: what proportion of the firm’s financing is by debt?). There is a lot to say here, simplified as Theory 1, Theory 2 and Practice:
a. Theory 1: Theory says that we should use the target weights along with the market values of both debt and equity (see the Four Mistakes to Avoid). But the market value of debt is typically difficult to calculate, because we need to know the YTM (which is rd) for all of the company’s debt, but we cannot calculate the YTM without having the current prices of the company’s outstanding bonds, and most company’s bonds do not trade (i.e., they will not have up-to-date or current prices – remember how to calculate the price (value) of a bond on your calculators?!). As a result, at least for the group project, we go to Theory 2.
b. Theory 2: Theory also says that we should use the TARGET weights, but this is a management decision, and as “outsiders” we do not have access to the thoughts of the CFO or CEO. So we should look instead to the historical pattern of the use of debt (mix of debt and equity), and this is one reason that you should have about 10 years of financial data.
c. Practice: Since we cannot “work” according to the strict theory of finance, we have to estimate the relevant weights. As a result, we will use the formula:
wd = Book Value of Debt / [Market Value of Equity + Book Value of Debt]
The book value of debt is calculated by adding up ALL of the debt on the balance sheet. This will typically be the sum of Notes Payable, Current Por ...
FIN 340 Final Project Scenarios and Tables You will u.docxcharlottej5
FIN 340 Final Project Scenarios and Tables
You will use these scenarios and tables to complete the final project.
Client 1:
Ezra, age 26, is single. However, he is dating and preparing to get engaged. He will need roughly $5,000 for an engagement ring almost immediately, and expects
he will need $10,000–$15,000 for the wedding in the next 12–24 months. He is currently employed and earns about $70,000 a year in salary. This salary is
enough to cover all his taxes and normal living expenses of approximately $4,800. This leaves him with about $1,000 in savings each month ($350 to 401K, $650
to savings). He has been able to save roughly $15,000 to date in a 401K plan from work and about $20,000 in cash savings. His 401K plan has been invested 100%
in the stock market, including some sector-specific funds. His other savings have been in interest-bearing savings and cash substitutes such as money market
funds. He recently received a windfall of $60,000, and this prompted him to come to you for some advice. The following are few of Ezra’s comments to help
guide your thoughts:
1. “I understand I am young, so I need to take on as much risk as I can.”
2. “I am willing to lose 30–40% on my invested capital if the return is commensurate.”
3. “I do like to have a decent sized cushion in the bank in case something happens at my job.”
4. “I don’t foresee my risk tolerance changing after I get married.”
5. “Do you have any good stock tips?”
Client 2:
Jacob and Rachel, 53 and 52 respectively, are married with four children. Two of the children are currently in college, and two are in high school. They expect the
other two children to attend college. The couple has done relatively well for themselves and earn roughly $275,000 before tax between the two of them, which
equates to $190,000 after taxes. They live well below their means, and this should allow them to cover all of their children’s college expenses out of pocket, but
it will not leave much for them to save over the next six to eight years. Through savings and portfolio growth, they have managed to accumulate $900,000. To
this point, they have been moderately aggressive (70–75% equities) with their portfolio, but they feel that they need to begin preparing the portfolio for partial
retirement in eight years, and full retirement in 13 years.
1. “I know we still need to be somewhat aggressive—we could live until we’re 90—so we need to plan for some growth even in retirement.”
2. “We definitely can’t afford to take a big hit in our portfolio. We don’t have enough time to recover.”
3. “Our jobs allow us to work part-time in retirement, and we will probably do so as long as we are able.”
4. “What do bond yields look like today?”
5. “I think we’ll need to draw on 3–5% of our portfolio in retirement. We’d like to earn enough income from the portfolio to cover that.”
CAPM Inputs:
Market Return 9%
Risk-free Rate 0.75%
Stock Analysis Table:
.
1. FIN 3033.002
Fall 2016: Paper 3&4
1
Valuation of Costco
Nicholas Nguyen
Costco (COST) is the largest membership only warehouse club within the United States that aims to keep
its price low for its member by selling in wholesale. One can get virtually anything from the warehouse
club from a 64 ounce tub of coconut oil, to a 64 karat diamond ring. This paper will aim to value the
stock through using several valuation models: the Dividend Discount Mode, Capitalized Earnings Model,
and the H-model. To do so a discount rate must be calculated first; we will do so through using the
Sharpe Capital Asset Pricing Model, otherwise known as CAPM Model. The first part of this paper will go
over the later mentioned and the second part will go over the actual valuation of the stock.
Risk Free Rate
To find the discount rate (Ke), we need
three components. This first paragraphs
deals with how to determine the Risk Free
Rate (Rf), one of the three inputs for Ke.
Typically the 10 year Treasury yield is used
for the risk free rate, however due to recent
economic conditions and current market
trends, it is believed that the yield is too
artificially low for it to be viable. This plus
the fact that the Volatility Index (VIX) is
currently below average at approximately
12.96, makes sense for us to use a
normalized rate to get a higher Rf with a
lower Market Risk Premium (MRP) since the
market is not too concerned with risk
currently. Therefore to account for this we
will be using Professor Sweet’s normalized
theory of the 10yr treasury rate.
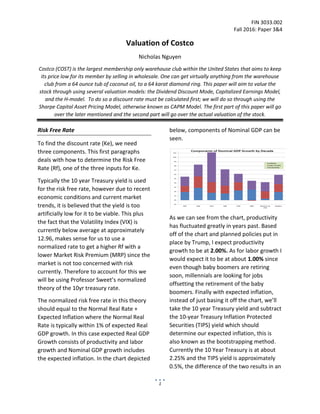
The normalized risk free rate in this theory
should equal to the Normal Real Rate +
Expected Inflation where the Normal Real
Rate is typically within 1% of expected Real
GDP growth. In this case expected Real GDP
Growth consists of productivity and labor
growth and Nominal GDP growth includes
the expected inflation. In the chart depicted
below, components of Nominal GDP can be
seen.
As we can see from the chart, productivity
has fluctuated greatly in years past. Based
off of the chart and planned policies put in
place by Trump, I expect productivity
growth to be at 2.00%. As for labor growth I
would expect it to be at about 1.00% since
even though baby boomers are retiring
soon, millennials are looking for jobs
offsetting the retirement of the baby
boomers. Finally with expected inflation,
instead of just basing it off the chart, we’ll
take the 10 year Treasury yield and subtract
the 10-year Treasury Inflation Protected
Securities (TIPS) yield which should
determine our expected inflation, this is
also known as the bootstrapping method.
Currently the 10 Year Treasury is at about
2.25% and the TIPS yield is approximately
0.5%, the difference of the two results in an
2. FIN 3033.002
Fall 2016: Paper 3&4
2
expected inflation of 1.75%. Thus the
following is the normalized Risk Free Rate:
10-Yr Treasury Yield Normalized= 2.00%
(Productivity) + 1.00% (Labor Growth) +
1.75% (Expected Inflation) - 1.00%
(Historical Reflection) =3.75%
Market Risk Premium
The next input we will be discussing is the
Market Risk Premium (MRP). This can be
defined by Market Risk Premium=
Expected Returns on Stocks – Risk Free
Rate. To figure out MRP we will use the
Implied Approach. When using the implied
approach, expected return on stocks is
equal to the required return on stocks. In
relation to that, Expected Return on Stocks=
Current Dividend Yield + Expected Earnings
Growth. The Current Dividend Yield can be
found using the S&P500 yield which is
currently at about 2.1%. As for Expected
Earnings Growth, that is a function of
Nominal GDP Growth which was a function
of Productivity, Growth Labor, and Expected
Inflation. With these numbers already
found previously when determining the Risk
Free Rate, we can compute our MRP.
Expected Return on Stocks= 2.1%
(Dividend Yield) + 2.00% + 1.00% + 1.75%=
6.85%
Market Risk Premium= 6.85% - 3.75% =
3.1%
Beta
This is the last input that we must find for
determining Ke. However Beta is not just a
value that is calculated, but rather one that
is forecasted to reflect the risk of a
company. When forecasting Beta we
consider four factors which are Revenue
Sensitivity, Operating Leverage, Financial
Leverage, and Historical Beta.
Revenue Sensitivity
When considering Revenue Sensitivity for
Costco, we can tell that the company is a
defensive stock since it is a department
store; because it is a department store, it is
viewed as less risky because of its more
stable and constant earnings and is less
sensitive to changes in the market.
Therefore meaning it should have a low
beta of less than 1.
Operating Leverage
Costco is more geared towards having a
variable cost structure, meaning its
operating leverage is low. A reasoning
behind this low operating leverage is that
Costco is very big on inventory since it is a
wholesale department store; because of
this Costco has a higher variable cost then
fixed cost due to the constant change of
inventory depending on seasonality, price,
and demand. This is supported in the chart
as you can see where their Gross Margin
and Net Margin Standard Deviation is well
below average, virtually almost 0 at 0.19
and 0.16 respectively, meaning it is
extremely stable. This implies a Beta that is
well below 1.
3. FIN 3033.002
Fall 2016: Paper 3&4
3
Financial Leverage
Costco debt to equity is quite average, in
fact almost exactly the average of the
market at 57.99 vs the market’s 57.88. All
this translates too is that basically the
amount of debt that Costco uses to acquire
additional asset, is on par with that of the
market. With the firm using the amount of
debt to finance its operations not that much
deviated from the median, this also implies
a Beta of below 1.
Historical Beta (3-Yr rolling)
In the chart above, I calculated the 3-Year
rolling beta for Costco. As we can see
Costco’s beta has been well below 1 for a
majority of the year. The only times where
the stock’s beta was over 1 besides from its
start date, was in 1999-2001 and from
2005-2007. Both times where major events
were occurring, first the Dot.com boom and
the Financial Crisis. However even with this,
all the data points to Costco of having a
beta below 1.
Factors Implies
Revenue Sensitivity <1
Operating Leverage <1 almost =1
Financial Leverage <1
Historical Beta <1
With all of the factors considered, I would
have to say that a beta of about 0.9 would
be sensible for a company like Costco.
Discount Rate
Now that we have gathered all the
necessary inputs for the discount rate, to
calculate the discount rate you take the Risk
Free rate plus the beta times the Market
Risk Premium.
Ke= Rf + Beta * MRP
Ke= 3.75% + 0.9 * 3.1%= 6.54%
Valuation Inputs
Now that we have determined a discount
rate for COST, we begin figuring out the
various inputs for the three different
valuation models we will be using as
mentioned before. Below are the inputs
needed to value a stock:
Ke 6.54%
Dividend 0 (ttm) $1.80
EPS 0 (ttm) $5.33
Long-Term Growth
Rate
4.75%
Inflation Assumption 1.75%
Short Term Growth
Rate
10%
Time Period for ST to
LT (Half Life)
4 Years
-0.50
0.00
0.50
1.00
1.50
2.00
8/1/1989
8/1/1992
8/1/1995
8/1/1998
8/1/2001
8/1/2004
8/1/2007
8/1/2010
8/1/2013
8/1/2016
3yr Rolling Beta
4. FIN 3033.002
Fall 2016: Paper 3&4
4
A majority of the values needed were
already provided by Yahoo Finance or
values that we had already calculated in the
previous part of the paper. However as for
figuring out the short term growth rate and
the time period, I used a combination of the
PEG ratio approach (PE Ratio/ PEG Ratio),
sustainable growth approach
(ROE*Retention; Retention= 1-Div/EPS),
and the historical EPS growth to estimate a
ST growth rate and some historical and
market data to estimate the time period.
My calculations for the mentioned
approach are as follows:
PEG Ratio: 28.55/2.491
= 11.5%
Retention= 1-(1.80/5.33)= 66.23%
Sustainable Growth: 20.50%*66.23%=
13.58%
With the historical EPS growth model
below, and the other ratio in mind, I project
the short term growth rate to be about 10%
2
1
Purple highlights indicate figures from Yahoo
Finance
A possible reason for this is because I
noticed that Costco Short Term growth is
stronger than that of its Long Term
Growth. This can be due to a number of
reasons, however I believe that the most
important one is that COST margin on its
merchandise is so slim that instead a
majority of their net revenues come from
its membership fees, membership growth
and renewal rates. So since a majority of
their revenues come from these metrics, it
would make sense for their Short Term
Growth to be stronger than Long Term
since it is more subjective to membership
and their fees/renewal fees COST receive
from them.
In addition to this COST plans to continue
expanding their warehouses, especially
internationally in hopes to rival competition
Amazon. They mentioned that they would
like to push for at least 20 new stores a year
if not more. Currently COST has
approximately 700 warehouses worldwide
in 9 countries and is pushing into France
and Iceland within the upcoming year. In
light of this phenomenon, I estimated the
time period for ST to LT growth will be
about 8 years, which translate to a half-life
of 4 years for purposes of the input. This 8
years is a reasonable estimate since it gives
time for COST to expand out internationally,
but as the company begins to slow down on
expansion, COST will have to find other
ways to beat out e-commerce.
2
Was not able to change graph to exclude abnormal
growth data from ’97-’00 without compromising the graph
0%
10%
20%
30%
40%
50%
1997
1999
2000
2002
2003
2005
2006
2008
2009
2011
2012
2014
2015
COST EPS Growth
Rolling 3-Yr Rolling 5-Yr
Rolling 10-Yr
5. FIN 3033.002
Fall 2016: Paper 3&4
5
Dividend Discount Model
Also known as the Gordon Growth Model,
this is one of the most recognized models
when valuing a stock. The model has the
assumption that growth in dividends is
equivalent to growth in earnings. Since the
model essentially assumes a perpetual
growth annuity, it is better suited for
companies that are more mature and
developed with lower and moderate growth
rates.
DDM Value = Div0 * (1 + g) / (ke – g)
1.80*(1+.0475)/(.0654-.0475)= $105.34
Capitalized Earnings Model
This capitalized earnings model is one that
Professor Sweet theorized and is slightly
different from the original model. He
believes that if a firm pays out 100%
retaining 0% of its earnings, its earnings will
grow with inflation. Revenues and expenses
both increase with inflation and
depreciation expense should provide
enough cap ex cash flow to maintain
existing capacity.
CEM Value = EPS0 * (1 + inflation) / (ke –
inflation)
5.33*(1+.0175)/(.0654-.0175)=$113.22
H Model
The H Model is essentially the Dividend
Discount Model, but takes into factor the
added value for the higher growth for the
next few years. In more technical terms, the
model assumes that there is initial high rate
of growth and then eventually it begins to
stagnate into a more normal and stable
growth rate in perpetuity. This model tends
to be less accurate when the growth
periods are longer and when there is a
significant difference between ST and LT
growth.
H Model Value = [Div0 * (1 + g) + Div0 * H *
(gST – gLT)] / (ke – gLT)
[1.80*(1+.0475)+1.80*4*(.10-.0475)]/(.0654-
.0475)= $126.45
Conclusion
Type of
Model
Price
Valuation
Recommendation
DDM
Model
$105.34 Sell/Reduce
CEM
Model
$113.22 Sell/Reduce
H Model $126.45 Sell/Reduce
Costco is currently trading at $151.74,
which is a higher value than all three of my
valuation figures. After reviewing some
recent earnings report and researching
more into the operations of the company, I
found that sales growth within the company
has been sluggish in recent quarters. In
addition to that, for the price that it is
trading at currently versus its performance,
people view COST as an expensive stock.
Therefore based off of my valuation and
additional research that supports the
negative outlooks on Costco, I would
recommend a sell on the stock because it is
overvalued.