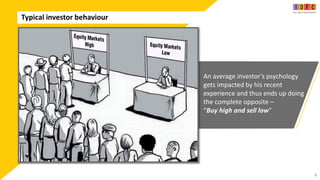
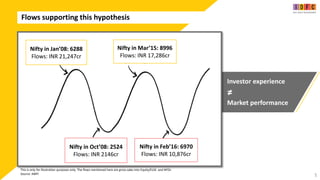
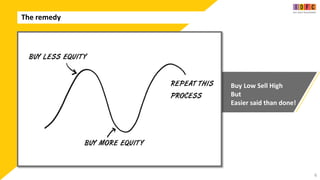
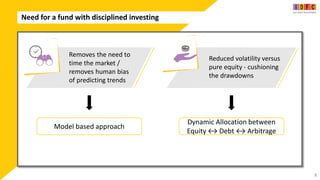
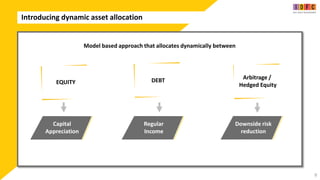
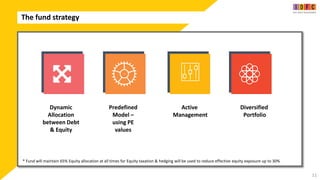
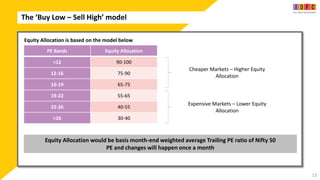
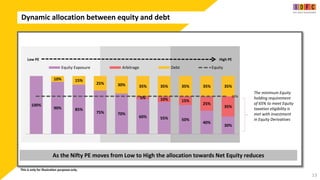
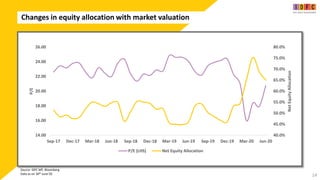
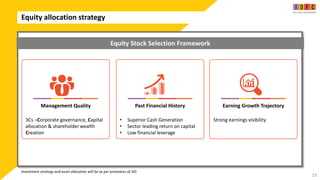
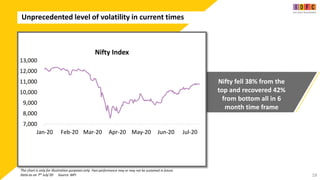
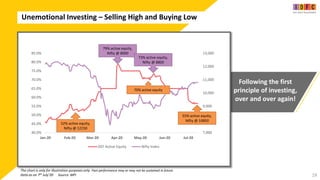
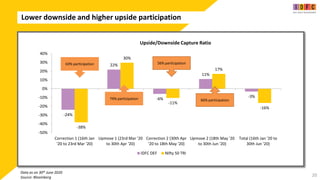
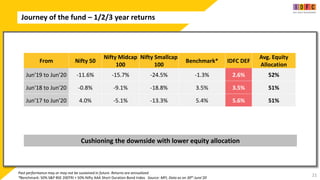
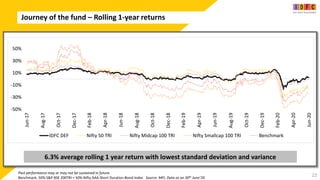
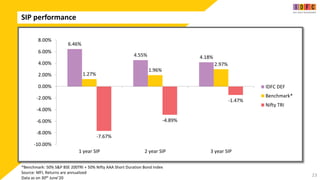
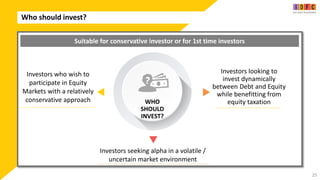
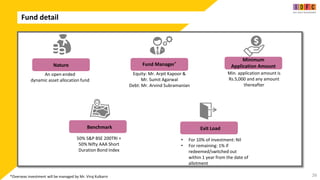
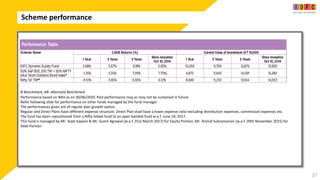
1
UNEMOTIONAL INVESTING
IN VOLATILE TIMES –
IDFC DYNAMIC EQUITY FUND
Contents
2
1. Investor behaviour & Investment solution
2. Disciplined approach of IDFC Dynamic Equity Fund
3. Does it help to be Dynamic
4. More about the Fund
3
Investor Behaviour & Investment Solution
Typical investor behaviour
4
An average investor’s psychology
gets impacted by his recent
experience and thus ends up doing
the complete opposite –
“Buy high and sell low”
Flows supporting this hypothesis
5
Investor experience
≠
Market performance
Nifty in Jan’08: 6288
Flows: INR 21,247cr
Nifty in Mar’15: 8996
Flows: INR 17,286cr
Nifty in Oct’08: 2524
Flows: INR 2146cr
Nifty in Feb’16: 6970
Flows: INR 10,876cr
This is only for illustration purposes only. The flows mentioned here are gross sales into Equity/ELSS and NFOs
Source: AMFI
The remedy
6
Buy Low Sell High
But
Easier said than done!
Nifty in Feb’16: 6970
Why you should buy more when markets are low
7
Past Return
≠
Future Return
The chart is only for illustration purposes only. Past performance may or may not be sustained in future.
Source: MFI
Nifty in Oct’08: 2524
Need for a fund with disciplined investing
8
Removes the need to
time the market /
removes human bias
of predicting trends
Reduced volatility versus
pure equity - cushioning
the drawdowns
Model based approach
Dynamic Allocation between
Equity ↔ Debt ↔ Arbitrage
a
Introducing dynamic asset allocation
9
Model based approach that allocates dynamically between
EQUITY DEBT Arbitrage /
Hedged Equity
Capital
Appreciation
Regular
Income
Downside risk
reduction
10
Disciplined approach of IDFC Dynamic Equity
Fund
The fund strategy
11
Dynamic
Allocation
between Debt
& Equity
Predefined
Model –
using PE
values
Active
Management
Diversified
Portfolio
* Fund will maintain 65% Equity allocation at all times for Equity taxation & hedging will be used to reduce effective equity exposure up to 30%
The ‘Buy Low – Sell High’ model
12
Equity Allocation is based on the model below
PE Bands Equity Allocation
<12 90-100
12-16 75-90
16-19 65-75
19-22 55-65
22-26 40-55
>26 30-40
Equity Allocation would be basis month-end weighted average Trailing PE ratio of Nifty 50
PE and changes will happen once a month
Cheaper Markets – Higher Equity
Allocation
Expensive Markets – Lower Equity
Allocation
Dynamic allocation between equity and debt
13
100%
90% 85%
75% 70%
60% 55% 50%
40%
30%
5% 10% 15%
25%
35%
10% 15%
25% 30% 35% 35% 35% 35% 35%
65%
Equity Exposure Arbitrage Debt Equity
Low PE High PE
As the Nifty PE moves from Low to High the allocation towards Net Equity reduces
The minimum Equity
holding requirement
of 65% to meet Equity
taxation eligibility is
met with investment
in Equity Derivatives
This is only for illustration purposes only.
Changes in equity allocation with market valuation
14
Source: IDFC MF, Bloomberg
Data as on 30th June’20
40.0%
45.0%
50.0%
55.0%
60.0%
65.0%
70.0%
75.0%
80.0%
14.00
16.00
18.00
20.00
22.00
24.00
26.00
Sep-17 Dec-17 Mar-18 Jun-18 Sep-18 Dec-18 Mar-19 Jun-19 Sep-19 Dec-19 Mar-20 Jun-20
Net
Equity
Allocation
P/E
P/E (LHS) Net Equity Allocation
Equity allocation strategy
15
Management Quality Past Financial History Earning Growth Trajectory
3Cs –Corporate governance, Capital
allocation & shareholder wealth
Creation
• Superior Cash Generation
• Sector leading return on capital
• Low financial leverage
Strong earnings visibility
Equity Stock Selection Framework
Investment strategy and asset allocation will be as per provisions of SID
Fixed Income allocation strategy
16
Quality Duration Allocation mix
Preference for High Quality • Preference towards short to
moderate duration portfolio
Optimize the mix between ‘carry’
and ‘mark-to-market’ (MTM) income
Actively managed Debt portion
Investment strategy and asset allocation will be as per provisions of SID
17
Does it actually help to be Dynamic?
Unprecedented level of volatility in current times
18
Nifty fell 38% from the
top and recovered 42%
from bottom all in 6
month time frame
The chart is only for illustration purposes only. Past performance may or may not be sustained in future.
Data as on 7th July’20 Source: MFI
7,000
8,000
9,000
10,000
11,000
12,000
13,000
Jan-20 Feb-20 Mar-20 Apr-20 May-20 Jun-20 Jul-20
Nifty Index
Unemotional Investing – Selling High and Buying Low
19
Following the first
principle of investing,
over and over again!
The chart is only for illustration purposes only. Past performance may or may not be sustained in future.
Data as on 7th July’20 Source: MFI
7,000
8,000
9,000
10,000
11,000
12,000
13,000
40.0%
45.0%
50.0%
55.0%
60.0%
65.0%
70.0%
75.0%
80.0%
85.0%
Jan-20 Feb-20 Mar-20 Apr-20 May-20 Jun-20 Jul-20
DEF Active Equity Nifty Index
70% active equity
79% active equity,
Nifty @ 8000
55% active equity,
Nifty @ 10850
52% active equity,
Nifty @ 12150
73% active equity,
Nifty @ 8800
Lower downside and higher upside participation
20
We need to insert that
chart here
Data as on 30th June 2020
Source: Bloomberg
-24%
22%
-6%
11%
-3%
-38%
30%
-11%
17%
-16%
-50%
-40%
-30%
-20%
-10%
0%
10%
20%
30%
40%
Correction 1 (16th Jan
'20 to 23rd Mar '20)
Upmove 1 (23rd Mar '20
to 30th Apr '20)
Correction 2 (30th Apr
'20 to 18th May '20)
Upmove 2 (18th May '20
to 30th Jun '20)
Total (16th Jan '20 to
30th Jun '20)
Upside/Downside Capture Ratio
IDFC DEF Nifty 50 TRI
63% participation
74% participation
56% participation
66% participation
a
Journey of the fund – 1/2/3 year returns
21
From Nifty 50
Nifty Midcap
100
Nifty Smallcap
100
Benchmark* IDFC DEF
Avg. Equity
Allocation
Jun'19 to Jun'20 -11.6% -15.7% -24.5% -1.3% 2.6% 52%
Jun'18 to Jun'20 -0.8% -9.1% -18.8% 3.5% 3.5% 51%
Jun'17 to Jun'20 4.0% -5.1% -13.3% 5.4% 5.6% 51%
Cushioning the downside with lower equity allocation
Past performance may or may not be sustained in future. Returns are annualized
*Benchmark: 50% S&P BSE 200TRI + 50% Nifty AAA Short Duration Bond Index Source: MFI, Data as on 30th June’20
a
Journey of the fund – Rolling 1-year returns
22
6.3% average rolling 1 year return with lowest standard deviation and variance
Past performance may or may not be sustained in future.
Benchmark: 50% S&P BSE 200TRI + 50% Nifty AAA Short Duration Bond Index Source: MFI, Data as on 30th June’20
-50%
-30%
-10%
10%
30%
50%
Jun-17
Aug-17
Oct-17
Dec-17
Feb-18
Apr-18
Jun-18
Aug-18
Oct-18
Dec-18
Feb-19
Apr-19
Jun-19
Aug-19
Oct-19
Dec-19
Feb-20
Apr-20
Jun-20
IDFC DEF Nifty 50 TRI Nifty Midcap 100 TRI Nifty Smallcap 100 TRI Benchmark
SIP performance
23
6.46%
4.55% 4.18%
1.27%
1.96%
2.97%
-7.67%
-4.89%
-1.47%
-10.00%
-8.00%
-6.00%
-4.00%
-2.00%
0.00%
2.00%
4.00%
6.00%
8.00%
1 year SIP 2 year SIP 3 year SIP
IDFC DEF
Benchmark*
Nifty TRI
*Benchmark: 50% S&P BSE 200TRI + 50% Nifty AAA Short Duration Bond Index
Source: MFI, Returns are annualized
Data as on 30th June’20
24
More About the Fund
Who should invest?
25
WHO
SHOULD
INVEST?
Investors who wish to
participate in Equity
Markets with a relatively
conservative approach
Investors looking to
invest dynamically
between Debt and Equity
while benefitting from
equity taxation
Investors seeking alpha in a volatile /
uncertain market environment
Suitable for conservative investor or for 1st time investors
Fund detail
26
An open ended
dynamic asset allocation fund
Min. application amount is
Rs.5,000 and any amount
thereafter
50% S&P BSE 200TRI +
50% Nifty AAA Short
Duration Bond Index
• For 10% of investment: Nil
• For remaining: 1% if
redeemed/switched out
within 1 year from the date of
allotment
Nature
Minimum
Application Amount
Benchmark Exit Load
Equity: Mr. Arpit Kapoor &
Mr. Sumit Agarwal
Debt: Mr. Arvind Subramanian
Fund Manager*
*Overseas investment will be managed by Mr. Viraj Kulkarni
Scheme performance
27
B-Benchmark, AB- Alternate Benchmark
Performance based on NAV as on 30/06/2020. Past performance may or may not be sustained in future.
Refer following slide for performance on other funds managed by the fund manager
The performances given are of regular plan growth option.
Regular and Direct Plans have different expense structure. Direct Plan shall have a lower expense ratio excluding distribution expenses, commission expenses etc.
The fund has been repositioned from a Nifty linked fund to an open banded fund w.e.f. June 19, 2017.
This fund is managed by Mr. Arpit Kapoor & Mr. Sumit Agrawal (w.e.f. 01st March 2017) for Equity Portion, Mr. Arvind Subramanian (w.e.f. 09th November 2015) for
Debt Portion
Other Funds Managed by the Fund Managers
28
Other Funds Managed by the Fund Managers
29
Performance based on NAV as on 30/06/2020 Past Performance may or may not be sustained in future
The performance details provided herein are of regular plan growth option. Regular and Direct Plans have different expense structure. Direct Plan
shall have a lower expense ratio excluding distribution expenses, commission expenses etc.
§Current Index performance adjusted for the period from since inception to June 28, 2007 with the performance of S&P BSE 100 price return
index (Benchmark). 2The fund has been repositioned from an IPO fund to a large cap fund w.e.f. April 18, 2017. ^Current Index performance
adjusted for the period from since inception to May 28, 2018 with the performance of CRISIL Hybrid 85+15 Conservative Index (Benchmark) and
CRISIL Hybrid 35+65 - Aggressive Index (Benchmark). 5. The fund has been repositioned w.e.f. May 28, 2018 and since will invest only in the
schemes of IDFC Mutual Funds.
Product Label
30
IDFC Dynamic Equity Fund
(An open ended dynamic asset allocation fund)
31
Disclaimer:
MUTUAL FUND INVESTMENTS ARE SUBJECT TO MARKET RISKS, READ ALL SCHEME RELATED DOCUMENTS CAREFULLY.
The Disclosures of opinions/in house views/strategy incorporated herein is provided solely to enhance the transparency about the investment
strategy / theme of the Scheme and should not be treated as endorsement of the views / opinions or as an investment advice. This document should
not be construed as a research report or a recommendation to buy or sell any security. This document has been prepared on the basis of
information, which is already available in publicly accessible media or developed through analysis of IDFC Mutual Fund. The information/ views /
opinions provided is for informative purpose only and may have ceased to be current by the time it may reach the recipient, which should be taken
into account before interpreting this document. The recipient should note and understand that the information provided above may not contain all
the material aspects relevant for making an investment decision and the stocks may or may not continue to form part of the scheme’s portfolio in
future. The decision of the Investment Manager may not always be profitable; as such decisions are based on the prevailing market conditions and
the understanding of the Investment Manager. Actual market movements may vary from the anticipated trends. This information is subject to
change without any prior notice. The Company reserves the right to make modifications and alterations to this statement as may be required from
time to time. Neither IDFC Mutual Fund / IDFC AMC Trustee Co. Ltd./ IDFC Asset Management Co. Ltd nor IDFC, its Directors or representatives shall
be liable for any damages whether direct or indirect, incidental, punitive special or consequential including lost revenue or lost profits that may arise
from or in connection with the use of the information.

IDFC Dynamic Equity Fund_Fund presentation

  • 1.
    1 UNEMOTIONAL INVESTING IN VOLATILETIMES – IDFC DYNAMIC EQUITY FUND
  • 2.
    Contents 2 1. Investor behaviour& Investment solution 2. Disciplined approach of IDFC Dynamic Equity Fund 3. Does it help to be Dynamic 4. More about the Fund
  • 3.
    3 Investor Behaviour &Investment Solution
  • 4.
    Typical investor behaviour 4 Anaverage investor’s psychology gets impacted by his recent experience and thus ends up doing the complete opposite – “Buy high and sell low”
  • 5.
    Flows supporting thishypothesis 5 Investor experience ≠ Market performance Nifty in Jan’08: 6288 Flows: INR 21,247cr Nifty in Mar’15: 8996 Flows: INR 17,286cr Nifty in Oct’08: 2524 Flows: INR 2146cr Nifty in Feb’16: 6970 Flows: INR 10,876cr This is only for illustration purposes only. The flows mentioned here are gross sales into Equity/ELSS and NFOs Source: AMFI
  • 6.
    The remedy 6 Buy LowSell High But Easier said than done!
  • 7.
    Nifty in Feb’16:6970 Why you should buy more when markets are low 7 Past Return ≠ Future Return The chart is only for illustration purposes only. Past performance may or may not be sustained in future. Source: MFI Nifty in Oct’08: 2524
  • 8.
    Need for afund with disciplined investing 8 Removes the need to time the market / removes human bias of predicting trends Reduced volatility versus pure equity - cushioning the drawdowns Model based approach Dynamic Allocation between Equity ↔ Debt ↔ Arbitrage
  • 9.
    a Introducing dynamic assetallocation 9 Model based approach that allocates dynamically between EQUITY DEBT Arbitrage / Hedged Equity Capital Appreciation Regular Income Downside risk reduction
  • 10.
    10 Disciplined approach ofIDFC Dynamic Equity Fund
  • 11.
    The fund strategy 11 Dynamic Allocation betweenDebt & Equity Predefined Model – using PE values Active Management Diversified Portfolio * Fund will maintain 65% Equity allocation at all times for Equity taxation & hedging will be used to reduce effective equity exposure up to 30%
  • 12.
    The ‘Buy Low– Sell High’ model 12 Equity Allocation is based on the model below PE Bands Equity Allocation <12 90-100 12-16 75-90 16-19 65-75 19-22 55-65 22-26 40-55 >26 30-40 Equity Allocation would be basis month-end weighted average Trailing PE ratio of Nifty 50 PE and changes will happen once a month Cheaper Markets – Higher Equity Allocation Expensive Markets – Lower Equity Allocation
  • 13.
    Dynamic allocation betweenequity and debt 13 100% 90% 85% 75% 70% 60% 55% 50% 40% 30% 5% 10% 15% 25% 35% 10% 15% 25% 30% 35% 35% 35% 35% 35% 65% Equity Exposure Arbitrage Debt Equity Low PE High PE As the Nifty PE moves from Low to High the allocation towards Net Equity reduces The minimum Equity holding requirement of 65% to meet Equity taxation eligibility is met with investment in Equity Derivatives This is only for illustration purposes only.
  • 14.
    Changes in equityallocation with market valuation 14 Source: IDFC MF, Bloomberg Data as on 30th June’20 40.0% 45.0% 50.0% 55.0% 60.0% 65.0% 70.0% 75.0% 80.0% 14.00 16.00 18.00 20.00 22.00 24.00 26.00 Sep-17 Dec-17 Mar-18 Jun-18 Sep-18 Dec-18 Mar-19 Jun-19 Sep-19 Dec-19 Mar-20 Jun-20 Net Equity Allocation P/E P/E (LHS) Net Equity Allocation
  • 15.
    Equity allocation strategy 15 ManagementQuality Past Financial History Earning Growth Trajectory 3Cs –Corporate governance, Capital allocation & shareholder wealth Creation • Superior Cash Generation • Sector leading return on capital • Low financial leverage Strong earnings visibility Equity Stock Selection Framework Investment strategy and asset allocation will be as per provisions of SID
  • 16.
    Fixed Income allocationstrategy 16 Quality Duration Allocation mix Preference for High Quality • Preference towards short to moderate duration portfolio Optimize the mix between ‘carry’ and ‘mark-to-market’ (MTM) income Actively managed Debt portion Investment strategy and asset allocation will be as per provisions of SID
  • 17.
    17 Does it actuallyhelp to be Dynamic?
  • 18.
    Unprecedented level ofvolatility in current times 18 Nifty fell 38% from the top and recovered 42% from bottom all in 6 month time frame The chart is only for illustration purposes only. Past performance may or may not be sustained in future. Data as on 7th July’20 Source: MFI 7,000 8,000 9,000 10,000 11,000 12,000 13,000 Jan-20 Feb-20 Mar-20 Apr-20 May-20 Jun-20 Jul-20 Nifty Index
  • 19.
    Unemotional Investing –Selling High and Buying Low 19 Following the first principle of investing, over and over again! The chart is only for illustration purposes only. Past performance may or may not be sustained in future. Data as on 7th July’20 Source: MFI 7,000 8,000 9,000 10,000 11,000 12,000 13,000 40.0% 45.0% 50.0% 55.0% 60.0% 65.0% 70.0% 75.0% 80.0% 85.0% Jan-20 Feb-20 Mar-20 Apr-20 May-20 Jun-20 Jul-20 DEF Active Equity Nifty Index 70% active equity 79% active equity, Nifty @ 8000 55% active equity, Nifty @ 10850 52% active equity, Nifty @ 12150 73% active equity, Nifty @ 8800
  • 20.
    Lower downside andhigher upside participation 20 We need to insert that chart here Data as on 30th June 2020 Source: Bloomberg -24% 22% -6% 11% -3% -38% 30% -11% 17% -16% -50% -40% -30% -20% -10% 0% 10% 20% 30% 40% Correction 1 (16th Jan '20 to 23rd Mar '20) Upmove 1 (23rd Mar '20 to 30th Apr '20) Correction 2 (30th Apr '20 to 18th May '20) Upmove 2 (18th May '20 to 30th Jun '20) Total (16th Jan '20 to 30th Jun '20) Upside/Downside Capture Ratio IDFC DEF Nifty 50 TRI 63% participation 74% participation 56% participation 66% participation
  • 21.
    a Journey of thefund – 1/2/3 year returns 21 From Nifty 50 Nifty Midcap 100 Nifty Smallcap 100 Benchmark* IDFC DEF Avg. Equity Allocation Jun'19 to Jun'20 -11.6% -15.7% -24.5% -1.3% 2.6% 52% Jun'18 to Jun'20 -0.8% -9.1% -18.8% 3.5% 3.5% 51% Jun'17 to Jun'20 4.0% -5.1% -13.3% 5.4% 5.6% 51% Cushioning the downside with lower equity allocation Past performance may or may not be sustained in future. Returns are annualized *Benchmark: 50% S&P BSE 200TRI + 50% Nifty AAA Short Duration Bond Index Source: MFI, Data as on 30th June’20
  • 22.
    a Journey of thefund – Rolling 1-year returns 22 6.3% average rolling 1 year return with lowest standard deviation and variance Past performance may or may not be sustained in future. Benchmark: 50% S&P BSE 200TRI + 50% Nifty AAA Short Duration Bond Index Source: MFI, Data as on 30th June’20 -50% -30% -10% 10% 30% 50% Jun-17 Aug-17 Oct-17 Dec-17 Feb-18 Apr-18 Jun-18 Aug-18 Oct-18 Dec-18 Feb-19 Apr-19 Jun-19 Aug-19 Oct-19 Dec-19 Feb-20 Apr-20 Jun-20 IDFC DEF Nifty 50 TRI Nifty Midcap 100 TRI Nifty Smallcap 100 TRI Benchmark
  • 23.
    SIP performance 23 6.46% 4.55% 4.18% 1.27% 1.96% 2.97% -7.67% -4.89% -1.47% -10.00% -8.00% -6.00% -4.00% -2.00% 0.00% 2.00% 4.00% 6.00% 8.00% 1year SIP 2 year SIP 3 year SIP IDFC DEF Benchmark* Nifty TRI *Benchmark: 50% S&P BSE 200TRI + 50% Nifty AAA Short Duration Bond Index Source: MFI, Returns are annualized Data as on 30th June’20
  • 24.
  • 25.
    Who should invest? 25 WHO SHOULD INVEST? Investorswho wish to participate in Equity Markets with a relatively conservative approach Investors looking to invest dynamically between Debt and Equity while benefitting from equity taxation Investors seeking alpha in a volatile / uncertain market environment Suitable for conservative investor or for 1st time investors
  • 26.
    Fund detail 26 An openended dynamic asset allocation fund Min. application amount is Rs.5,000 and any amount thereafter 50% S&P BSE 200TRI + 50% Nifty AAA Short Duration Bond Index • For 10% of investment: Nil • For remaining: 1% if redeemed/switched out within 1 year from the date of allotment Nature Minimum Application Amount Benchmark Exit Load Equity: Mr. Arpit Kapoor & Mr. Sumit Agarwal Debt: Mr. Arvind Subramanian Fund Manager* *Overseas investment will be managed by Mr. Viraj Kulkarni
  • 27.
    Scheme performance 27 B-Benchmark, AB-Alternate Benchmark Performance based on NAV as on 30/06/2020. Past performance may or may not be sustained in future. Refer following slide for performance on other funds managed by the fund manager The performances given are of regular plan growth option. Regular and Direct Plans have different expense structure. Direct Plan shall have a lower expense ratio excluding distribution expenses, commission expenses etc. The fund has been repositioned from a Nifty linked fund to an open banded fund w.e.f. June 19, 2017. This fund is managed by Mr. Arpit Kapoor & Mr. Sumit Agrawal (w.e.f. 01st March 2017) for Equity Portion, Mr. Arvind Subramanian (w.e.f. 09th November 2015) for Debt Portion
  • 28.
    Other Funds Managedby the Fund Managers 28
  • 29.
    Other Funds Managedby the Fund Managers 29 Performance based on NAV as on 30/06/2020 Past Performance may or may not be sustained in future The performance details provided herein are of regular plan growth option. Regular and Direct Plans have different expense structure. Direct Plan shall have a lower expense ratio excluding distribution expenses, commission expenses etc. §Current Index performance adjusted for the period from since inception to June 28, 2007 with the performance of S&P BSE 100 price return index (Benchmark). 2The fund has been repositioned from an IPO fund to a large cap fund w.e.f. April 18, 2017. ^Current Index performance adjusted for the period from since inception to May 28, 2018 with the performance of CRISIL Hybrid 85+15 Conservative Index (Benchmark) and CRISIL Hybrid 35+65 - Aggressive Index (Benchmark). 5. The fund has been repositioned w.e.f. May 28, 2018 and since will invest only in the schemes of IDFC Mutual Funds.
  • 30.
    Product Label 30 IDFC DynamicEquity Fund (An open ended dynamic asset allocation fund)
  • 31.
    31 Disclaimer: MUTUAL FUND INVESTMENTSARE SUBJECT TO MARKET RISKS, READ ALL SCHEME RELATED DOCUMENTS CAREFULLY. The Disclosures of opinions/in house views/strategy incorporated herein is provided solely to enhance the transparency about the investment strategy / theme of the Scheme and should not be treated as endorsement of the views / opinions or as an investment advice. This document should not be construed as a research report or a recommendation to buy or sell any security. This document has been prepared on the basis of information, which is already available in publicly accessible media or developed through analysis of IDFC Mutual Fund. The information/ views / opinions provided is for informative purpose only and may have ceased to be current by the time it may reach the recipient, which should be taken into account before interpreting this document. The recipient should note and understand that the information provided above may not contain all the material aspects relevant for making an investment decision and the stocks may or may not continue to form part of the scheme’s portfolio in future. The decision of the Investment Manager may not always be profitable; as such decisions are based on the prevailing market conditions and the understanding of the Investment Manager. Actual market movements may vary from the anticipated trends. This information is subject to change without any prior notice. The Company reserves the right to make modifications and alterations to this statement as may be required from time to time. Neither IDFC Mutual Fund / IDFC AMC Trustee Co. Ltd./ IDFC Asset Management Co. Ltd nor IDFC, its Directors or representatives shall be liable for any damages whether direct or indirect, incidental, punitive special or consequential including lost revenue or lost profits that may arise from or in connection with the use of the information.