Download to read offline


• Arguments must be entered in the correct order
• Some arguments are optional
• Best practice is to specify optional arguments
• If you do not, Excel enters a default value](https://image.slidesharecdn.com/utilizingproformamodelinginexcel-181224225532/75/Utilizing-Pro-Forma-Modeling-In-Excel-22-2048.jpg)
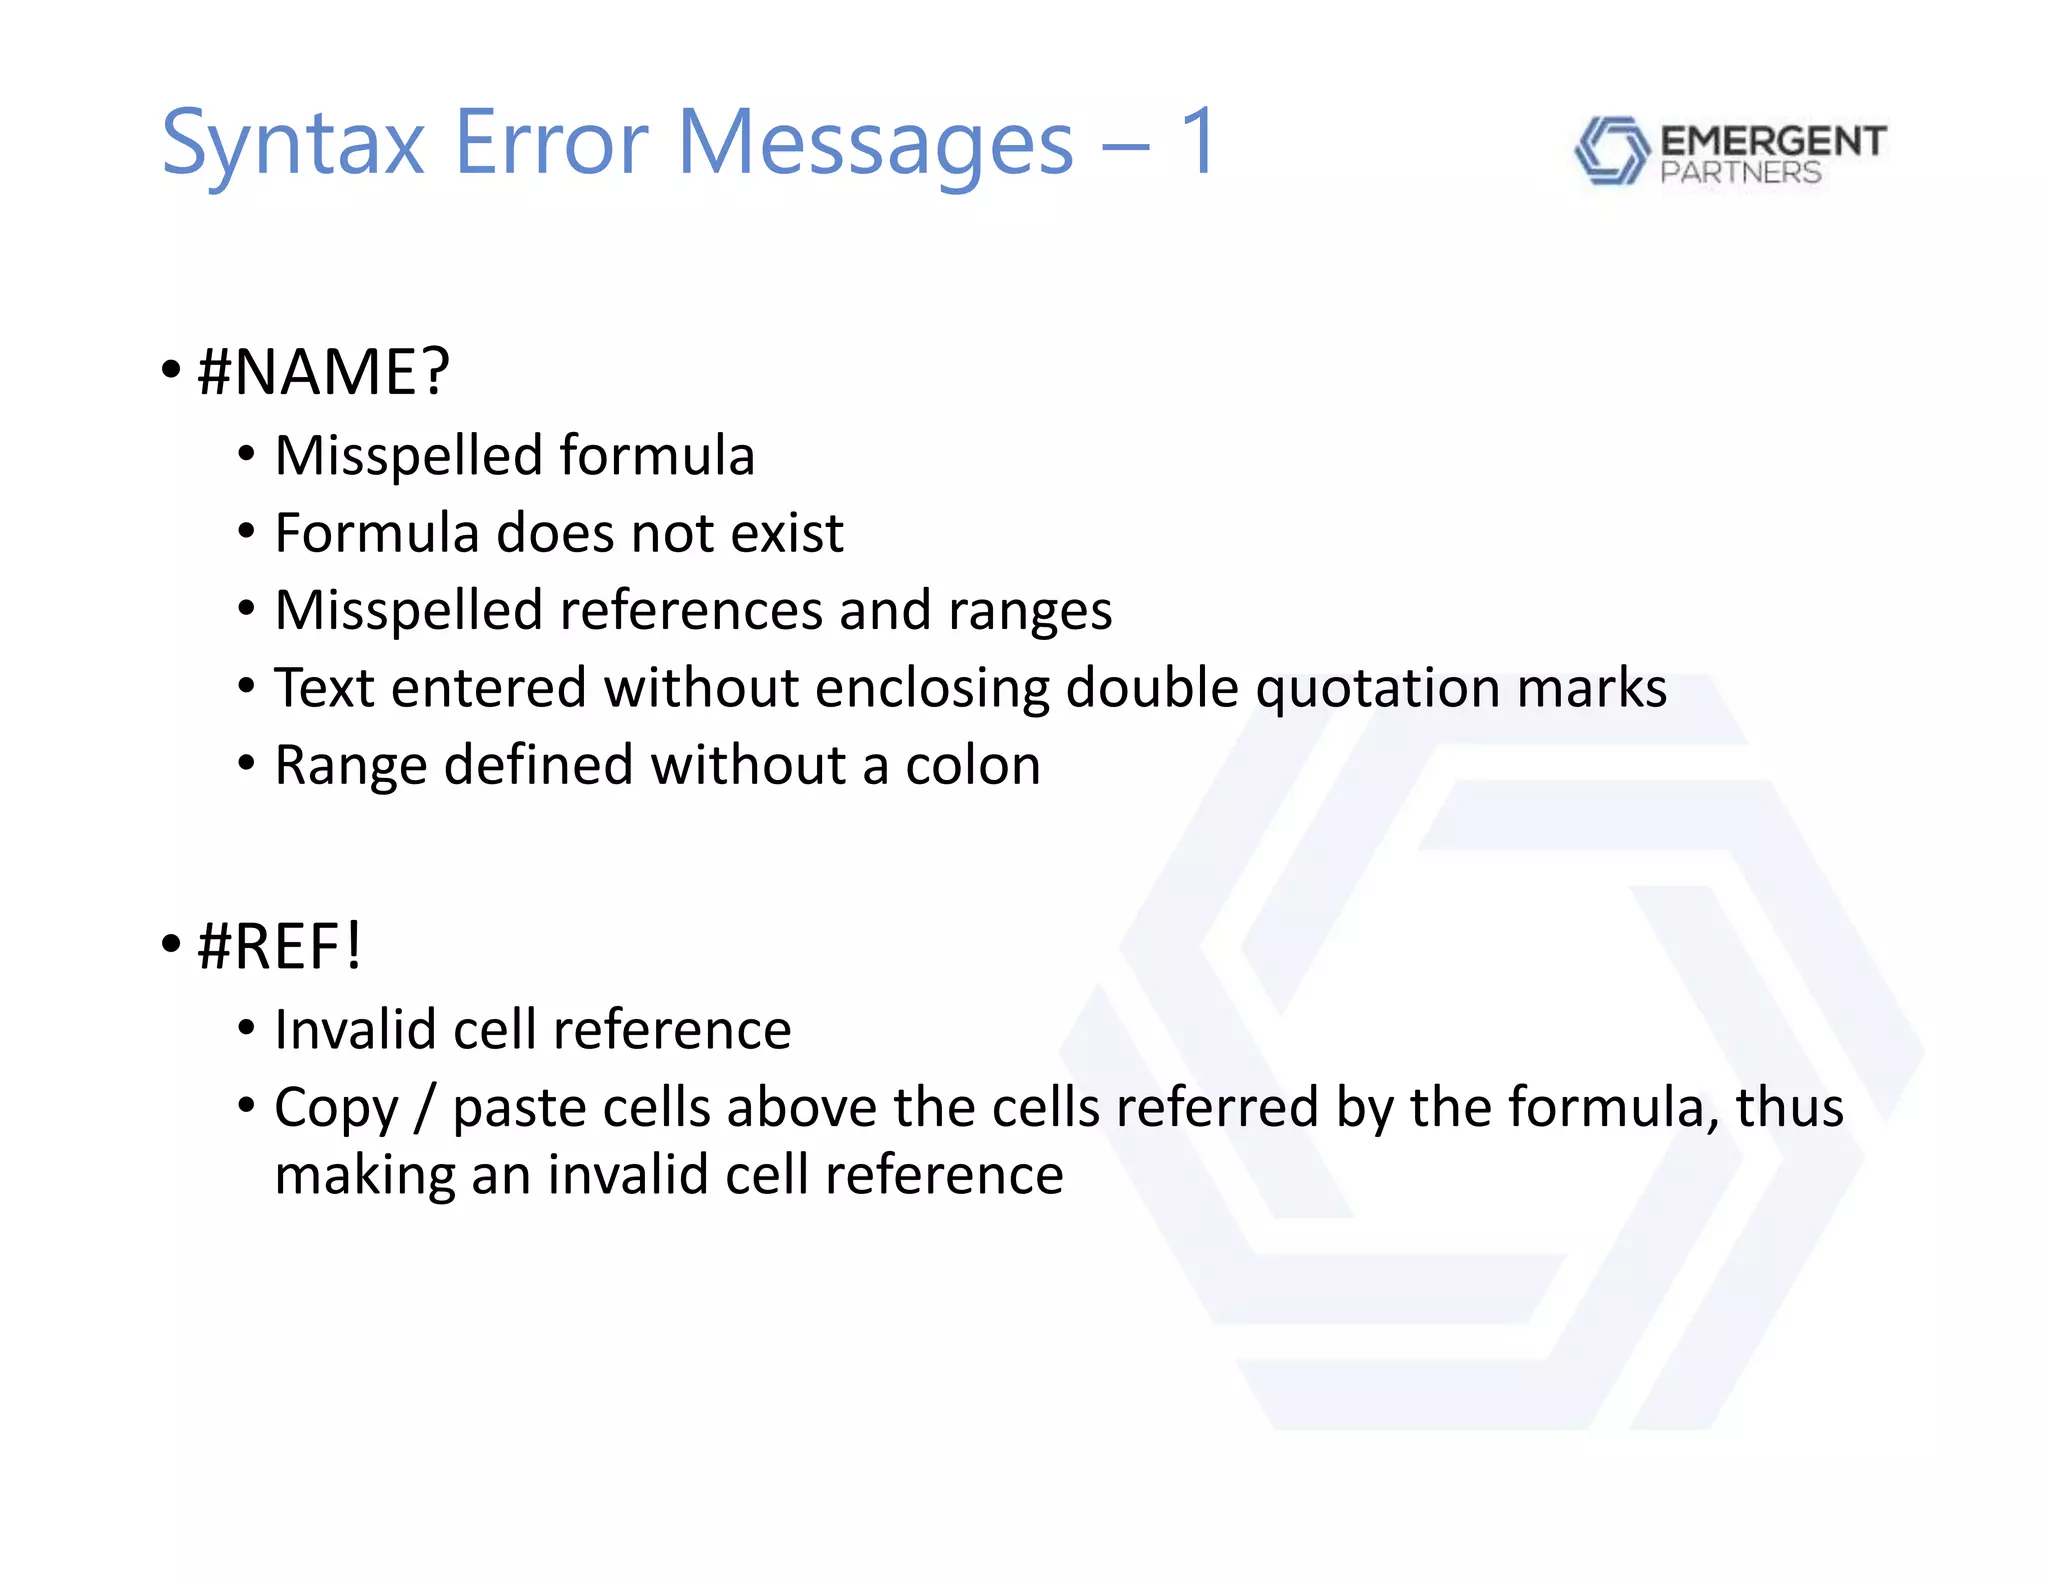
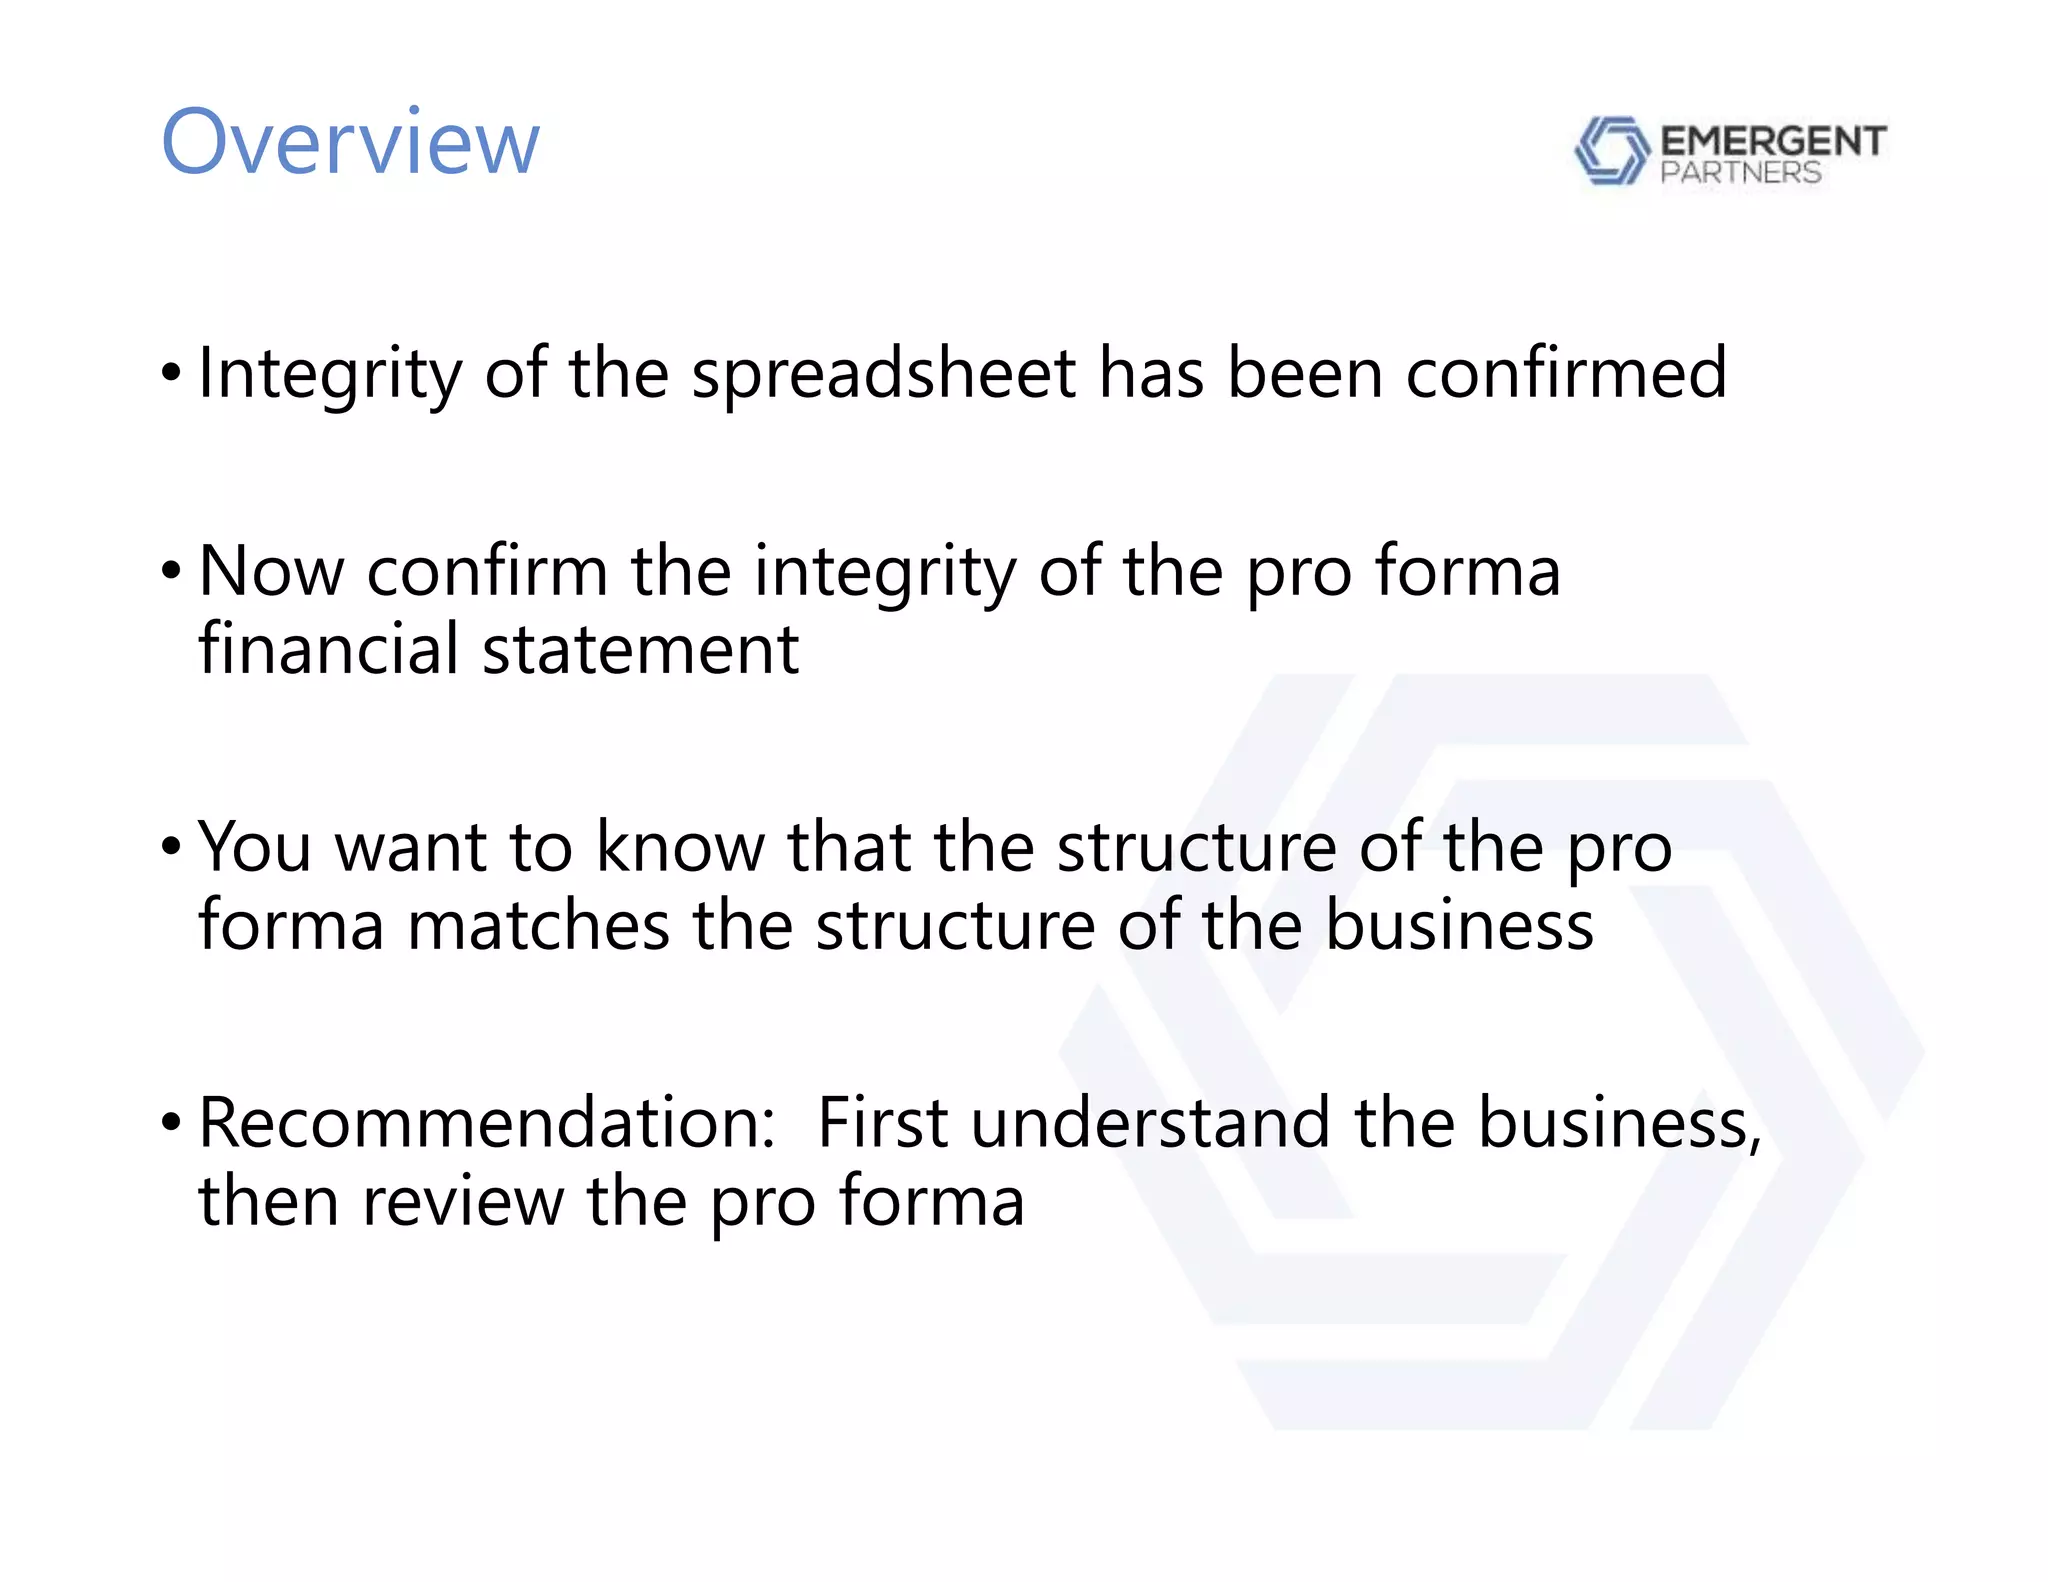
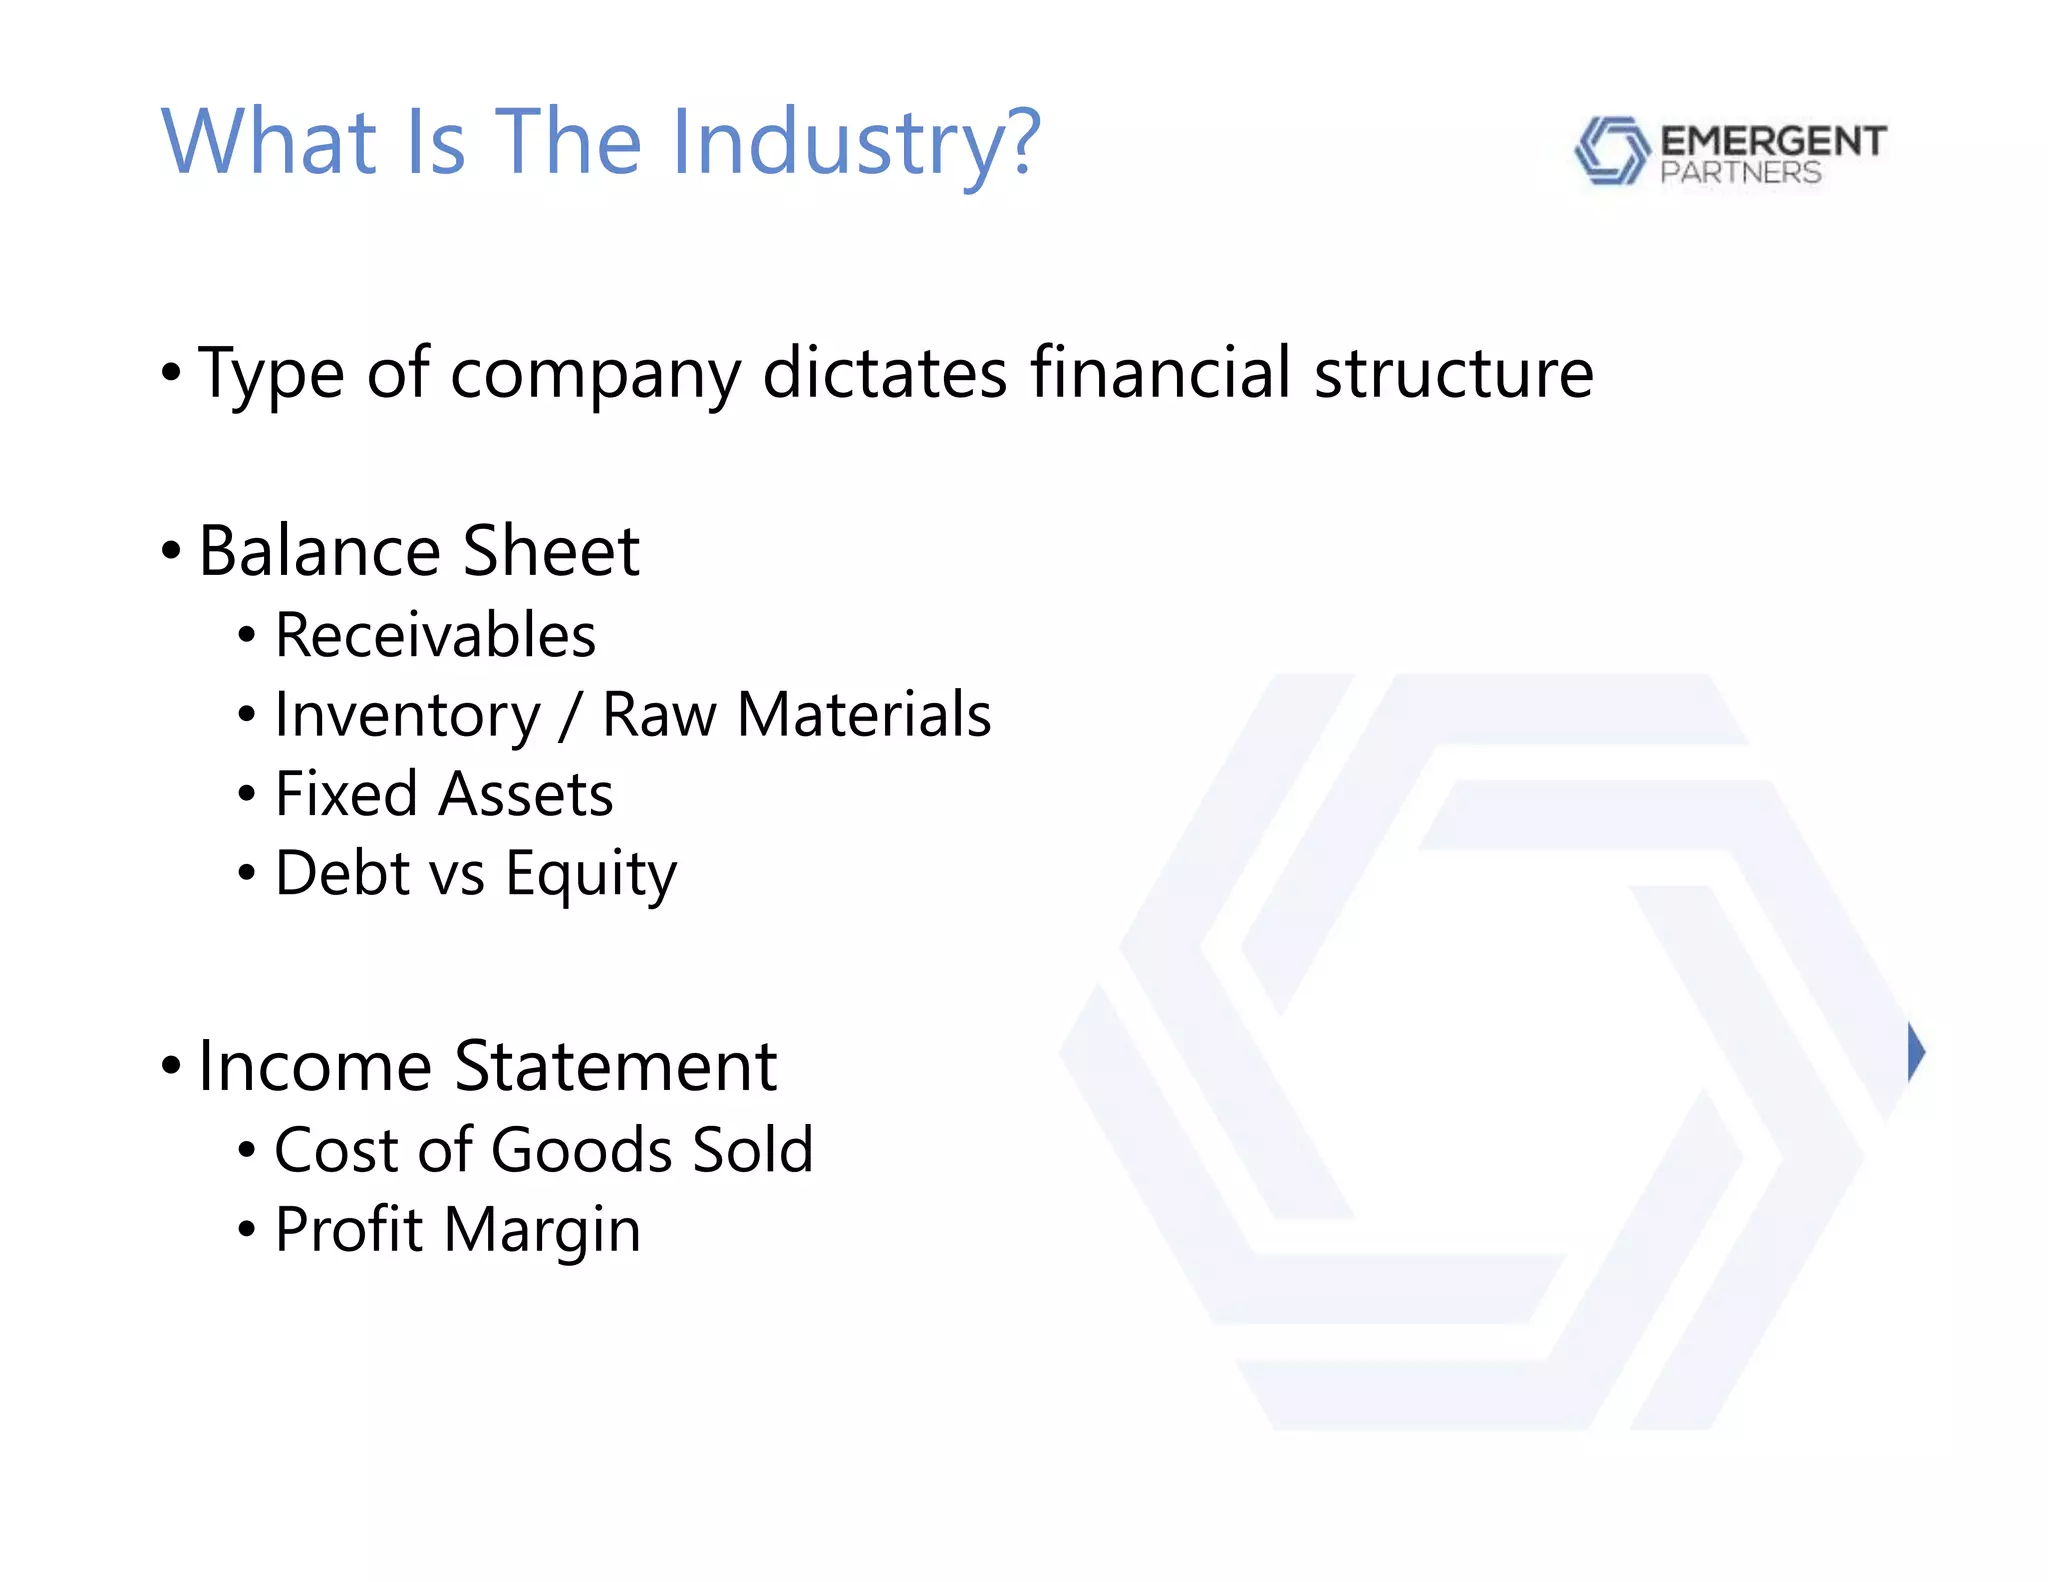
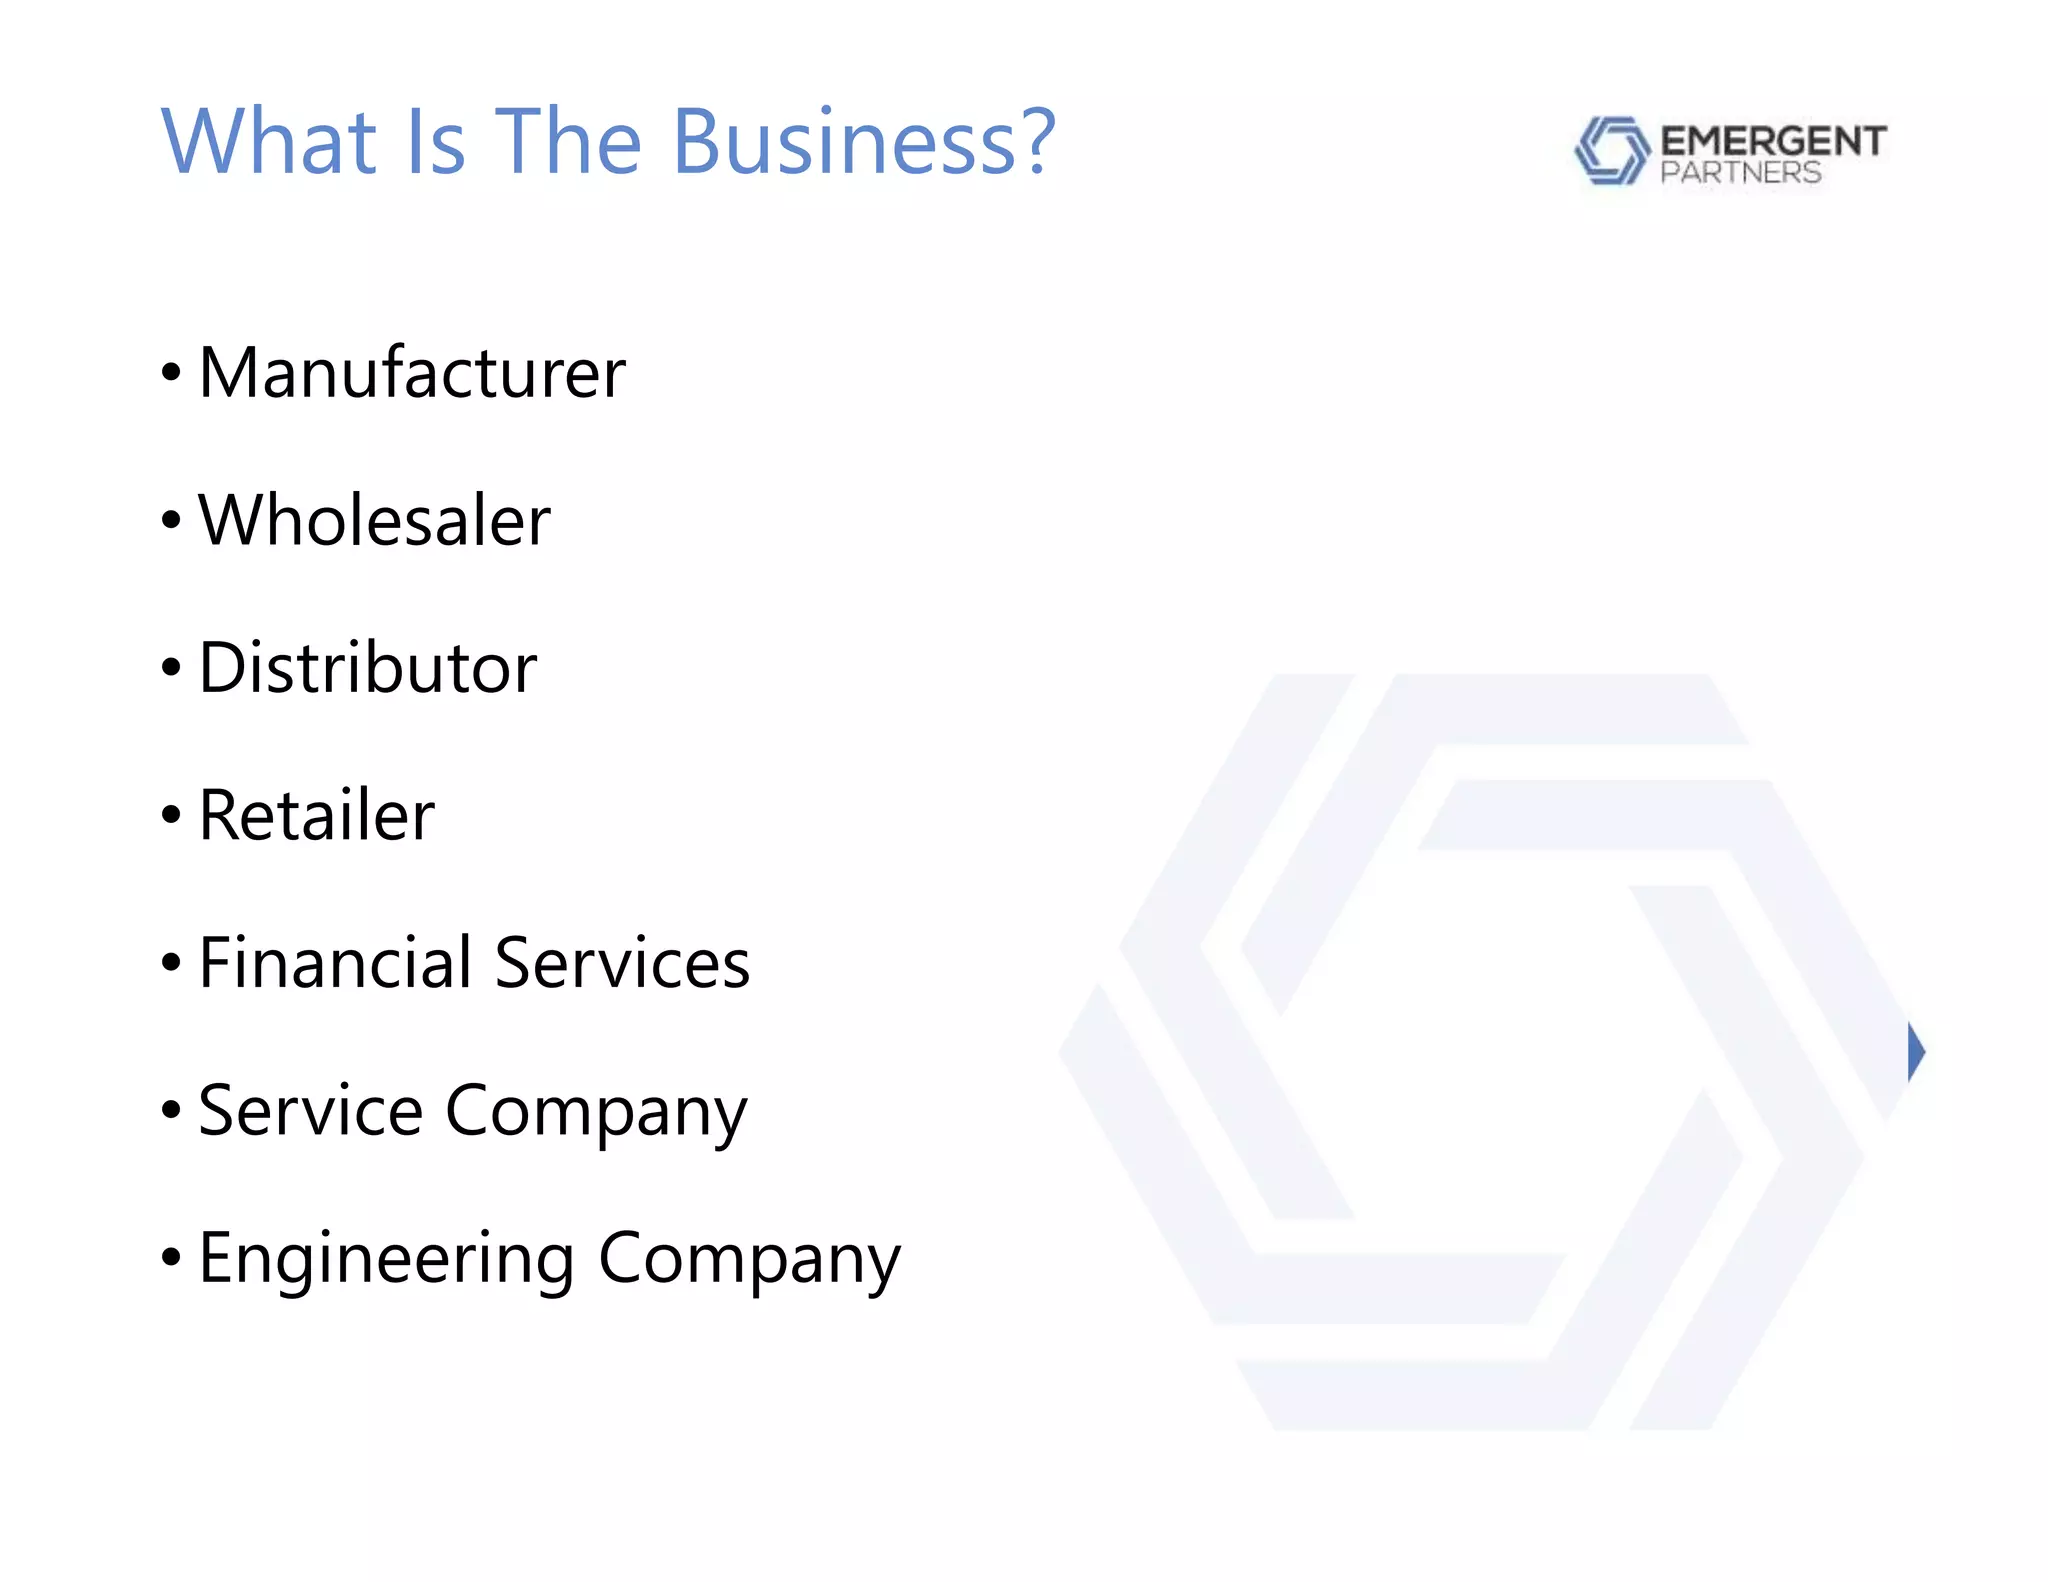
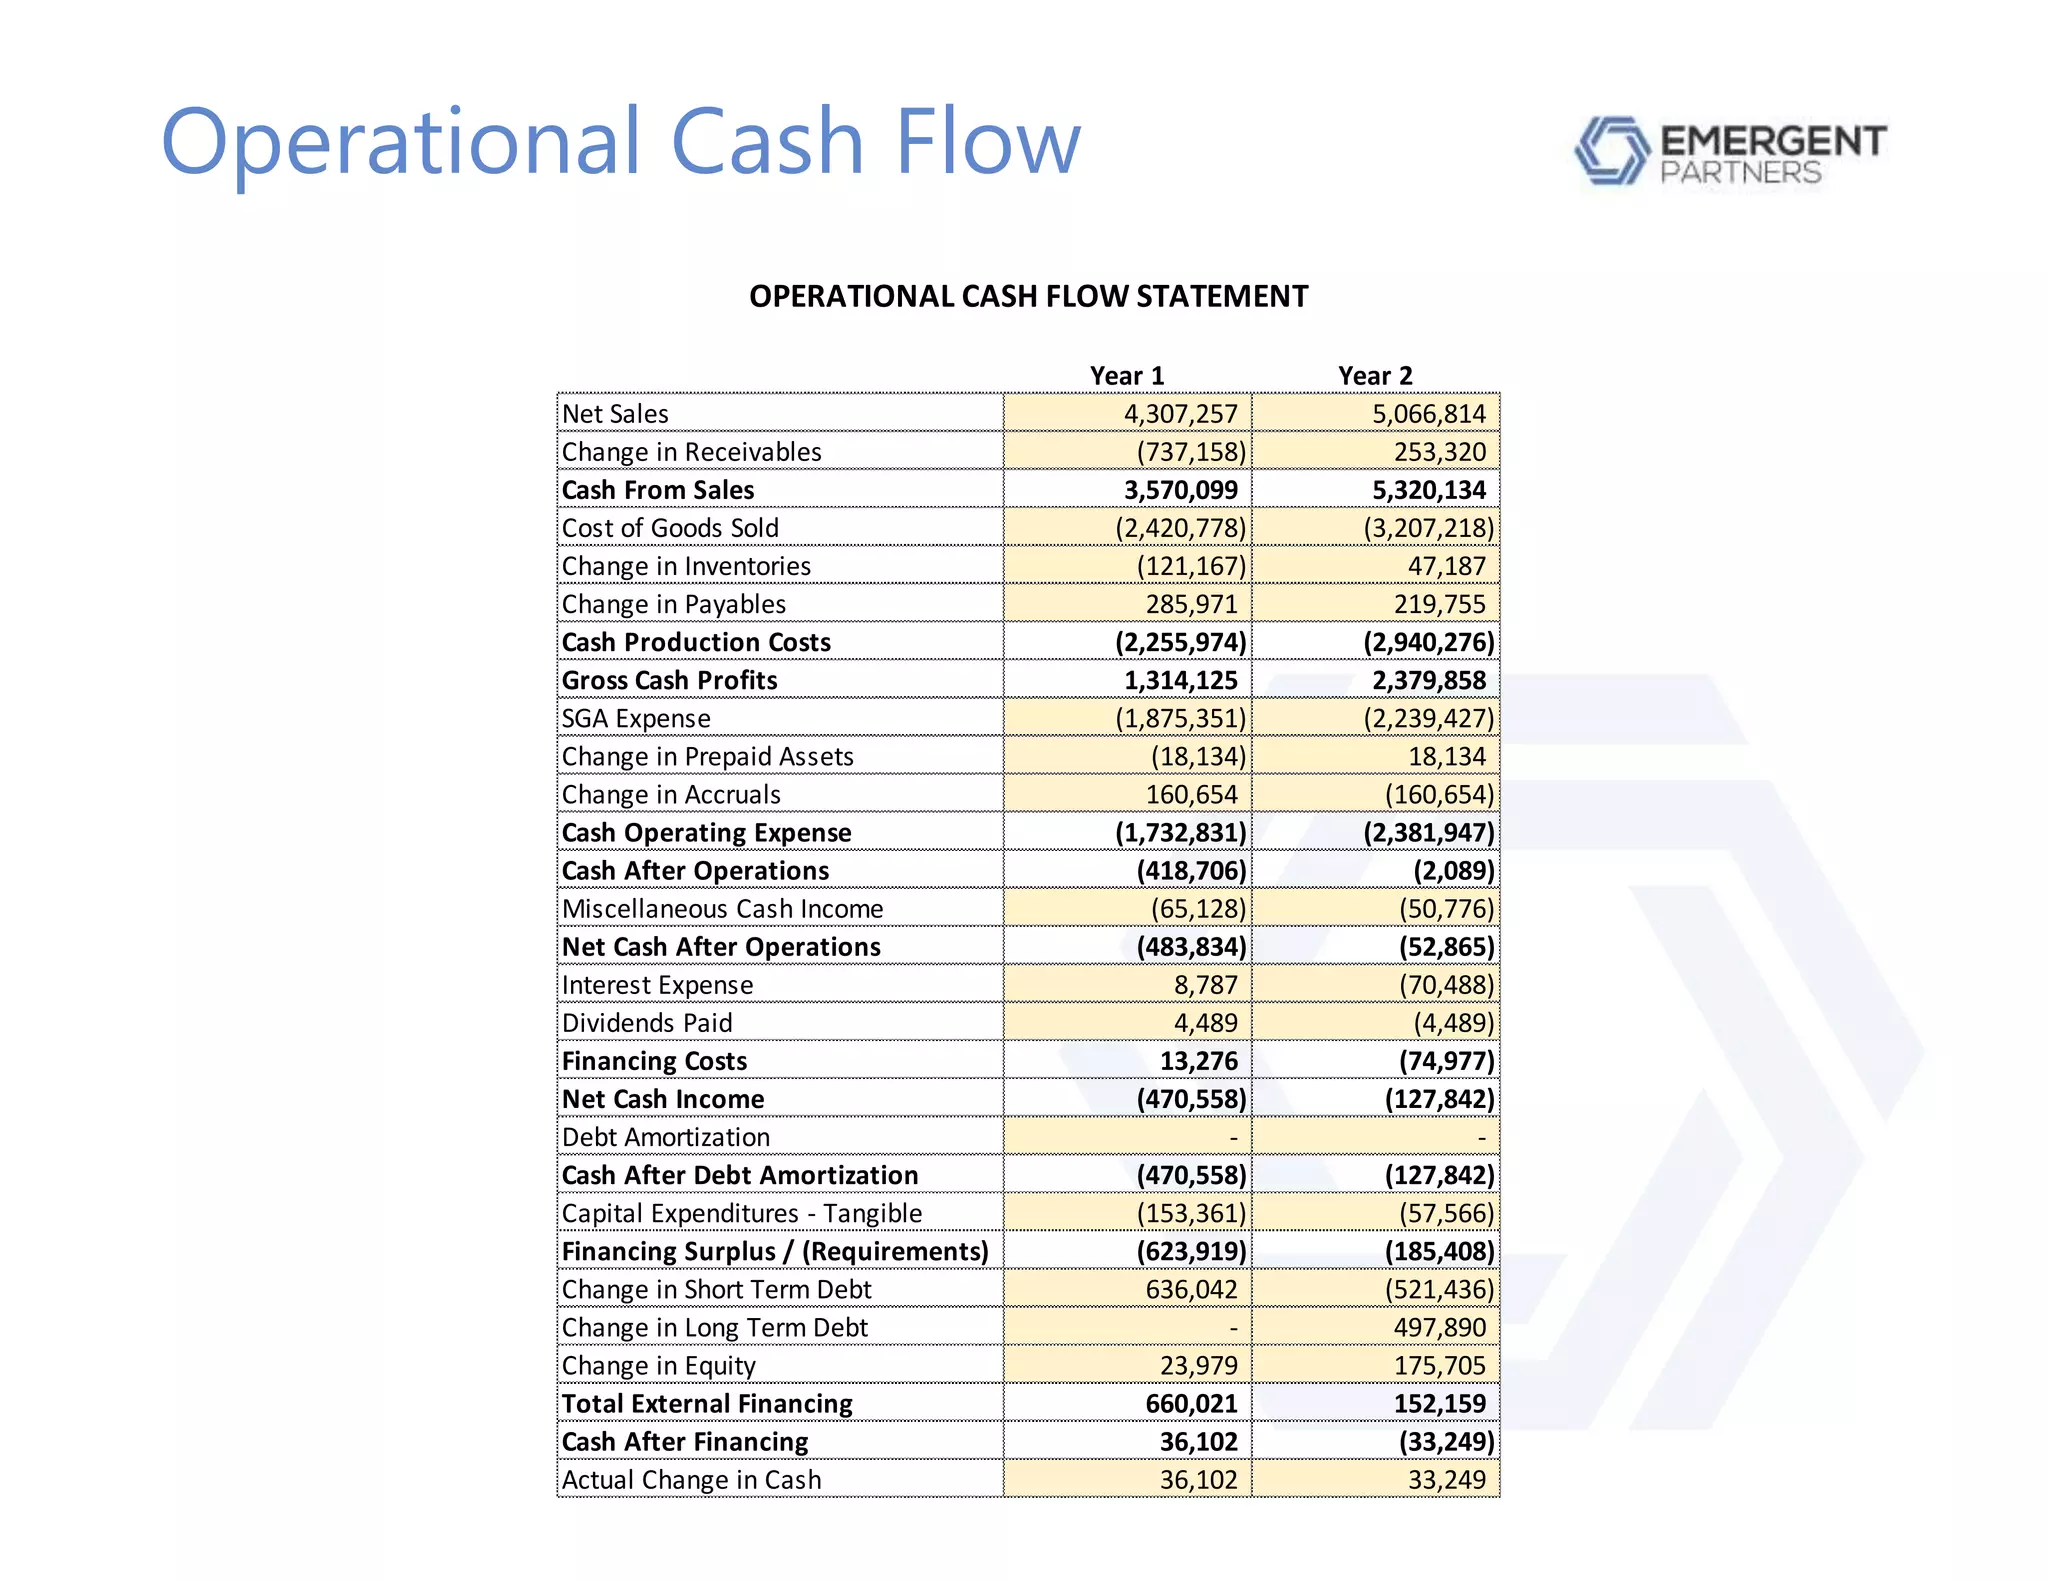


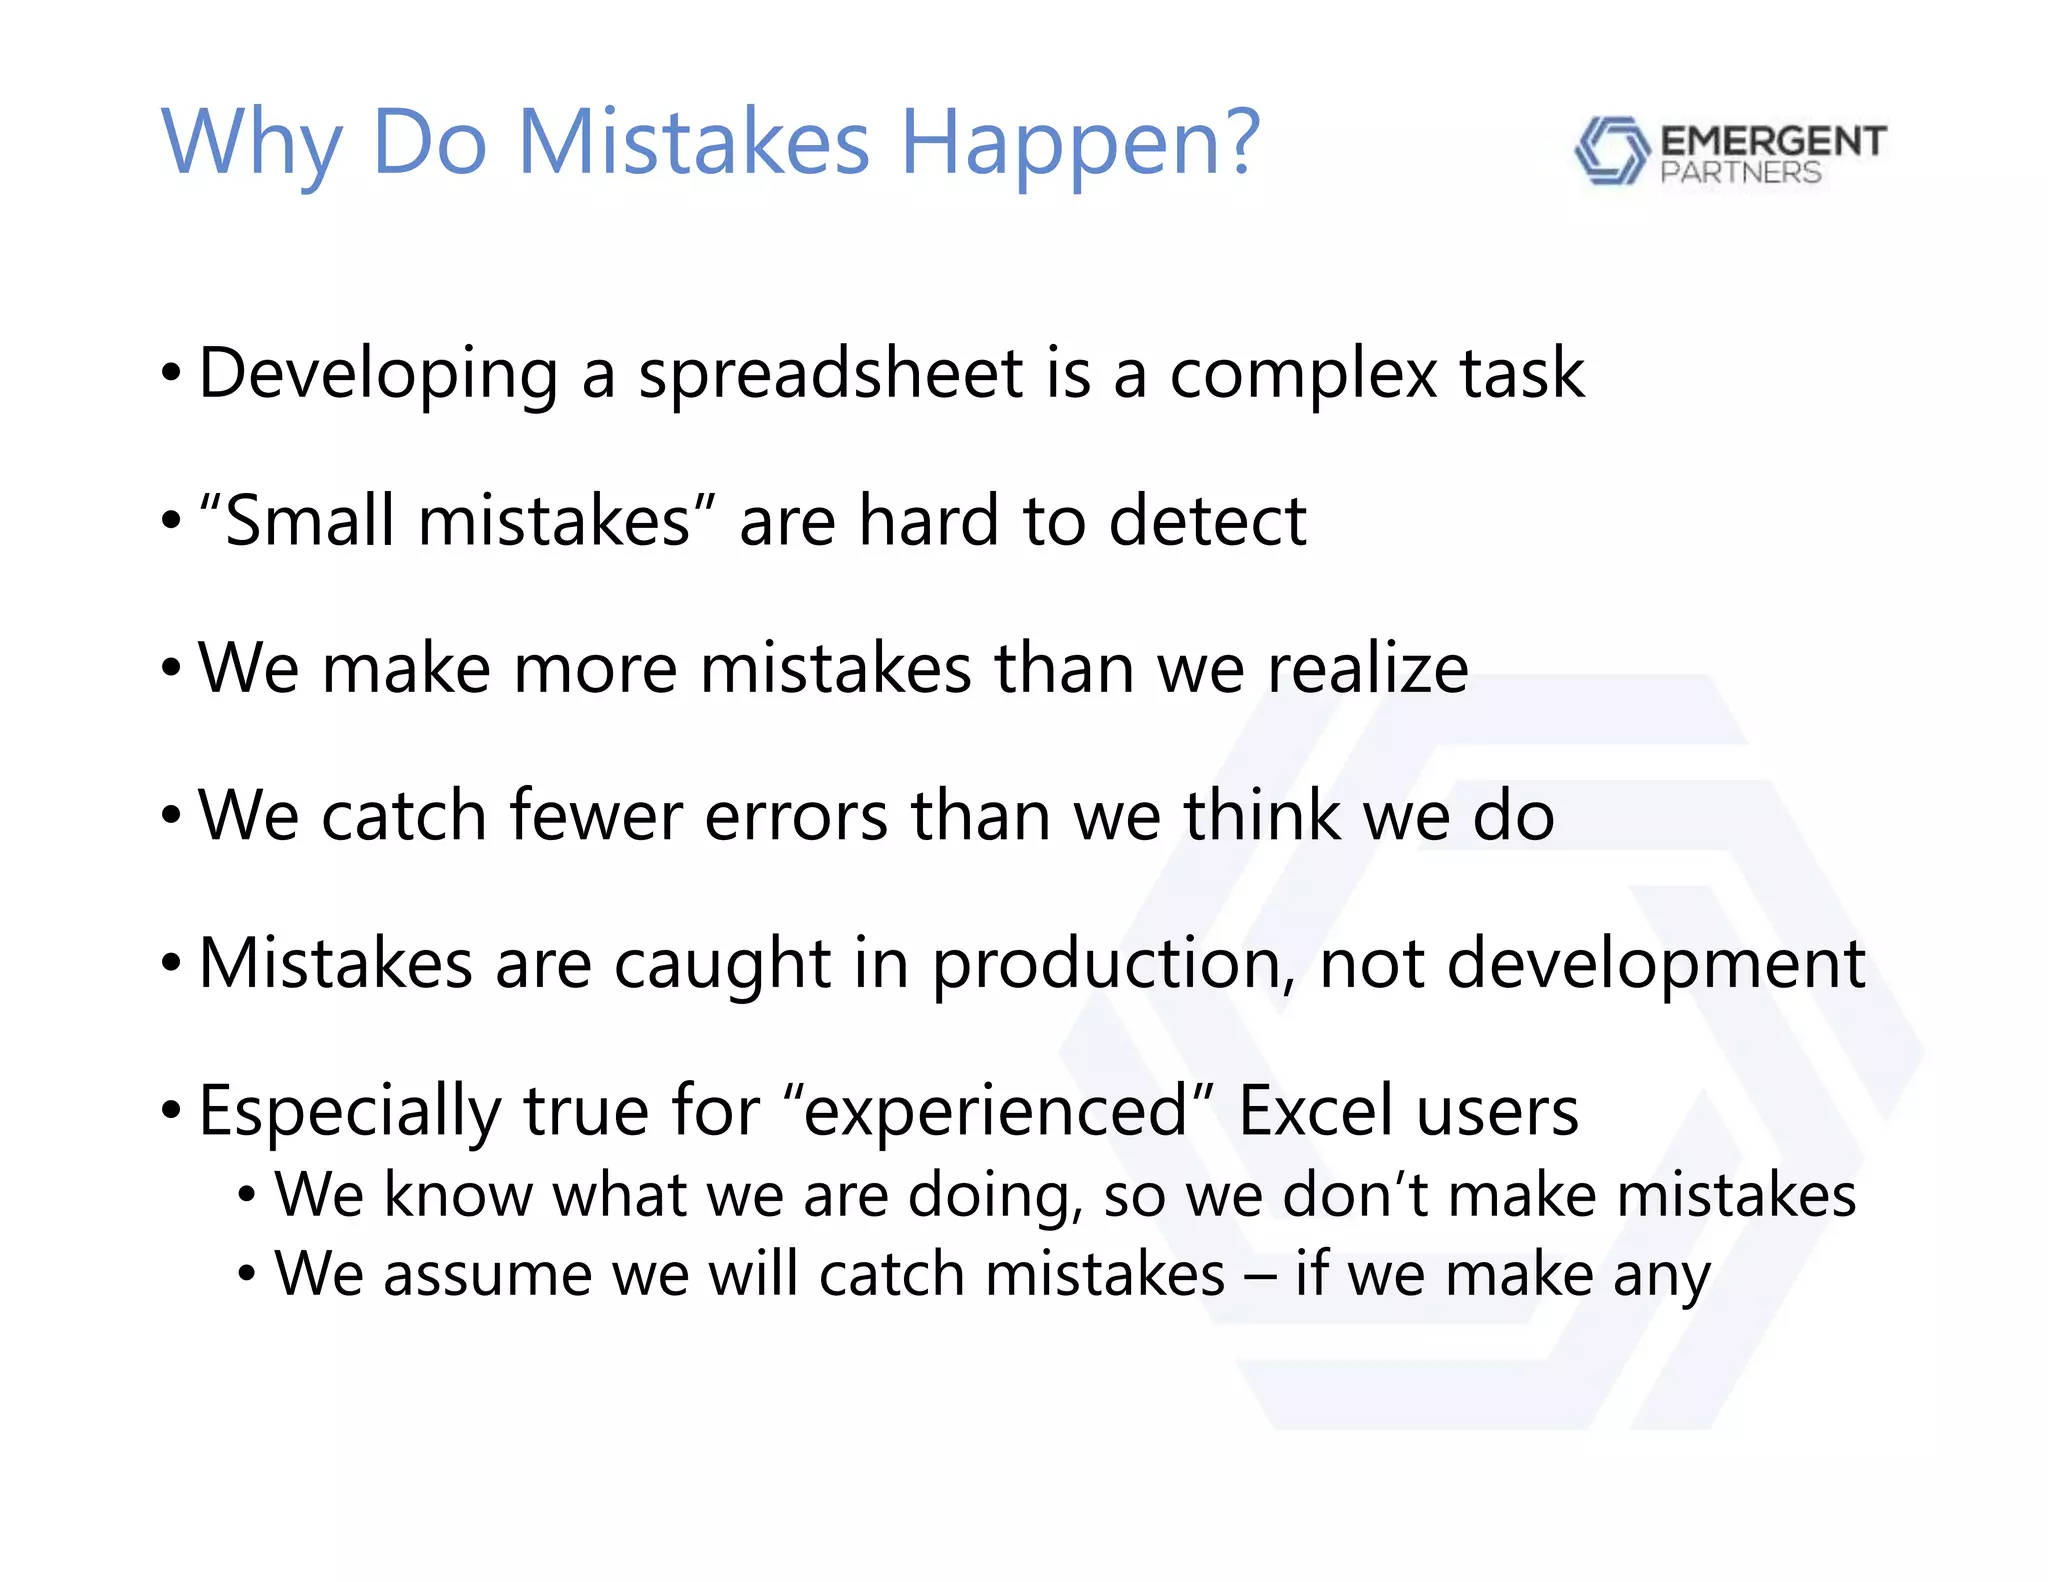
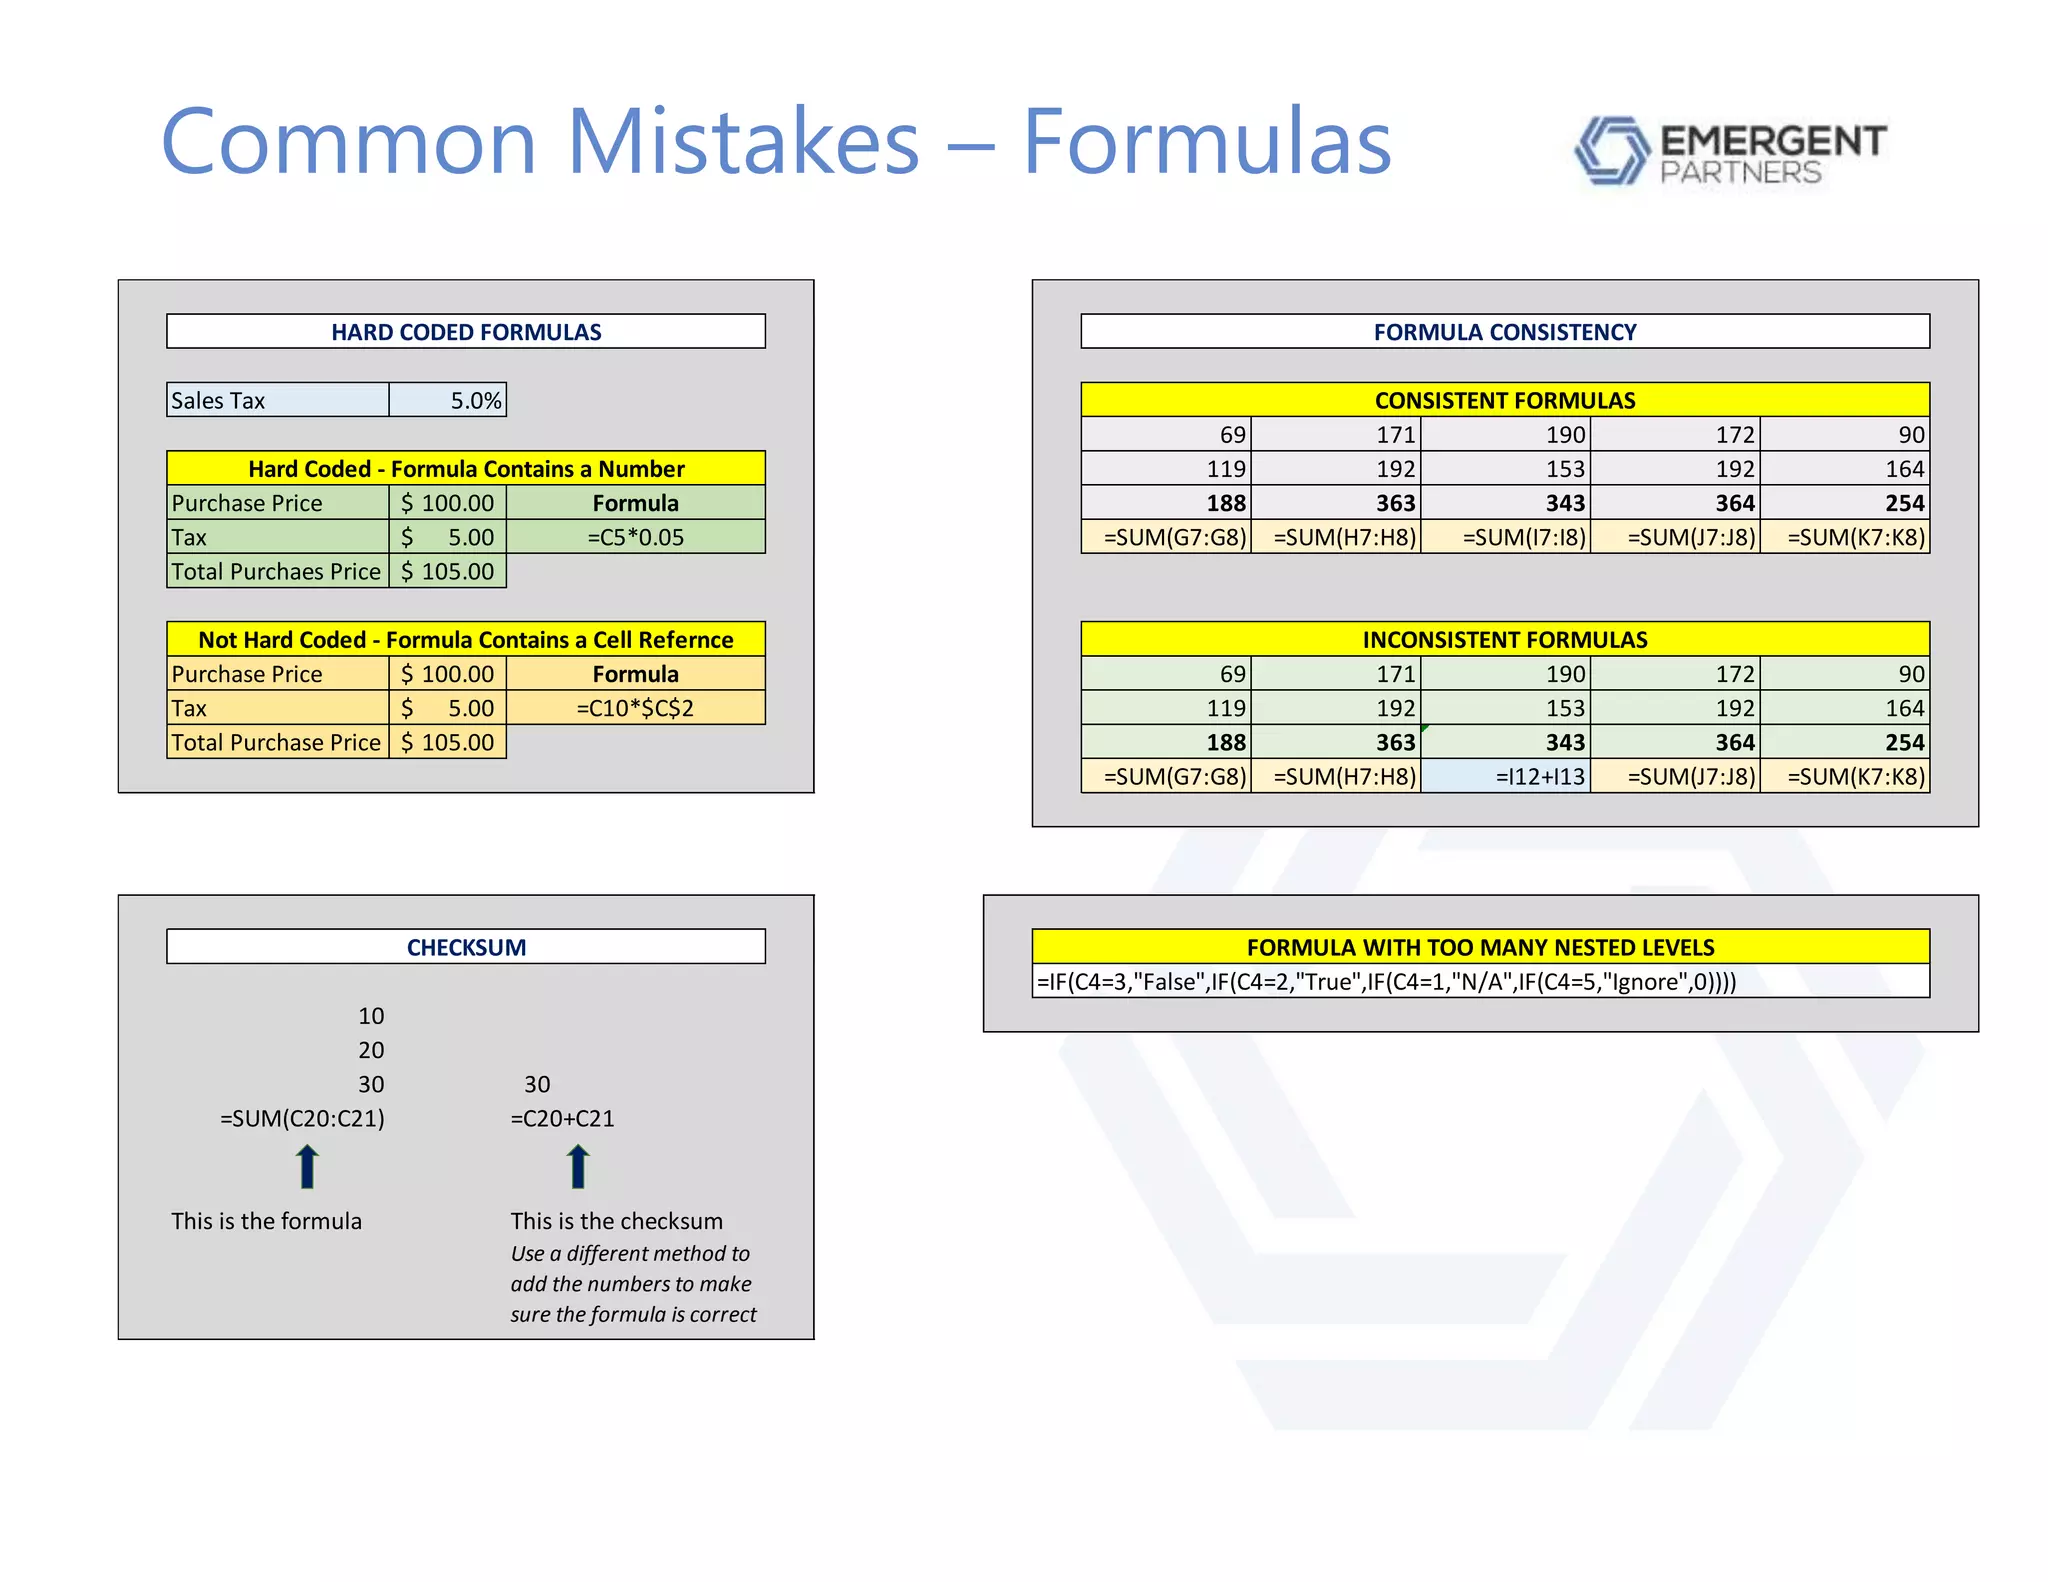
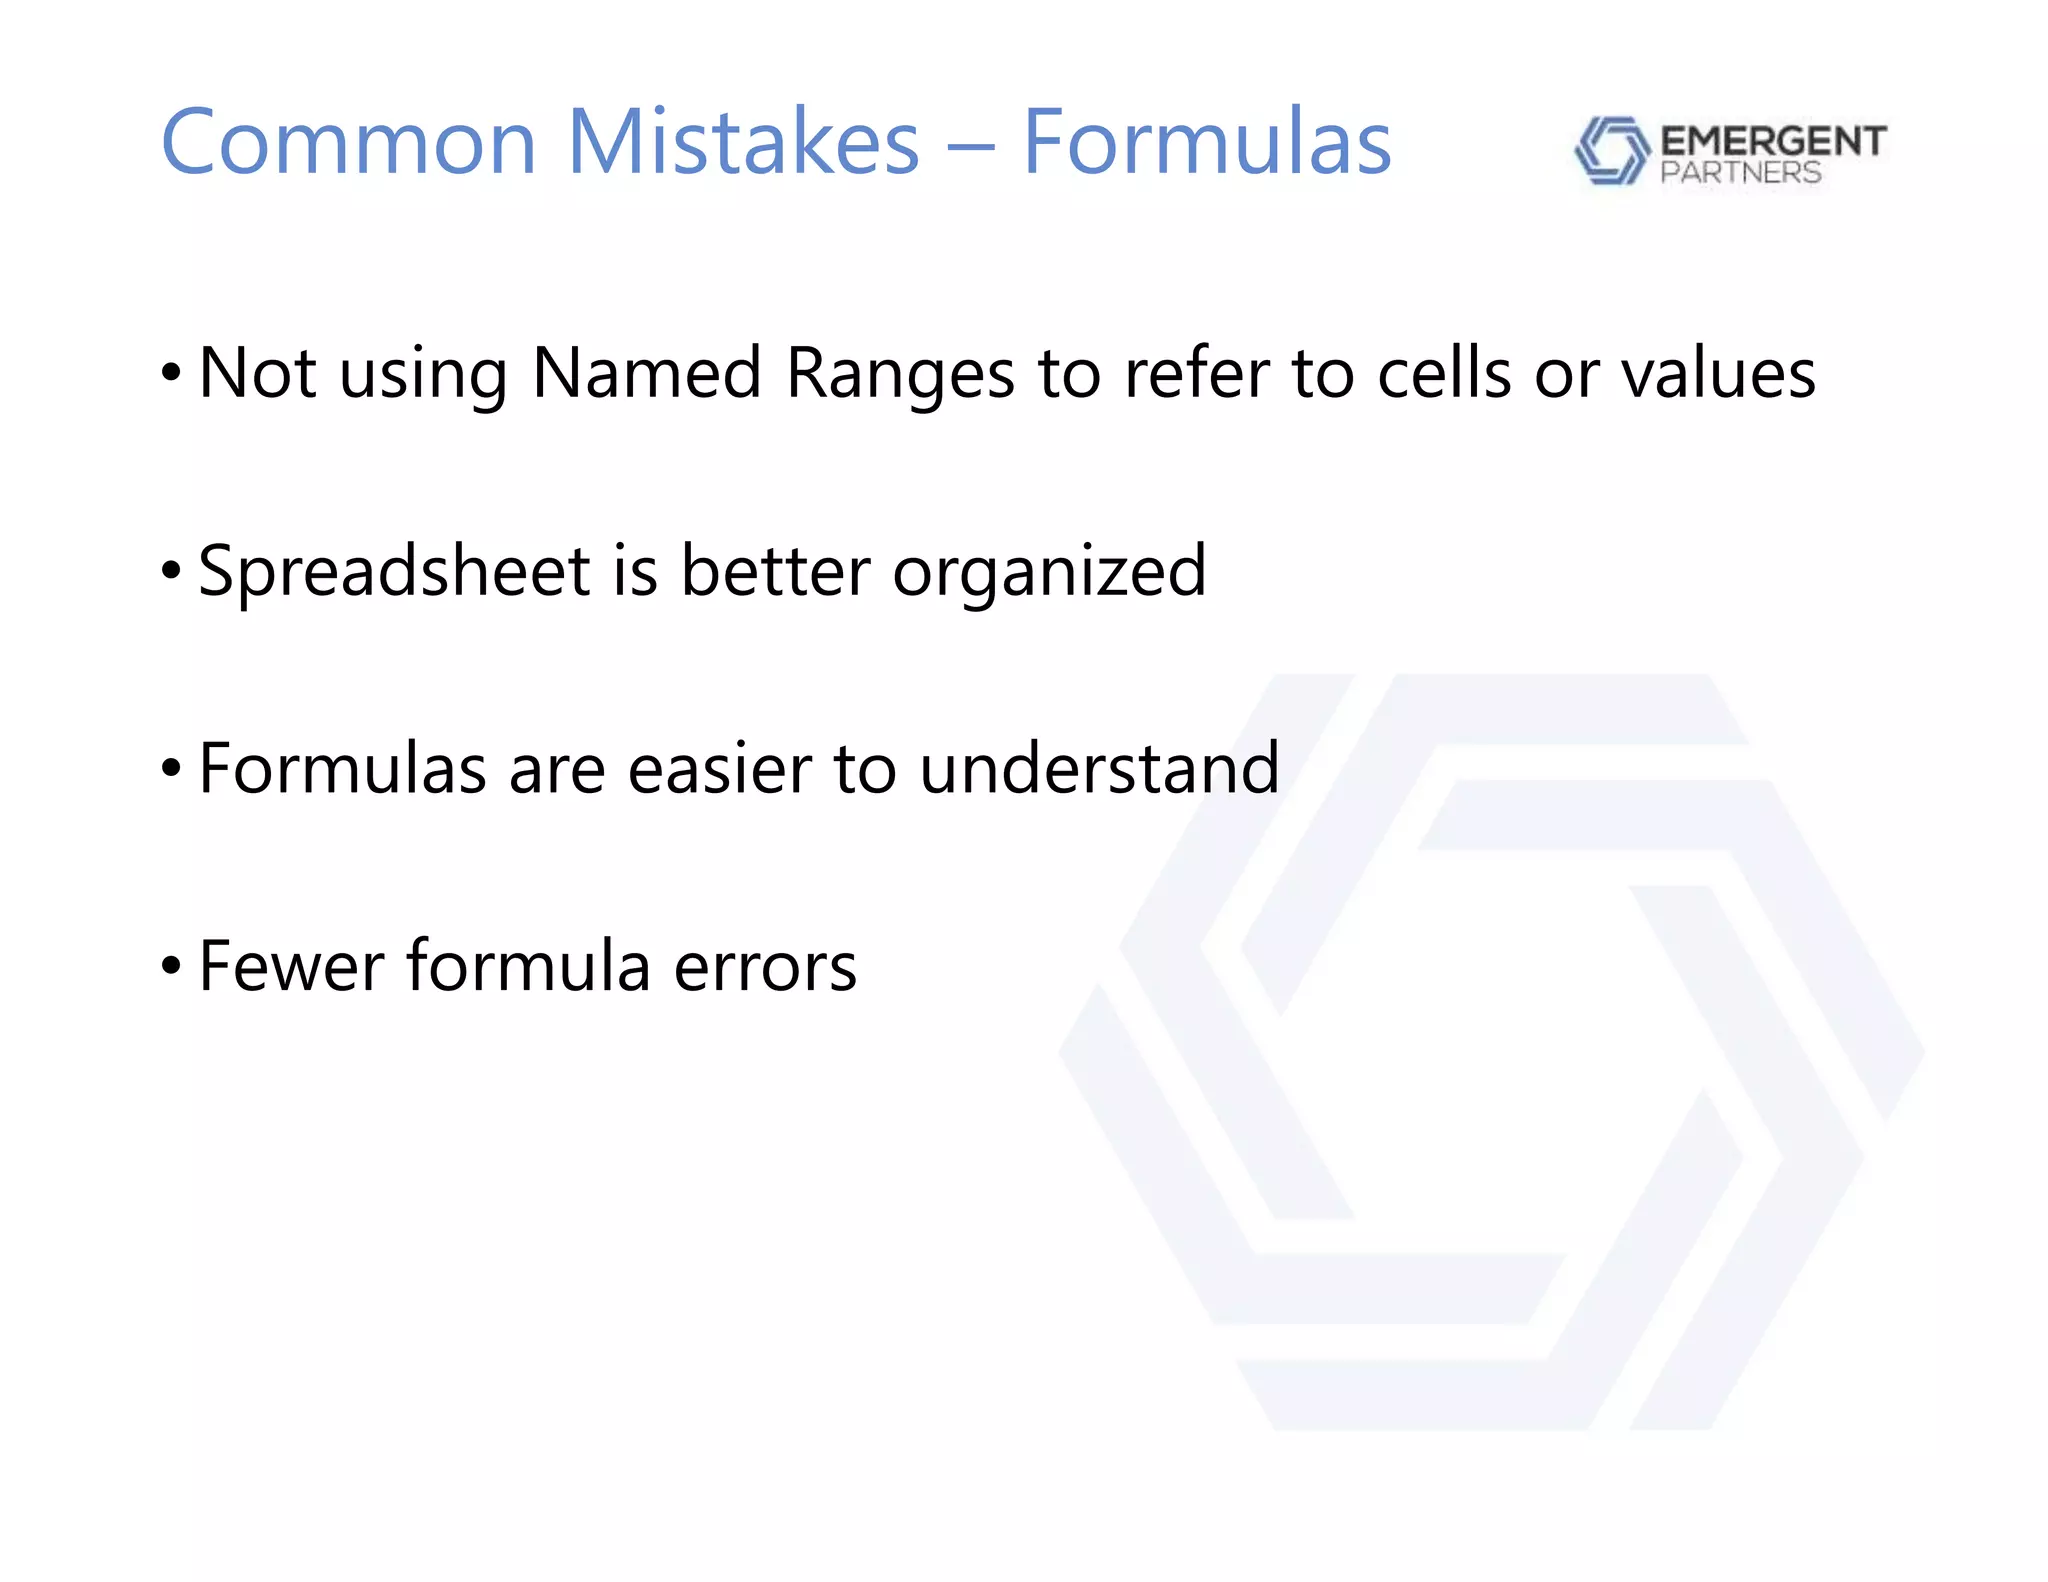
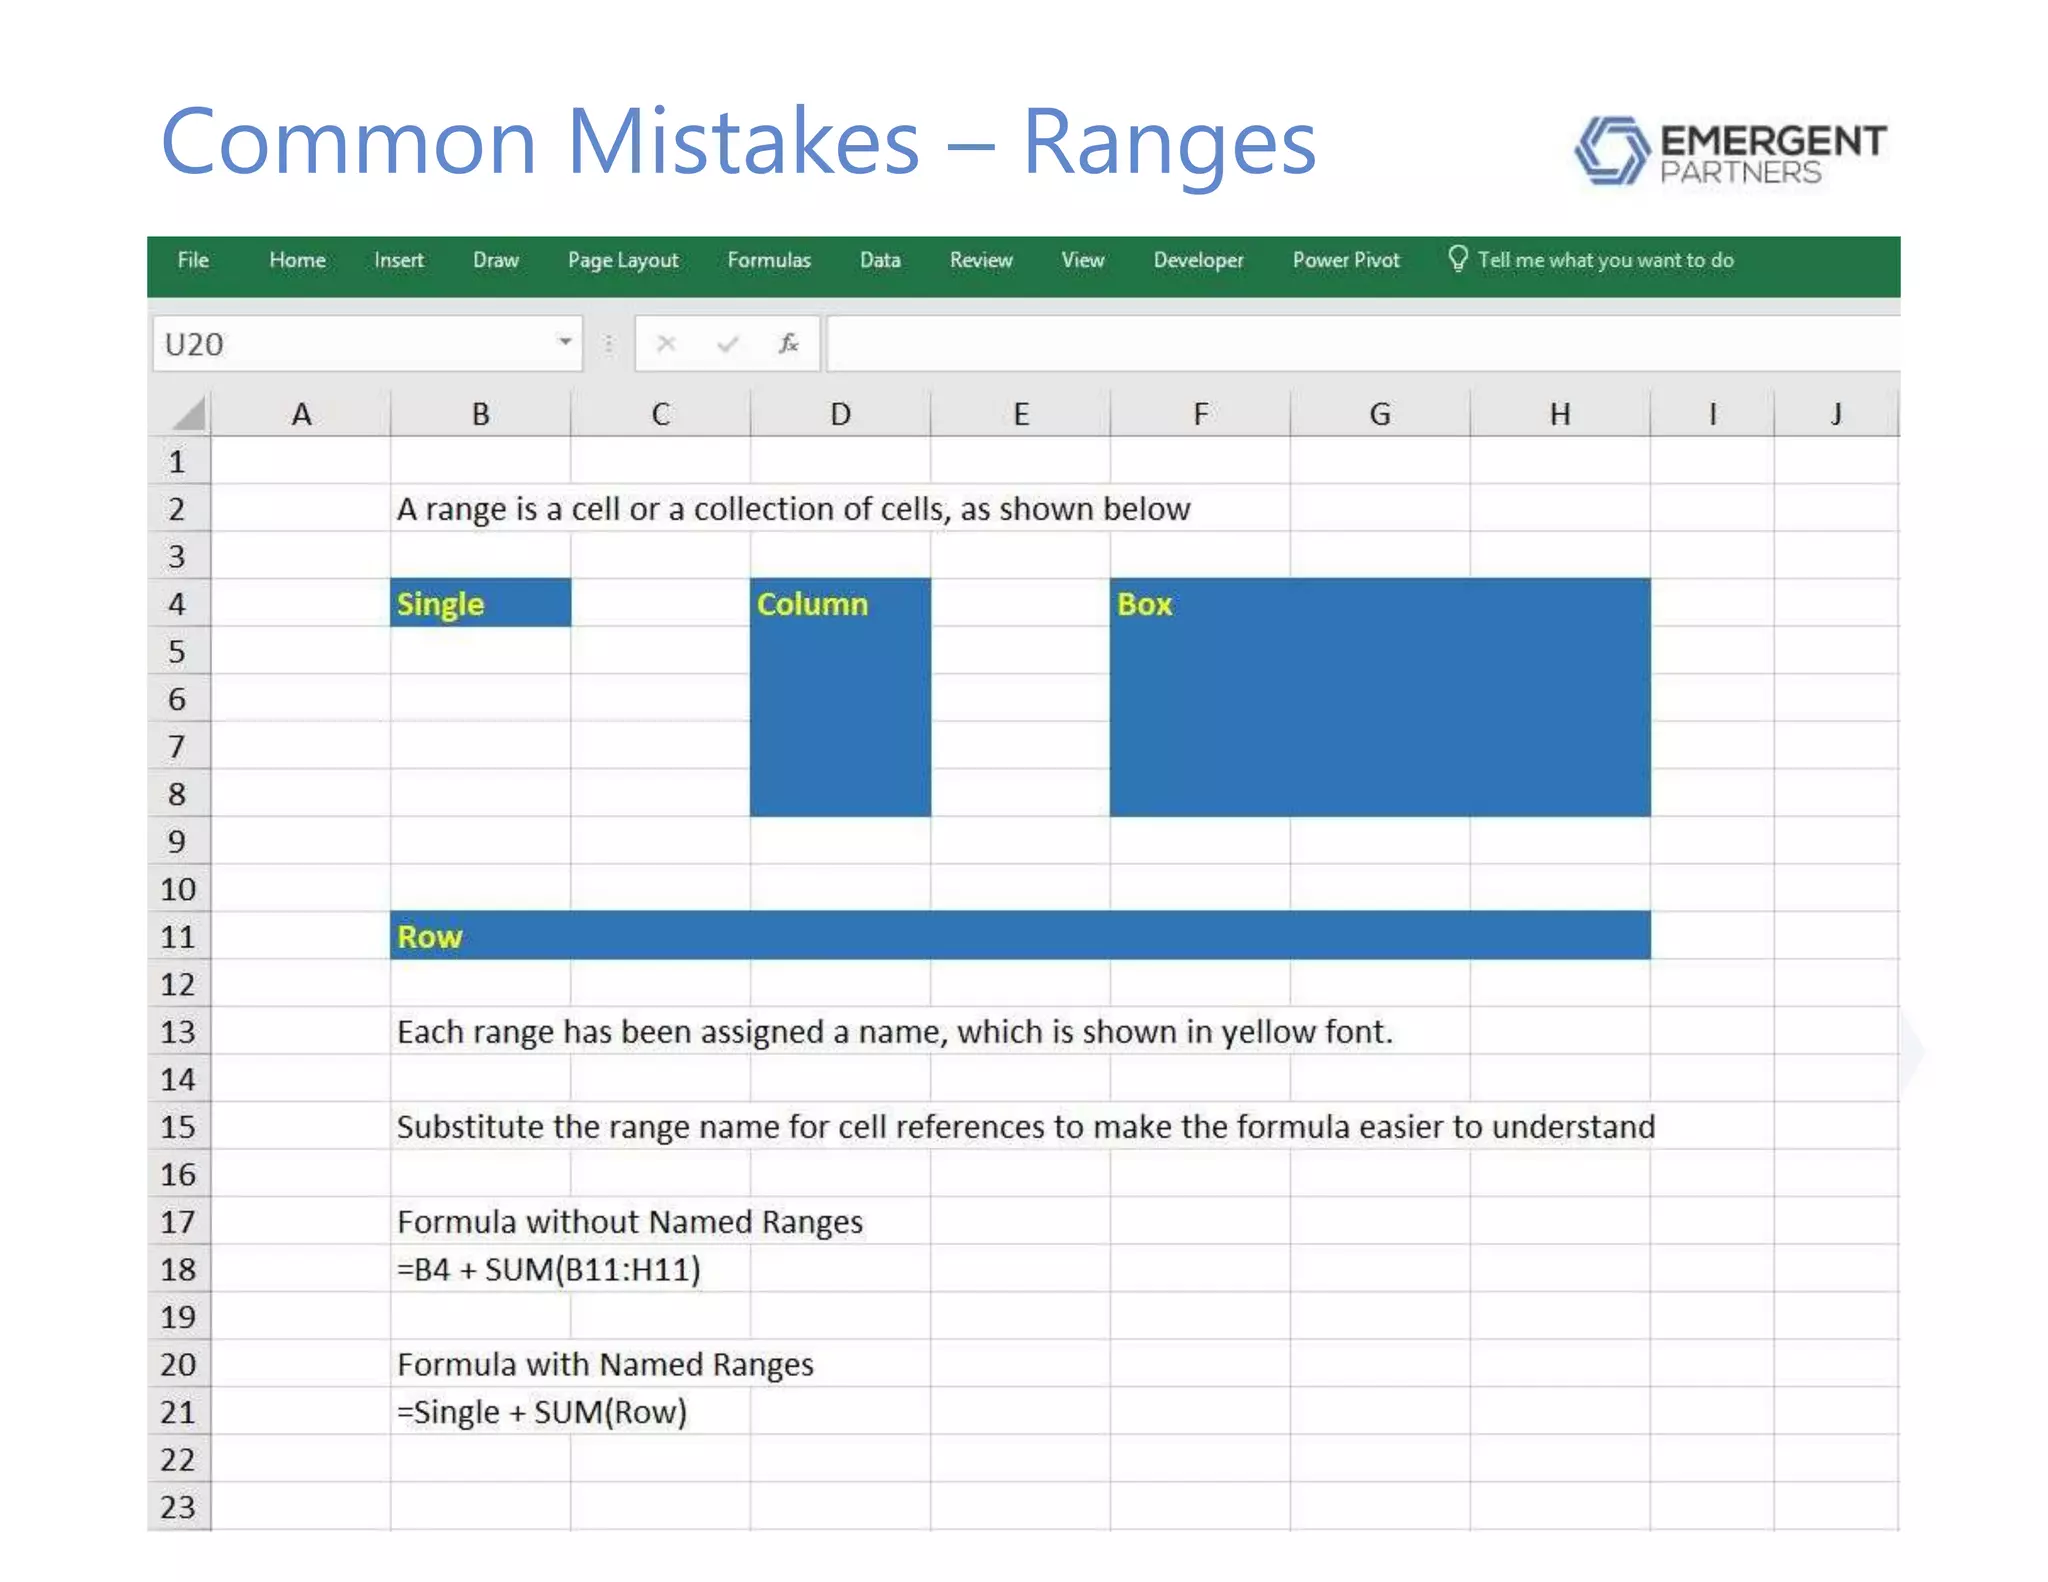
The document provides guidance on utilizing pro forma financial modeling in Microsoft Excel, highlighting the importance of accuracy and integrity in spreadsheets for effective management and investment decisions. It discusses common errors, such as structural mistakes and human errors, and emphasizes the need for proper auditing and analysis of financial statements. Additionally, the document explains how to ensure that pro forma models accurately reflect business operations and financial structures.


