Downloaded 10 times


![56experience. new thinking
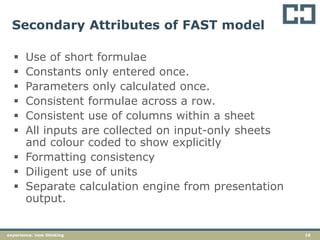
Inputs and assumptions
Review inputs and assumptions, consider
approval requirements for assumptions
included in spreadsheets
Consider inputs for data-entry errors
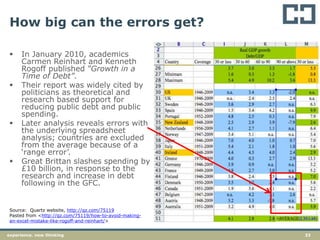
See: ASIC v MacDonald (No 11) [2009] NSWSC 287
(James Hardy case)
Do key assumptions need board level approval?](https://image.slidesharecdn.com/spreadsheetpresentation-140616171144-phpapp02/85/Tips-and-Tricks-for-Optimising-Excel-56-320.jpg)
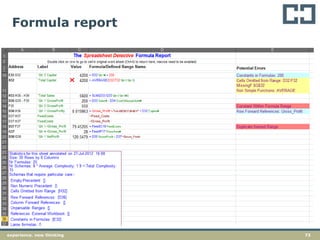


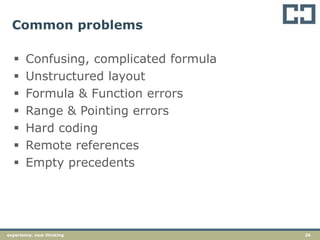
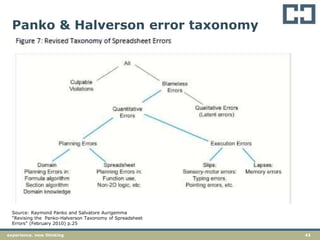
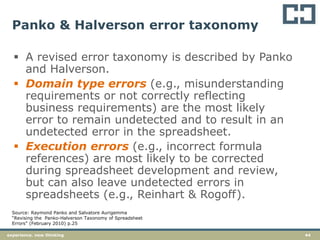
The document summarizes a presentation on optimizing Excel. It discusses common problems with spreadsheets like confusing formulas, unstructured layouts, and errors. It then introduces the FAST standard for building transparent, accurate Excel models. The standard advocates for clear formatting, labeling, and separating inputs from calculations. Finally, it discusses research on common spreadsheet errors and frauds enabled by weaknesses in spreadsheets.


