The report details the principal rare earth elements (REE) deposits in the United States, highlighting their significance for the national economy and key technologies. It provides an overview of domestic reserves, current and potential future production, and the issues of supply dependence on foreign sources, particularly China. Additionally, the document reviews geological aspects, mineral deposits, and the global context of REE resources.

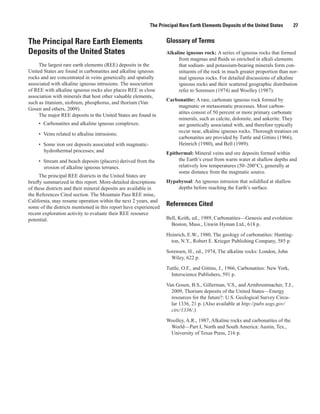
![The Rare Earth Elements 5
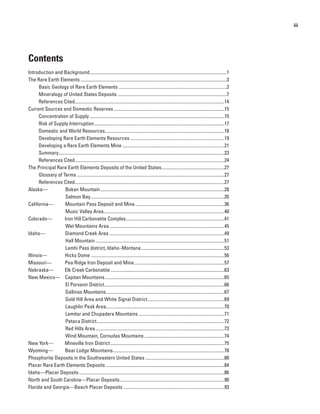
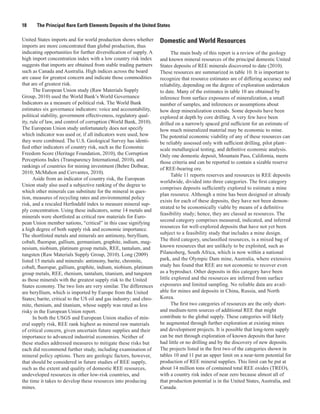
Table 1. Estimates of the crustal abundances of rare earth elements.
[Rare earth elements listed in order of increasing atomic number; yttrium (Y) is included with these elements because it shares chemical and physical similarities
with the lanthanides. Unit of measure, parts per million]
Mason Jackson and Sabot and
Rare earth Wedephol Lide McGill
and Moore Christiansen Maestro
element (1995) (1997) (1997)
(1982) (1993) (1995)
Lanthanum 30 29 18 30 39 5 to 18
Cerium 60 70 46 60 66.5 20 to 46
Praseodynium 8.2 9 5.5 6.7 9.2 3.5 to 5.5
Neodymium 28 37 24 27 41.5 12 to 24
Samarium 6 8 6.5 5.3 7.05 4.5 to 7
Europium 1.2 1.3 0.5 1.3 2 0.14 to 1.1
Gadolinium 5.4 8 6.4 4 6.2 4.5 to 6.4
Terbium 0.9 2.5 0.9 0.65 1.2 0.7 to 1
Dysprosium 3 5 5 3.8 5.2 4.5 to 7.5
Holmium 1.2 1.7 1.2 0.8 1.3 0.7 to 1.2
Erbium 2.8 3.3 4 2.1 3.5 2.5 to 6.5
Thulium 0.5 0.27 0.4 0.3 0.52 0.2 to 1
Ytterbium 3.4 0.33 2.7 2 3.2 2.7 to 8
Lutetium 0.5 0.8 0.8 0.35 0.8 0.8 to 1.7
Yttrium 33 29 28 24 33 28 to 70
Scandium 22 10 16 22 5 to 10
Total 206.1 205.2 159.9 184.3 242.17
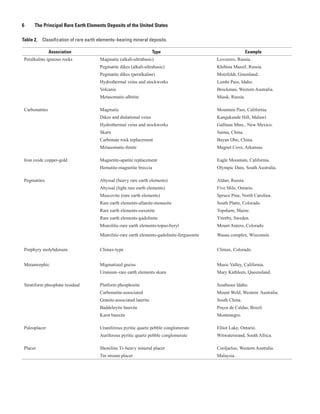
A particular type of REE deposit, the ion-absorption type, is Karst bauxites, aluminum-rich soils that accumulate in
formed by the leaching of rare earth elements from seemingly cavernous limestone (underlying karst topography) in Mon-
common igneous rocks and fixing the elements onto clays in tenegro and elsewhere, are enriched in rare earth elements,
soil. These deposits are only known in southern China and but the resulting concentrations are not of economic interest
Kazakhstan and their formation is poorly understood. (Maksimović and Pantó, 1996). The same can be said for
Among pegmatites, a group of very coarse grained marine phosphate deposits, which can contain as many as
intrusive igneous rocks, the niobium-yttrium-fluorine fam- 0.1 percent REE oxides (Altschuler and others, 1966). As
ily, comprises a large number of subtypes formed in differ- a result, recovery of rare earth elements as a byproduct of
ent geologic environments. These subtypes are granitic in phosphate fertilizer manufacture has been investigated.
composition and are usually found peripheral to large granitic
The ores of rare earth elements are mineralogically and
intrusions. In general, however, rare earth elements−bearing
chemically complex and commonly radioactive.
pegmatites are generally small and are of economic interest
only to mineral collectors. In many base and precious metal deposits, the metals
The iron-oxide copper-gold type of deposit has been extracted are highly concentrated in a single mineral phase, such
recognized as a distinct deposit type only since the discovery as copper in chalcopyrite (CuFeS2) or zinc in sphalerite (ZnS).
of the giant Olympic Dam deposit in South Australia in the Separation of a single mineral phase from rock is a relatively
1980s. The Olympic Dam deposit is unusual in that it contains easy task. The final product is a concentrate typically sent to a
large amounts of rare earth elements and uranium. An eco- smelter for final extraction and refining of the metals. Zinc, for
nomic method for recovering rare earth elements from these example, is almost entirely derived from the mineral sphaler-
deposits has not yet been found. Many other deposits of this ite, such that the global zinc smelting and refining industry has
type have been identified around the world, but information developed a highly specialized treatment of this mineral. Thus,
on their rare earth elements content is generally lacking. Trace production of zinc has a pronounced cost advantage in that a
amounts of rare earth elements have also been identified in single standard technology is used, and the development of a
magnetite-apatite replacement deposits. new zinc mine is a largely conventional process.](https://image.slidesharecdn.com/usgs-rareearth-110110140819-phpapp01/85/USGS-The-Principal-Rare-Earth-Elements-Deposits-of-the-United-States-13-320.jpg)
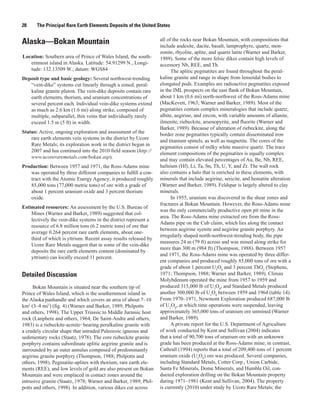
![The Rare Earth Elements 7
Current mineral-processing practice is capable of sequen- an oxide mineral that forms a series with the mineral polycrase
tial separation of multiple mineral phases but it is not always [(Y,Ca,Ce,U,Th)(Ti,Nb,Ta)2O6]. Other rare earth elements oxide
cost effective to do so. When elements of interest are found in (REO) minerals, such as fergusonite, aeschynite, and samar-
two or more mineral phases, each requiring a different extrac- skite, have similar properties, making identification in hand
tion technology, mineral processing is relatively costly. Many sample difficult. Euxenite is black with a tabular to prismatic
rare earth elements deposits contain two or more rare earth habit, making it indistinguishable from rutile, a common oxide
elements−bearing phases. Therefore, rare earth elements depos- mineral, when found in massive form. However, euxenite does
its in which the rare earth elements are largely concentrated in not have any cleavage planes and, unlike rutile, has a conchoi-
a single mineral phase have a competitive advantage. To date, dal fracture. Furthermore, because euxenite is ordinarily found
REE production has largely come from single-mineral-phase in granite pegmatites, it is commonly associated with quartz,
deposits, such as Bayan Obo (bastnasite), Mountain Pass (bast- feldspars, columbite (now called ferrocolumbite), tantalite (now
nasite), and heavy-mineral placers (monazite). called ferrotantalite or manganocolumbite), and monazite.
Rare earth elements−bearing minerals, once separated, Bastnasite (also spelled bastnäsite or bastnaesite) is a rare
contain as many as 14 individual rare earth elements (lan- REE-bearing carbonate mineral [(Ce, La,Y)CO3F] that forms a
thanides and yttrium) that must be further separated and series with the mineral hydroxyl-bastnasite [(Ce,La)CO3(OH,F)].
refined. The complexity of extracting and refining rare earth Bastnasite can be pale white, tan, gray, brown, yellow, or pink,
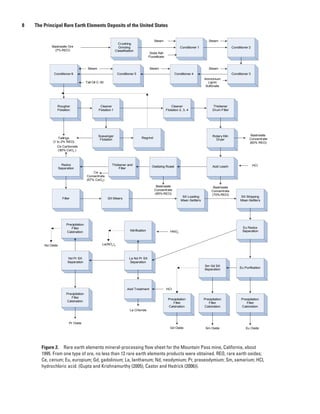
elements is illustrated by a metallurgical flow sheet for the with a pearly, vitreous, or greasy to dull luster. Bastnasite usu-
Mountain Pass mine in California (fig. 2). Unlike metal sul- ally forms small rounded hexagonal or short prismatic crystals,
fides, which are chemically simple compounds, REE-bearing though it can also form rosettes and spheres. Both massive and
minerals are quite complex (table 3). Base metal sulfide ores, granular varieties have been observed. Bastnasite is closely
such as sphalerite (ZnS), are typically smelted to burn off sulfur related to the mineral parisite [Ca(Ce,La)2(CO3)3F2] and has
and separate impurities from the molten metal. The resulting been known to replace crystals of allanite.
metal is further refined to near purity by electrolysis. Rare earth Xenotime is a Y-bearing phosphate mineral (YPO4) and
elements, on the other hand, are typically extracted and refined can be yellowish brown to reddish brown with a vitreous to
through dozens of chemical processes to separate the different resinous luster. Less common colors include gray, salmon
rare earth elements and remove impurities. pink, and green. Xenotime is usually an accessory mineral in
The principal deleterious impurity in REE-bearing miner- acidic and alkaline rocks, though it has been observed in mica
als is thorium, which imparts an unwanted radioactivity to the schists and quartz-rich gneisses; it may also be a detrital min-
ores. Because radioactive materials are difficult to mine and eral. Xenotime can easily be confused with zircon because of
handle safely, they are heavily regulated. When a radioactive similarities in crystal habit and overall appearance. However,
waste product is produced, special disposal methods must be xenotime is not as hard as zircon and demonstrates perfect
used. The cost of handling and disposing of radioactive mate- {100} cleavage.
rial is a serious impediment to the economic extraction of the Monazite is a REE- and thorium-bearing phosphate min-
more radioactive REE-rich minerals, in particular monazite, eral [(Ce,La,Y,Th)PO4] and typically contains 60–62 percent
which typically contains considerable amounts of thorium. In total rare-earth oxides. Monazite’s resistance to chemical
fact, imposition of tighter regulations on the use of radioactive weathering and its high specific gravity account for its asso-
minerals drove many sources of monazite out of the rare earth ciation with other resistant heavy minerals such as ilmenite,
elements market during the 1980s. magnetite, rutile, and zircon. Because monazite is radioactive,
The complex metallurgy of rare earth elements is com- however, grains can be metamict, which means they have lost
pounded by the fact that no two REE ores are truly alike. As their crystalline structure owing to radioactive decay. Crystals
a result, there is no standard process for extracting the REE- of monazite are yellow to brown or orange-brown with a vitre-
bearing minerals and refining them into marketable rare earth ous and resinous or adamantine luster. Monazite grains are
compounds. To develop a new rare earth elements mine, the ores usually equant to prismatic with wedge-shaped terminations.
must be extensively tested by using a variety of known extrac- Both granular and massive forms exist.
tion methods and a unique sequence of optimized processing Allanite [Ca(Ce,La,Y,Ca)Al2(Fe2+,Fe3+)(SiO4)(Si2O7)
steps. Compared with a new zinc mine, process development for O(OH)], which belongs to the epidote mineral group, is
rare earth elements costs substantially more time and money. one of the more common REE-bearing minerals in igneous
rocks but is rarely concentrated enough to be an ore of REE.
Mineralogy of United States Deposits Allanite grains are tabular and usually black, though dark
brown to brownish violet varieties also occur. Allanite has a
The main REE-bearing minerals found in the United conchoidal fracture and is commonly metamict because of the
States are euxenite, bastnasite, xenotime, monazite, and radioactive decay of thorium. The presence of a halo or dark
allanite. Samarskite, aeschynite, fergusonite, parisite, syn- ring inside the mineral grain is also an effect of its radioactiv-
chisite, tengerite, ancylite, florencite, britholite, kainosite, and ity. Most commonly, allanite is found as an accessory mineral
thalenite have also been identified in United States deposits in igneous rocks, such as granites, syenites, diorites, and
(table 4). Euxenite [(Y,Er,Ce,U,Pb,Ca)(Nb,Ta,Ti)2(O,OH)6] is associated pegmatites.](https://image.slidesharecdn.com/usgs-rareearth-110110140819-phpapp01/85/USGS-The-Principal-Rare-Earth-Elements-Deposits-of-the-United-States-15-320.jpg)
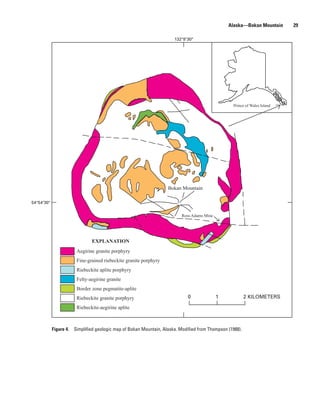
![The Rare Earth Elements 9
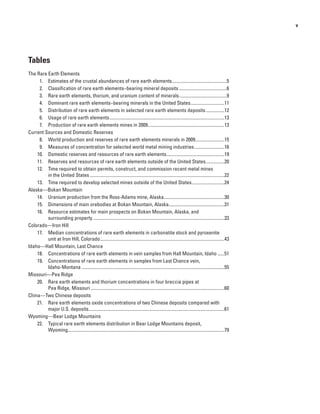
Table 3. Rare earth elements, thorium, and uranium content of minerals found in rare earth elements deposits.—Continued
[--, not available; REO, rare earth elements oxides. Minerals in bold have historically been processed to recover rare earth elements. Small quantities of other
minerals may be found in deposits that are or have been mined or in unmined deposits]
Content (weight percent)
Mineral Formula
REO ThO2 UO2
Allanite (Ce) (Ce,Ca,Y)2(Al,Fe2+,Fe3+)3(SiO4)3(OH) 3 to 51 0 to 3 --
Allanite (Y) (Y,Ce,Ca)2(Al,Fe )3(SiO4)3(OH)
3+
3 to 51 0 to 3 --
Anatase (Ti,REE)O2 -- -- --
Ancylite (Ce) SrCe(CO3)2OH·H20 46 to 53 0 to 0.4 0.1
Bastnasite (Ce) (Ce,La)(CO3)F 70 to 74 0 to 0.3 0.09
Brannerite (U,Ca,Y,Ce)(Ti,Fe)2O6 -- -- --
Britholite (Ce) (Ce,Ca)5(SiO4,PO4)3(OH,F) 56 1.5 --
Brockite (Ca,Th,Ce)(PO4)·H2O -- -- --
Calcio-ancylite (Ce) (Ca,Sr)Ce3(CO3)4(OH)3·H2O 60 -- --
Cerianite (Ce) (Ce4+,Th)O2 -- -- --
Cerite (Ce) Ce9Fe3+(SiO2)6[(SiO3)(OH)](OH)3 -- -- --
Cheralite (Ca,Ce,Th)(P,Si)O4 -- ≤30 --
Chevkinite (Ca,Ce,Th)4(Fe ,Mg)2(Ti,Fe )3Si4O22
2+ 3+
-- -- --
Churchite (Y) YPO4·H2O -- -- --
Crandallite CaAl3(PO4)2(OH)5·H2O -- -- --
Doverite YCaF(CO3)2 -- -- --
Eudialyte Na4(Ca,Ce)2(Fe2+,Mn2+,Y)ZrSi8O22(OH,Cl)2 1 to 10 -- --
Euxenite (Y) (Y,Ca,Ce,U,Th)(Nb,Ta,Ti)2O6 -- -- --
Fergusonite (Ce) (Ce,La,Y)NbO4 -- -- --
Fergusonite (Y) YNbO4 -- -- --
Florencite (Ce) CeAl3(PO4)2(OH)6 -- 1.4 --
Florencite (La) (La,Ce)Al3(PO4)2(OH)6 1.4
Fluocerite (Ce) (Ce,La)F3 -- -- --
Fluocerite (La) (La,Ce)F3 -- -- --
Fluorapatite (Ca,Ce)5(PO4)3F 0 to 21 0 to 0.01
Fluorite (Ca,REE)F -- -- --
Gadolinite (Y) Y2Fe Be2Si2O10
2+
40 -- --
Gagarinite (Y) NaCaY(F,Cl)6 -- -- --
Gerenite (Y) (Ca,Na)2(Y,REE)3Si6O18·2H2O -- -- --
Gorceixite (Ba,REE)Al3[(PO4)2(OH)5]·H2O -- -- --
Goyazite SrAl3(PO4)2(OH)5·H2O -- 1.4 --
Hingganite (Y) (Y,Yb,Er)2Be2Si2O8(OH)2 -- -- --
Iimoriite (Y) Y2(SiO4)(CO3) -- -- --
Kainosite (Y) Ca2(Y,Ce)2Si4O12(CO3)·H2O -- -- --
Loparite (Ce) (Ce,Na,Ca)(Ti,Nb)O3 32 to 34 -- --](https://image.slidesharecdn.com/usgs-rareearth-110110140819-phpapp01/85/USGS-The-Principal-Rare-Earth-Elements-Deposits-of-the-United-States-17-320.jpg)
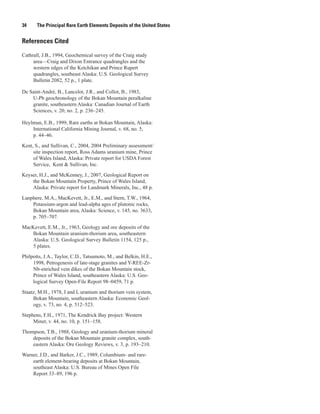
![10 The Principal Rare Earth Elements Deposits of the United States
Table 3. Rare earth elements, thorium, and uranium content of minerals found in rare earth elements deposits.—Continued
[--, not available; REO, rare earth elements oxides. Minerals in bold have historically been processed to recover rare earth elements. Small quantities of other
minerals may be found in deposits that are or have been mined or in unmined deposits]
Content (weight percent)
Mineral Formula
REO ThO2 UO2
Monazite (Ce) (Ce,La,Nd,Th)PO4 35 to 71 0 to 20 0 to 16
Parisite (Ce) Ca(Ce,La)2(CO3)3F2 59 0 to 0.5 0 to 0.3
Perovskite (Ca,REE)TiO3 ≤37 0 to 2 0 to 0.05
Pyrochlore (Ca,Na,REE)2Nb2O6(OH,F) -- -- --
Rhabdophane (Ce) (Ce,La)PO4·H2O -- -- --
Rhabdophane (La) (La,Ce)PO4·H2O -- -- --
Rinkite (rinkolite) (Ca,Ce)4Na(Na,Ca)2Ti(Si2O7)2F2(O,F)2 -- -- --
Samarskite (REE,Fe2+,Fe3+,U,Th,Ca)(Nb,Ta,Ti)O4 -- -- --
Sphene (titanite) (Ca,REE)TiSiO5 ≤3 -- --
Steenstrupine (Ce) Na14Ce6Mn2Fe2(Zr,Th)(Si6O18)2(PO4)7·3H2O
Synchysite (Ce) Ca(Ce,La)(CO3)2F 49 to 52 1.6 --
Synchysite (Y) (doverite) Ca(Y,Ce)(CO3)2F -- -- --
Thalenite (Y) Y3Si3O10(F,OH) -- -- --
Thorite (Th,U)SiO4 ≤3 -- 10 to 16
Uraninite (U,Th,Ce)O2 -- -- --
Vitusite (Ce) Na3(Ce,La,Nd)(PO4)2 -- -- --
Xenotime (Y) YPO4 52 to 67 -- 0 to 5
Yttrofluorite (Ca,Y)F2 -- -- --
Zircon (Zr,REE)SiO4 -- 0.1 to 0.8 --
Lateritic deposits—highly weathered soil horizons, elements are typically more abundant than heavy rare earth
rich in iron and aluminum oxide minerals, which develop elements.
in a tropical or forested warm environment—have been
The relative proportion of the different rare earth ele-
studied as a potential source of REE; these lateritic REE
ments in an orebody is quite variable (table 5). The chief
deposits may contain large resources when they overlie low-
differences can be seen in the relative proportion of light to
grade primary sources, such as carbonatites and syenites.
heavy rare earth elements. REE orebodies are typically some-
At present, however, only two districts (both in southern
what enriched in the light REE—lanthanum to gadolinium—
China) have been mined in this capacity. These surficial clay
compared with average crustal abundances. In comparison,
deposits account for 14 percent of Chinese REE produc-
most rare earth ores are notably depleted in the heavy REE—
tion (Wu and others, 1996). The ore is referred to as REE-
terbium to lutetium. A minority of deposits are relatively
bearing ionic absorption clay and forms weathering crusts
enriched in heavy REE, most commonly those that contain
over granite (Ren, 1985; Wu and others, 1996). Laterite clays
xenotime as the principal REE mineral.
from Longnan in the Jiangxi Province yield heavy REE- and
Given that each individual rare earth element has its own
Y-rich material whereas ore from Xunwu is light REE−rich
particular uses and market (table 6), the proportions of the
(O’Driscoll, 2003).
various rare earth elements in a deposit are unlikely to parallel
The relative abundance of rare earth elements within and those of demand for rare earth elements. For instance, the most
among deposits is highly variable, but light rare earth abundant rare earth element, cerium, is available in quantities](https://image.slidesharecdn.com/usgs-rareearth-110110140819-phpapp01/85/USGS-The-Principal-Rare-Earth-Elements-Deposits-of-the-United-States-18-320.jpg)
![The Rare Earth Elements 11
Table 4. Dominant rare earth elements–bearing minerals identified in the United States.
Mineral Formula
Oxides
Aeschynite (Ce,Th,Ca...)[(Ti,Nb,Ta)2O6]
Euxenite (Y,Er,Ce,U,Pb,Ca)(Nb,Ta,Ti)2(O,OH)6
Fergusonite YnbO4
Samarskite (Y,Er,Fe,Mn,Ca,U,Th,Zr)(Nb,Ta)2(O,OH)6
Carbonates
Ancylite Sr(Ce,La)(CO3)2(OH)·(H2O)
Bastnasite (Ce, La,Y)CO3F
Parisite Ca(Ce,La)2(CO3)3F2
Synchisite Ca(Ce,Nd,Y,La)(CO3)2F
Tengerite Y2(CO3)3•n(H2O)
Phosphates
Britholite (Na,Ce,Ca)5(OH)[(P,Si)O4]3
Florencite (La,Ce)Al3(PO4)2(OH)6
Monazite (Ce,La,Th,Nd,Y)PO4
Xenotime YPO4
Silicates
Allanite Ca(Ce,La,Y,Ca)Al2(Fe2+,Fe3+)(SiO4)(Si2O7)O(OH)
Kainosite Ca2(Ce,Y)2(SiO4)3CO3·H2O
Thalenite Y2[Si2O7]
that exceed demand for traditional uses (Heymann, 2010). feature of rare earth elements mining is that REE-rich
Most REE deposits currently (2010) considered for develop- minerals may be byproducts or coproducts of mining other
ment are enriched in light REE and would likely flood the mineral commodities.
market for cerium if put into production. By contrast, heavy Mine production decisions are driven by demand for
REE are in short supply with limited reserves. Certain rare principal products, not for byproducts. Thus, production
earth elements, such as lutetium, presently have no market and of byproduct REE will vary subject to changes in demand
are not worth recovering at this time. for principal products and will be relatively unresponsive
to demand for REE. China currently (2010) accounts for
Rare earth elements are typically obtained as a byproduct or
about 96 percent of global rare earth elements production
coproduct of mining other mineral commodities.
(table 7). Of a total production of 120,000 metric tons,
When the economic viability of a mining project is about 55,000 metric tons was produced as a byproduct of
assessed, the potential mineral products are divided into the Bayan Obo iron mine. This fact means that at least 44
principal products and byproducts. The principal product, percent of world rare earth elements production is a by-
for example zinc in a zinc mine, contributes most to the product. Of the remaining Chinese production, about 25,000
value of the minerals produced. Generally, returns from the metric tons is produced in southern China as a primary
principal product are sufficient to pay the costs of mining product from ion-adsorption deposits. The status of remain-
and processing. All other products are referred to as by- ing Chinese production is unclear. The balance of global
products, whose returns typically bolster the overall profit- REE production is as a byproduct. Conceivably, as much as
ability of a mine. Where two or more products of essential 90 percent of global rare earth elements production is as a
value are obtained, they are called coproducts. A salient byproduct or coproduct.](https://image.slidesharecdn.com/usgs-rareearth-110110140819-phpapp01/85/USGS-The-Principal-Rare-Earth-Elements-Deposits-of-the-United-States-19-320.jpg)
![12
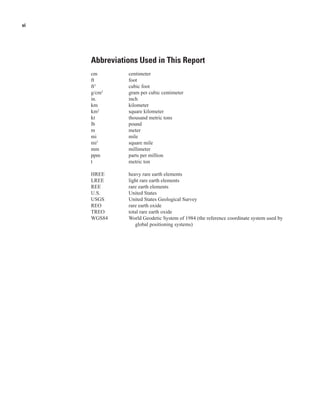
Table 5. Distribution of rare earth elements in selected rare earth elements deposits.
[Rare earth elements listed in order of increasing atomic number; yttrium (Y) is included with these elements because it shares chemical and physical similarities with the lanthanides]
High Y Low Y
Average Bastnasite Bastnasite Monazite Xenotime Bulk ore Bulk ore
REE laterite REE laterite
upper crustal Mountain Pass, Bayan Obo, Green Cove Spring, Lehat, Bear Lodge, Strange Lake,
Rare earth Longnan, Xunwu,
abundance USA China USA Malaysia USA Canada
element China China
(percent) (percent) (percent) (percent) (percent) (percent) (percent)
(percent) (percent)
Wedepohl (1995) Castor (2008) Hedrick (2004) Hedrick (2004) Hedrick (2004) Castor (2008) Castor (2008)
Hedrick (2004) Hedrick (2004)
Lanthanum 19.3 33.8 23.0 17.5 1.2 1.8 43.4 30.4 4.6
Cerium 39.2 49.6 50.0 43.7 3.1 0.4 2.4 45.5 12.0
Praseodynium 3.8 4.1 6.2 5.0 0.5 0.7 9.0 4.7 1.4
Neodymium 15.5 11.2 18.5 17.5 1.6 3.0 31.7 15.8 4.3
Samarium 2.8 0.9 0.8 4.9 1.1 2.8 3.9 1.8 2.1
The Principal Rare Earth Elements Deposits of the United States
Europium 0.6 0.1 0.2 0.2 Trace 0.1 0.5 0.4 0.2
Gadolinium 1.7 0.2 0.7 6.6 3.5 6.9 3.0 0.7 2.5
Terbium 0.3 0.0 0.1 0.3 0.9 1.3 Trace 0.1 0.3
Dysprosium 1.7 0.0 0.1 0.9 8.3 6.7 Trace 0.2 8.2
Holmium 0.4 0.0 Trace 0.1 2.0 1.6 Trace 0.0 1.7
Erbium 1.3 0.0 Trace Trace 6.4 4.9 Trace 0.0 4.9
Thulium 0.2 0.0 Trace Trace 1.1 0.7 Trace <0.01 0.7
Ytterbium 0.9 0.0 Trace 0.1 6.8 2.5 0.3 0.5 4.0
Lutetium 0.2 Trace Trace Trace 1.0 0.4 0.1 <0.01 0.4
Yttrium 12.3 0.1 Trace 2.5 61.0 65.0 8.0 <0.01 52.8](https://image.slidesharecdn.com/usgs-rareearth-110110140819-phpapp01/85/USGS-The-Principal-Rare-Earth-Elements-Deposits-of-the-United-States-20-320.jpg)
![The Rare Earth Elements 13
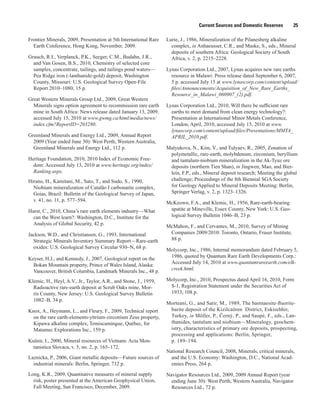
Table 6. Useage of rare earth elements.
[Each rare earth element has its own applications and market. Source: Lynas Corporation (2010)]
Application La Ce Pr Nd Sm Eu Gd Tb Dy Y Other
Magnets -- -- 23.4 69.4 -- -- 2 0.2 5 -- --
Battery alloys 50 33.4 3.3 10 3.3 -- -- -- -- -- --
Metal alloys 26 52 5.5 16.5 -- -- -- -- -- -- --
Auto catalysts 5 90 2 3 -- -- -- -- -- -- --
Petroleum refining 90 10 -- -- -- -- -- -- -- -- --
Polishing compounds 31.5 65 3.5 -- -- -- -- -- -- -- --
Glass additives 24 66 1 3 -- -- -- -- -- 2 4
Phosphors 8.5 11 -- -- -- 4.9 1.8 4.6 -- 69.2 --
Ceramics 17 12 6 12 -- -- -- -- -- 53 --
Other 19 39 4 15 2 -- 1 -- -- 19 --
Table 7. Production of rare earth elements mines in 2009.
[Source: USGS Mineral Commodity Summaries (U.S. Geological Survey, 2010). TREO, total rare earth elements oxide]
2009 output
Country Mine Primary product Byproduct
(metric tons TREO)
Brazil Buena Norte 650 Ilmenite concentrate Monazite concentrate.
China Bayan Obo 55,000 Iron ore Bastnäsite concentrate.
Sichuan1 10,000 Bastnäsite concentrate
South China1 45,000 Rare earth elements
India Heavy-mineral sands 2,700 Ilmenite concentrate Monazite concentrate.
Malaysia Ipoh sand plant 380 Cassiterite concentrate Xenotime concentrate.
Russia Lovozero 2,500 Loparite concentrate Rare earth elements chloride.
1
Many small producers and a few medium-large producers. The Chinese rare earth elements–mining industry is currently (2010) undergoing government-
directed rationalization to reduce the number of producers.](https://image.slidesharecdn.com/usgs-rareearth-110110140819-phpapp01/85/USGS-The-Principal-Rare-Earth-Elements-Deposits-of-the-United-States-21-320.jpg)
![Current Sources and Domestic Reserves 15
Current Sources and Domestic Concentration of Supply
Reserves The high concentration of production of REE in one
country is not unusual for a minor metal commodity. For
The United States currently imports all of its rare earth example, a single mine in the United States supplies 86
elements (REE) raw materials from foreign sources, prin- percent of world demand for beryllium and two mines in
cipally China (U.S. Geological Survey, 2010). This has not Brazil account for 92 percent of world niobium production
always been the case. The USGS annually reports global and (U.S. Geological Survey, 2010). Such concentration of supply,
domestic production and trade in REE in its publications which has long been of concern in regard to price manipula-
Minerals Yearbook and Mineral Commodity Summaries. tion, also raises issues related to reliability of supply. Given an
Prior to 1998, when production from the Mountain Pass equal risk of a natural disaster, industrial accident, labor strike,
mine in California was curtailed, the United States produced political strife, or anything else that might interrupt produc-
most of the light REE consumed domestically and by free tion, a single source of supply is inherently more risky than
market countries. Heavy REE were obtained from imported multiple sources of supply. Even though these various risks are
monazite concentrates. That changed in the 1980s after China not equal among countries, concentration of supply is a key
became the dominant global supplier of light and heavy REE indicator of mineral-supply risk.
(Papp and others, 2008). In 2002, the Mountain Pass mine Table 9 compares the supply situation of REE with other
in California, the sole domestic producer of REE minerals, internationally traded minerals using several measures of con-
shut down. Although the mine has continued to produce REE centration. These measures are used by economists to study
materials from stockpiled raw materials, no new REE ores are market concentration and by regulators for antitrust purposes.
being mined. Since then, the United States has obtained all of In table 9, concentration ratios, abbreviated CR2 and CR3,
its REE raw materials from imports, principally from China. measure the total percent share in United States imports and
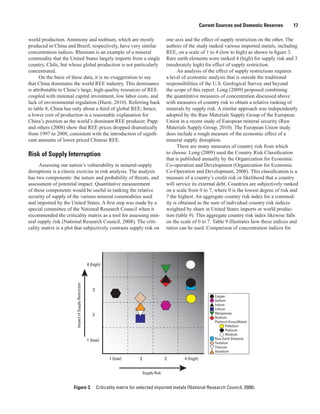
China accounts for 95 percent of global REE production world production of the top two or top three supplier coun-
despite having only 36 percent of identified world reserves tries, respectively. A high percentage, such as the CR2 of 94
(table 8). percent and CR3 of 96 percent shown for REE (excluding
Table 8. World production and reserves of rare earth elements minerals in 2009.
[In 2009, China produced 95 percent of world rare earth elements although it had only 36 percent of
rare earth elements reserves. TREO, total metric tons of rare earth oxides]
2009
Production Reserves
Country
TREO Share TREO Share
(metric tons) (percent) (metric tons) (percent)
Australia 0 0 5,400,000 5
Brazil 650 0.5 48,000 0.05
China 120,000 95 36,000,000 36
Commonweath of
2,500 2 19,000,000 19
Independent States
India 2,700 2 3,100,000 3
Malaysia 380 0.3 30,000 0.03
United States 0 0 13,000,000 13
Other 0 0 22,000,000 22
Total 126,230 99,000,000](https://image.slidesharecdn.com/usgs-rareearth-110110140819-phpapp01/85/USGS-The-Principal-Rare-Earth-Elements-Deposits-of-the-United-States-23-320.jpg)
![16 The Principal Rare Earth Elements Deposits of the United States
Table 9. Measures of concentration for selected world metal mining industries.
[CR2 and CR3, two-county and three-country concentration ratios, respectively. NHI, normalized Herfindahl index. The higher the index, the more concen-
trated are mineral production and United States imports. CR2 and CR3 are rounded to the nearest percent resulting, in some cases, in a slight discrepancy
between the concentration ratios and the normalized Herfindahl index. RI, country risk index. See text for an explanation of indices. Data are for 2007, the
latest year for which complete information is available from the U.S. Geological Survey (2010)]
Import
Mineral United States imports World production
reliance
commodity (percent) (percent)
(percent)
CR2 CR3 NHI RI CR2 CR3 NHI RI
Antimony 86 90 98 0.42 1.9 91 94 0.77 2.3
Bauxite and 100 50 64 0.19 4.6 46 58 0.16 2.8
alumina
Bismuth 95 62 80 0.26 0.8 75 90 0.29 2.3
Cobalt 78 43 56 0.13 1.7 52 63 0.20 1.4
Copper 37 75 88 0.32 1.5 44 51 0.16 2.4
Gallium 99 57 73 0.21 1.3 51 65 0.19 1.9
Indium 100 72 81 0.31 1.3 68 76 0.36 1.4
Manganese 100 54 65 0.21 2.9 46 64 0.17 2.8
Nickel 17 59 68 0.23 1.0 32 46 0.10 2.6
Niobium 100 96 97 0.79 2.7 100 100 0.90 2.9
Platinum 94 50 65 0.17 1.5 91 94 0.63 2.9
Rare earth 100 94 96 0.83 1.9 99 100 0.94 2.0
elements
Rhenium 86 95 98 0.81 1.8 59 68 0.26 2.3
Tantalum 100 35 50 0.13 1.6 75 85 0.35 2.0
Tin 79 69 79 0.31 3.2 74 91 0.30 3.3
Titanium 64 85 94 0.39 3.3 55 77 0.23 2.2
Tungsten 70 50 69 0.19 3.3 81 86 0.57 2.3
Vanadium 100 66 74 0.35 1.5 72 97 0.33 1.5
Yttrium 100 96 99 0.78 1.8 100 100 0.98 2.0
Zinc 58 67 82 0.19 1.1 52 66 0.19 1.9
yttrium and scandium), indicates that imports and world 1
production are principally derived from one or two countries. HI −
A third measure is the Herfindahl index (Stigler, 1983), which NHI = n
was originally developed to measure the degree of competi- 1
1−
tion in an industry. It is calculated according to the equation n
n such that the index ranges from 0 to 1.0, which facilitates
HI = ∑ si2 comparison between different mineral commodities. A normal-
i =1 , ized Herfindahl Index of 1.0 indicates concentration in a single
country; an index of 0 indicates that all countries have exactly
where si is the share in global production or United States the same share in United States imports or world production.
imports by country i with n countries. The larger this index, As shown in table 9, all three of these indices place
the more concentrated are world production and United States REE (including yttrium) at the top of all mineral commodi-
imports by country. The Herfindahl index can be normalized ties in terms of concentration of United States imports and](https://image.slidesharecdn.com/usgs-rareearth-110110140819-phpapp01/85/USGS-The-Principal-Rare-Earth-Elements-Deposits-of-the-United-States-24-320.jpg)
![Current Sources and Domestic Reserves 19
Table 10. Domestic reserves and resources of rare earth elements, excluding heavy-mineral placer and phosphate deposits.
[TREO, total rare earth oxides. Reserves proven and probable classified according to definitions and standards of the Securities and Exchange Commission
(Securities and Exchange Commission = http://www.sec.gov/index.htm). Inferred resources classified according to the standards of Canadian National Instrument
43-101 (Canadian National Instrument 43-101 = http://www.ccpg.ca/profprac/index.php?lang=en&subpg=natguidelines). Unclassified resources based on little
or no drilling. For data on resources in heavy-mineral placer and phosphate deposits, which are not of economic interest, see Jackson and Christiansen (1993)]
Tonnage Grade Contained TREO
Deposit Source
(metric tons) (percent TREO) (metric tons)
Reserves—Proven and probable
Mountain Pass, California 13,588,000 8.24 1,120,000 Molycorp, Inc. (2010).
Resources—Inferred
Bear Lodge, Wyoming 10,678,000 3.60 384,000 Noble and others (2009).
Resources—Unclassified
Bald Mountain, Wyoming 18,000,000 0.08 14,400 Osterwald and others (1966).
Bokan Mountain, Alaska 34,100,000 0.48 164,000 Keyser and Kennedy (2007).
Diamond Creek, Idaho 5,800,000 1.22 70,800 Staatz and others (1979).
Elk Creek, Nebraska 39,400,000 Molycorp, Inc. (1986).
Gallinas Mtns., New Mexico 46,000 2.95 1,400 Jackson and Christiansen (1993).
Hall Mountain, Idaho 100,000 0.05 50 Staatz and others (1979).
Hick’s Dome, Illinois 14,700,000 0.42 62,000 Jackson and Christiansen (1993).
Iron Hill, Colorado 2,424,000,000 0.40 9,696,000 Staatz and others (1979).
Lemhi Pass, Idaho 500,000 0.33 1,650 Staatz and others (1979).
Mineville, New York 9,000,000 0.9 80,000 McKeown and Klemic (1956).
Music Valley, California 50,000 8.6 4,300 Jackson and Christiansen (1993).
Pajarito, New Mexico 2,400,000 0.18 4,000 Jackson and Christiansen (1993).
Pea Ridge, Missouri 600,000 12 72,000 Grauch and others (2010).
Scrub Oaks, New Jersey 10,000,000 0.38 38,000 Klemic and other (1959).
Wet Mountains, Colorado 13,957,000 0.42 59,000 Jackson and Christiansen (1993).
Long-term prospects for the discovery of new reserves Developing Rare Earth Elements Resources
and resources depend on sufficient exploration. About 150
projects worldwide that are prospecting and exploring for rare Rare earth elements resources are distributed between
earth elements are known to the U.S. Geological Survey (U.S. many mineral deposits, but only a proportion will be economic
Geological Survey, 2010). Most of this activity began in the to develop and mine. By convention, that portion of resources
last 2 years and it will be some time before results are known. that is economic to mine is classified as a “reserve.” That a rare
Whether this exploration further diversifies REE mineral sup- earth deposit contains reserves does not mean that it will be
plies depends on discovering deposits of adequate size and developed and mined—it means only that it is economic to do
quality in the right countries. Probability of discovery requires so. Among the many rare earth reserves available, mining com-
a quantitative mineral resource assessment, which has never panies will select the most profitable to develop, potentially
been done for REE minerals in any country. The last REE leaving less profitable reserves undeveloped. Reserves may
deposit discovered and developed into a mine in the United also be undeveloped because of adverse land use restrictions,
States was the Mountain Pass mine in California, discovered in civil strife, and a host of other political and social factors.
1949 and put into production in 1953. That was more than 50 Developing a new mine requires a prolonged effort of
years ago and is not indicative of the time required to discover prospecting, exploration, process development, feasibility
and develop REE deposits in today’s regulatory climate. Dur- studies, permitting, construction, and commissioning. These
ing the past 50 years outside of China, there has been little REE efforts are broadly sequential but commonly overlap. The
exploration and almost no mine development; hence, we have time required to complete all steps is variable but appreciable,
no real REE exploration and development record to draw upon particularly compared with the time typically required by non-
for assessing the future pace of discovery and development. extractive industries. Studies of the time required to complete](https://image.slidesharecdn.com/usgs-rareearth-110110140819-phpapp01/85/USGS-The-Principal-Rare-Earth-Elements-Deposits-of-the-United-States-27-320.jpg)
![20 The Principal Rare Earth Elements Deposits of the United States
Table 11. Reserves and resources of rare earth elements outside of the United States, excluding heavy-mineral placer and phosphate
deposits.—Continued
[TREO, total rare earth elements oxides. Heavy-mineral placers are mined for rare earth elements in only a few places, such as India and Malaysia, and reserve
information is unavailable. Reserves and resources classified according to one of several national standards, such as Canadian National Instrument 43-101,
JORC, and SAMREC codes. (JORC, The Australasian Code for Reporting of Exploration Results, Mineral Resources and Ore Reserves (JORC Code, 2004
edition) (http://www.jorc.org/); SAMREC, South African Mineral Resource Committee, http://www.samcode.co.za/downloads/SAMREC2009.pdf).) Unclas-
sified resources based on little or no drilling. Reliable data on rare earth elements reserves and resources in China, North Korea, and Russia are not available.
Where reserves and resources are given for the same deposit, resources include reserves. For data on other resources in heavy-mineral placers and in phosphate
deposits, see Jackson and Christiansen (1993)]
Contained
Tonnage Grade
Deposit TREO Source
(metric tons) (percent TREO)
(metric tons)
Measured-in-pit resources
Brockman, Australia 4,290,000 0.2 8,600 Chalmers (1990).
Mount Weld, Australia 2,100,000 15.5 326,000 Lynas Corporation (2010).
Thor Lake (Lake Zone), Canada 12,010,000 1.70 204,000 Paul and Stubens (2009).
Steenkampskraal, South Africa 249,500 11.80 29,500 Great Western Minerals Group Ltd. (2009).
Measured, indicated, inferred resources
Brockman, Australia 50,000,000 0.23 115,000 Chalmers (1990).
Cummins Range, Australia 4,170,000 1.72 72,000 Navigator Resources Ltd. (2009).
Dubbo, Australia 73,200,000 0.89 651,500 Alkane Resources (2010).
Mount Weld, Australia 15,020,000 8.60 1,292,000 Lynas Corporation (2010).
Narraburra, Australia 55,000,000 0.03 16,500 Capital Mining Ltd. (2009).
Nolans Bore, Australia 30,300,000 2.80 849,000 Arafura Resources Ltd. (2010).
Hoidas Lake, Canada 2,847,000 2.00 57,000 Dunn (2009).
Strange Lake, Canada 137,639,000 0.97 1,335,000 Daigle and Maunula (2010).
Thor Lake (Lake Zone), Canada 175,930,000 1.43 2,516,000 Paul and Stubens (2009).
Thor Lake (North T), Canada 1,136,000 0.71 8,000 Palmer and Broad (2007).
Zeus (Kipawa), Canada 2,270,000 0.11 2,500 Knox and others (2009).
Greenland Minerals and Energy Ltd.
Kvanefjeld, Greenland 457,000,000 1.07 4,890,000
(2009).
Kangankunde Hill, Malawi 2,500,000 4.24 107,000 Lynas Corporation Ltd. (2007).
Unclassified resources
John Galt, Australia 382,000 7.96 30,400 Northern Uranium Ltd. (2010).
Olympic Dam, Australia >2,000,000,000 0.50 >10,000,000 Oreskes and Einaudi (1990).
Yangibana, Australia 3,500,000 1.70 59,500 Jackson and Christiansen (1993).
Araxá, Brazil 450,000,000 1.80 8,100,000 Filho and others (2005).
Catalão I, Brazil 10,000,000 0.90 90,000 Hirano and others (1990).
Pitinga, Brazil 164,000,000 0.15 246,000 Bastos Neto and Pereira (2009).
Poços de Caldas, Brazil 115,000 Wedow (1967).
Seis Lagos, Brazil 2,900,000,000 1.50 43,500,000 De Sousa (1996).
Tapira, Brazil 5,200,000 10.5 546,000 Hirano and others (1990).
Kasagwe, Burundi 67,000 1.50 1,000 Jackson and Christiansen (1993).](https://image.slidesharecdn.com/usgs-rareearth-110110140819-phpapp01/85/USGS-The-Principal-Rare-Earth-Elements-Deposits-of-the-United-States-28-320.jpg)
![Current Sources and Domestic Reserves 21
Table 11. Reserves and resources of rare earth elements outside of the United States, excluding heavy-mineral placer and phosphate
deposits.—Continued
[TREO, total rare earth elements oxides. Heavy-mineral placers are mined for rare earth elements in only a few places, such as India and Malaysia, and reserve
information is unavailable. Reserves and resources classified according to one of several national standards, such as Canadian National Instrument 43-101,
JORC, and SAMREC codes. (JORC, The Australasian Code for Reporting of Exploration Results, Mineral Resources and Ore Reserves (JORC Code, 2004
edition) (http://www.jorc.org/); SAMREC, South African Mineral Resource Committee, http://www.samcode.co.za/downloads/SAMREC2009.pdf).) Unclas-
sified resources based on little or no drilling. Reliable data on rare earth elements reserves and resources in China, North Korea, and Russia are not available.
Where reserves and resources are given for the same deposit, resources include reserves. For data on other resources in heavy-mineral placers and in phosphate
deposits, see Jackson and Christiansen (1993)]
Contained
Tonnage Grade
Deposit TREO Source
(metric tons) (percent TREO)
(metric tons)
Oka, Canada 210,000,000 0.127 267,000 Orris and Grauch (2002).
Mrima Hill, Kenya 6,000,000 16.2 972,000 Pell (1996).
Ak-Tyuz, Kyrgyzstan 15,000,000 1.00 150,000 Malyukova and others (2005).
Karajilga, Kyrgyzstan 957,000 0.70 6,700 Bogdetsky and others (2001).
Kutessai II, Kyrgyzstan 20,228,000 0.22-0.3 <60,000 Stans Energy Corp. (2010).
Sarysai, Kyrgyzstan 7,000,000 0.20 14,000 Bogdetsky and others (2001).
Pilanesberg, South Africa 13,500,000 0.70 94,500 Lurie (1986).
Zandkopsdrift, South Africa 31,500,000 3.60 1,130,000 Frontier Minerals (2009).
Kizilcaören, Turkey 4,695,000 2.78 130,500 Morteani and Satir (1989).
Dong Pao, Vietnam 500,000,000 1.40 7,000,000 Kušnir (2000).
Mau Xe North, Vietnam 557,000,000 1.40 7,800,000 Kušnir (2000).
this process typically examine the interval between recognition The time to develop a mine in each category is likely to
of a potentially economic deposit and the commencement of take longer today than it did when Peters (1966) did his study.
commercial production. Peters (1966) examined the develop- Most modern mines are developed under a comprehensive
ment history of a large number of mines and divided them into regulatory environment where, in the United States at least,
four classes. The first class requires a preproduction period of 2 environmental studies, due diligence studies by financing
years or less. This class of mine is characterized by simple ores sources, permitting, public participation, and due process
of high unit value, the applicability of conventional mining require substantial amounts of time. Further delays may be
and mineral processing methods, the absence of need for much caused by public controversy and litigation against a proposed
additional transportation or power infrastructure, an assured mine. These delays are illustrated in table 12, which tallies the
market, and the requirement for only short-term financing. A time it took to develop metal mines that opened in the United
modern example in this class would be a small- to medium- States since 2000. The time to obtain a permit has required as
sized open pit-heap leach gold deposit in Nevada. Gold has a many as 17 years, and one mine, the Pogo, Alaska gold mine,
high unit value and ready market. The pertinent mining and was developed under an expedited permitting schedule that still
mineral processing technology is also simple and well-known, took 7 years. For a small gold mine in Nevada, once permits
with excellent local infrastructure, and regulatory authorities were obtained, the time to construct and put a mine into opera-
have much experience with this type of mining. tion took 1 month. For the Kensington, Alaska, gold mine,
The other three categories are characterized by increas- however, whose operating permits were contested in the courts,
ing complexity of ores, size of operations, infrastructure and the process lasted 63 months. Ramp-up times for new mines
financing needs, and lower unit values. The last category has took from 2 to 12 months; the longest was for Pogo, Alaska,
a preproduction period of 7 years or more. A modern example which had unexpected metallurgical difficulties.
would be a nickel laterite mine, the metallurgy of which is
quite troublesome; many such nickel mines have required in Developing a Rare Earth Elements Mine
excess of 10 years of process development plus delays because
of market timing. Developing a new nickel laterite mine is The first step in developing a new REE mine is to locate
best timed to open during a period of high nickel prices. A new a suitable REE deposit. Exploration for new deposits may
REE mine would almost certainly fall into this last category be in either of two contexts: greenfield exploration to find
for many of the same reasons—complex metallurgy and new deposits in areas not previously mined and brownfield
restricted opportunities for market entry. exploration in and adjacent to current and past mining activity.](https://image.slidesharecdn.com/usgs-rareearth-110110140819-phpapp01/85/USGS-The-Principal-Rare-Earth-Elements-Deposits-of-the-United-States-29-320.jpg)
![22 The Principal Rare Earth Elements Deposits of the United States
Table 12. Time required to obtain permits, construct, and commission recently opened metal mines in the United States.
[NYA, not yet achieved, production not yet begun or commercial operations not achieved; PGE, platinum group elements. Yes, long permitting and development
delays because of litigation by government agencies and nongovernmental organizations]
Commercial
Permitting Permitting Production Litigation
Mine Commodity operations
began completed began reported
began
Alta Mesa, Texas U 1999 2004 10/2005 1/2006
Arizona 1, Arizona U mid-2007 2009 NYA NYA Yes.
Ashdown, Nevada Mo Au 2/2004 11/2006 12/2006 NYA
Buckhorn, Washington Au 1992 9/2006 10/2008 11/2008 Yes.
Carlota, Arizona Cu 2/1992 6/2007 12/2008 1/2009 Yes.
Eagle, Michigan Ni Cu Co PGE 4/2004 1/2010 NYA NYA Yes.
East Boulder, Montana PGE 1995 1998 6/2001 1/2002
Kensington, Alaska Au 3/1988 6/2005 9/2010 NYA Yes.
Leeville, Nevada Au 7/1997 8/2002 10/2006 4th quarter 2006
Lisbon Valley, Utah Cu 2/1996 7/2004 1st quarter 2006 NYA Yes.
Pend Oreille, Washington Zn 1992 9/2000 1/2004 8/2004
Phoenix, Nevada Au 1/1999 1/2004 10/2006 4th quarter 2006
Pogo, Alaska Au 12/1997 4/2004 2/2006 4/2007
Rock Creek, Alaska Au 2003 8/2006 9/2008 NYA Yes.
Rossi (Storm), Nevada Au 1990 3Q/2006 3/2007 12/2007
Safford, Arizona Cu 4/1998 7/2006 4th quarter 2007 2nd half 2008 Yes.
Turquoise Ridge, Nevada Au 9/1995 5/2003 2004 NYA
Greenfield exploration may target frontier areas with no previ- In the case of REE, very little exploration has ever been
ous exploration or may follow up on past exploration results. done and the most intense period ever of direct exploration
Brownfield exploration includes searching for extensions to for REE is currently underway (2010). Many important past
known reserves and resources within or near a mine as well as discoveries have been serendipitous—the world’s largest REE
new deposits in the vicinity of existing operations. The latter mine, Bayan Obo in China, was first mined for iron ore. The
may extend the life of an existing mine or result in the com- “funny” steel produced from this ore was investigated and
plete redevelopment of a former mine. found to be contaminated with REE (Laznicka, 2006). Moun-
Exploration is an uncertain process conducted with tain Pass, California, was found in the course of a U.S. Geolog-
limited capital. An explorer’s objective is to find a deposit ical Survey radioactivity reconnaissance project that expected
of the targeted type, size, and quality with the least amount to find uranium. Many REE-bearing carbonatite deposits were
of expense. Thus, any particular location of merit is rarely initially explored as a source of niobium or phosphates.
exhaustively explored. Exploration will proceed on the basis The discovery of a REE deposit must be proved by exten-
of favorable indicators so long as objectives are met within sive trenching, drilling, and sampling. Drilling will initially
budget. An exploration project will be curtailed if evidence be on a widely spaced grid to evaluate the extent and richness
is found that contraindicates the prospectivity of the target or of mineralization. If results are favorable, the deposit will be
if results are insufficient to justify further work. Exploration drilled on progressively narrower spacing until a measured
commonly runs in cycles, prompted by short- to medium-term resource of adequate size is established. Concurrently, baseline
increases in mineral prices. The low side of a price cycle may environmental studies will be completed and bulk samples
prompt little or no exploration activity. Any particular prospect obtained for metallurgical testing. A conceptual mine plan
may undergo many episodes of exploration by different parties and metallurgical plan will be engineered and a preliminary
during many decades; the exploration episodes are motivated economic feasibility study undertaken. If the results of these
by price cycles, new cost-saving technology, improved explora- studies are favorable, further work will develop an optimized
tion concepts and methods, and the vagaries of land access and mine plan, validate metallurgical processing on a pilot plant
exploration management. scale, begin application for permits, and conduct a definitive](https://image.slidesharecdn.com/usgs-rareearth-110110140819-phpapp01/85/USGS-The-Principal-Rare-Earth-Elements-Deposits-of-the-United-States-30-320.jpg)
![24 The Principal Rare Earth Elements Deposits of the United States
Table 13. Time required to develop selected mines outside of the United States.
[These mines selected as close analogs of the mining and metallurgical methods required by a rare earth elements mine. NYA, commercial production
not yet achieved]
Commercial
Discovery Permitting Production
Mine Country Commodity operations
date completed began
began
Ambatovy Madagascar Ni Co 1960 3/2007 Late 2010 NYA
Araxa Brazil Nb 1955 1960 1st quarter 1961 1966
Barco Alto Brazil Ni 1981 12/2006 3/2010 2011
Bulong Australia Ni 1971 9/1996 3/1999 9/1999
Catalão I Brazil Nb 1970 1974 1976 1977
Cawse Australia Ni Co 1994 9/1996 1/1999 6/2000
Goro New Caledonia Ni Co 1982 10/2004 Late 2010 NYA
Murrin Murrin Australia Ni Co 1984 5/1996 5/1999 12/2003
Niobec Canada Nb 6/1967 11/1973 1/1976 3/1976
Onça Puma Brazil Ni 1970s 8/2005 3rd quarter 2010 Early 2011
Raventhorpe Australia Ni Co Late 1960s 3/2004 10/2007 NYA
Urumu Utsumi Brazil U 1971 1975 7/1981 1982
Vermelho Brazil Ni 1966 7/2005 4th quarter 2012 NYA
References Cited Capital Mining Ltd., 2009, Annual Report 2009 (Year ended
June 30): Philip, Australian Capital Territory, Capital Mining
Ltd., 68 p. www.capitalmining.com.au/Annual%20Reports/
Alkane Resources Ltd., 2010, The Dubbo zirconia project: CMY_101_AnnualReport2009.pdf, accessed July 15, 2010.
Perth, Western Australia, Alkane Resources Ltd., 6 p.
www.alkane.com.au/projects/nsw/dubbo/DZP-Summary- Chalmers, D.I., 1990, Brockman multi-metal and rare-earth
March-10.pdf, accessed July 15, 2010. deposit, in Hughes, F.E., ed., Geology of the mineral deposits
of Australia and Papua New Guinea: Australasian Institute of
Arafura Resources Ltd., 2010, Annual Operations Report 2009 Mining and Metallurgy Monograph 14, v. 1, p. 707–709.
(Year ended June 30): Perth, Western Australia, Arafura
Resources Ltd., 32 p. www.arafuraresources.com.au/ Daigle, P., and Maunula, T., 2010, Strange Lake Project B
documents/ARU2009OperationsReportFINAL.pdf, accessed Zone Deposit, Québec, National Instrument 43-101 resource
July 15, 2010 estimate for Quest Uranium Corporation: Toronto, Ontario,
Wardrop, 188 p.
Bastos Neto, A.C., and Pereira, V.P., 2009, The world-
class Sn, Nb, Ta, F (Y, REE, Li) deposit and the massive De Sousa, M.M., 1996, The niobium deposit in Morro dos
cryolite associated with the albite-enriched facies of the Seis Lagos, North-Brazil: International Geological Congress
Madeira A-type granite, Pitinga mining district, Amazo- Abstracts, v. 30, no. 2, p. 784.
nas State, Brazil: The Canadian Mineralogist, v. 47, p.
1329–1357. Dunn, B., 2009, Form 43-101 mineral resource report on the
Hoidas Lake rare earth project, Northern Mining district,
Behre Dolbear, 2010, 2010 ranking of countries for mining Saskatchewan: Prepared for Great Western Minerals Group
investment: Downloaded July 13, 2010 at www.dolbear. Ltd., Minneapolis, Minnesota, Barr, 730 p.
com/Publications/CountryRankings.pdf.
Filho, A.I., Riffel, B.F., and de Faria Sousa, C.A., 2005, Some
Bogdetsky, V., Stavinskiy, V., Shukurov, E., and Suyunbaev, aspects of the mineralogy of CBMM niobium deposit and
M., 2001, Mining industry and sustainable development mining and pyrochlore ore processing, Araxá, MG, Brazil:
in Kyrgyzstan: International Institute for Environment and Araxá, Brazil, Companhia Brasileira de Metalurgia e Min-
Development, 95 p. eração, 12 p.](https://image.slidesharecdn.com/usgs-rareearth-110110140819-phpapp01/85/USGS-The-Principal-Rare-Earth-Elements-Deposits-of-the-United-States-32-320.jpg)
![30 The Principal Rare Earth Elements Deposits of the United States
Table 14. Uranium production from the Ross-Adams mine, Alaska.
[Source: Warner and Barker, 1989. Stephens (1971) reported 83,000 tons of uranium ore at about 1% U3O8. Kent and Sullivan (2004) reported
90,700 tons of ore of unknown grade. Cathrall (1994) reported 209,400 tons of 1 percent U3O8, making the total U3O8 produced 4.2 million pounds.
lb, pound]
Year Mining company Amount mined (tons) U3O8 produced (lb) Grade (percent U3O8)
1957 Climax Molybdenum Corp. 15,000 315,000 1.05
1959–1964 Standard Metals Corp. 15,000 300,000 1.0
1970–1971 Newmont Exploration, Ltd. 55,600 687,000 0.62
Total 85,600 1,302,000
Weighted average 0.76
company began an intensive new exploration program in 2007 On the whole, ore mineralization is confined to microfractures
that continued to the present throughout an area of about 20 in the dikes or the interstices between larger silicate grains
mi2 that includes the Ross-Adams mine property (http://www. (Warner and Barker, 1989). For example, the I & L vein sys-
ucoreraremetals.com/bokan.asp). Preliminary reports based on tem strikes west-northwest (table 15) and is located within the
these new data suggest an inverse relationship between U and peralkaline granite stock on the east side of Bokan Mountain
REE; U is located near the margin of the granite complex and (MacKevett, 1963; Warner and Barker, 1989). The system
more abundant REE more distant from the intrusive complex. measures 2.6 km (1.6 mi) long and is composed of many thin,
However, ore having a high percentage of U is generally also subparallel veins that individually rarely exceed 1.5 m (5 ft)
enriched in REE—especially the heavy rare earth elements in width (Staatz, 1978; Warner and Barker, 1989). Of the
(HREE), Y, Zr, Be, and Nb. For example, Ucore Rare Metals two main splays in the I & L vein system, the western splay
reports finding about 6 m of core having a grade of 0.26 per- (closest to the Bokan Mountain granite) is hosted by limonite-
cent light rare earth elements (LREE) and 3.6 percent HREE stained peralkaline granite and pegmatite (Warner and Barker,
in the orebody’s I & L vein system. 1989). The Dotson dike system terminates in the northwest
Rare earth elements–bearing uraniferous orebodies also at a right-lateral offset to the I & L vein system and extends
lie in the northwest-striking shear zones within the stock about 2 km (1.2 mi) to the southeast; this system of veins has
granite, where they measure as thick as 3 m (3.3 ft) and as a width around 1 km (0.6 mi) (Staatz, 1978; Philpotts and
long as 30 m (98 ft) along strike (Thompson, 1988). The others, 1998). The Dotson dike system likely extends south-
main uranium minerals include uranothorite and coffinite in eastward beneath the West Arm of Kendrick Bay (Warner and
a gangue of quartz and feldspar (Warner and Barker, 1989; Barker, 1989). The Geiger dike extends northerly from near
Heylmun, 1999). Typically, uranothorite is the dominant an aplite outlier of the peralkaline granite to the north shore of
ore mineral; it forms yellowish to brownish ovoids that are South Arm Moira Sound; it is a continuous dike system of one
0.2 to 2 mm in diameter (Thompson, 1988). Hematite may to five or more parallel, radioactive dikes (Warner and Barker,
be found as rims on uranothorite grains or in fine veinlets 1989). The Cheri dike system consists of steeply dipping,
that extend along microfractures between ovoids. Less than subparallel, radioactive dikes that cut albitized quartz diorite
2 percent of the ore also consists of sulfide species such as country rock (Warner and Barker, 1989). In some places,
pyrrhotite, pyrite, chalcopyrite, galena, sphalerite, marca- pyroxene-rich masses appear within the dikes whereas magne-
site, acanthite, and bornite (Thompson, 1988). Within and tite, pyrite, and epidote appear along the edges. Rare fluorite
adjacent to the orebodies, pervasive hydrothermal albite and and secondary uranium have also been identified within all of
minor amounts of chlorite, fluorite, calcite, quartz, seric- these “vein-dike” systems (Warner and Barker, 1989).
ite, and tourmaline precipitated during wall-rock alteration The Upper Cheri dikes are subparallel to and southwest
(Thompson, 1988). of the Cheri dikes. On the whole, the dikes are very similar to
In addition to the mineralized shear zones, U- and REE- those of the Cheri dike system, with comparable mineralogy,
mineralized veins and dikes extend out from Bokan Mountain structure, setting, radioactivity, and intrusive characteristics
all the way to the West Arm of Kendrick Bay. Most of the (Warner and Barker, 1989). The Geoduck dikes can be traced
veins and dikes are parallel to subparallel (table 15) and crop southeasterly along a strike of N. 40°–50° W. for about 2.9
out on the southeast side of Bokan Mountain, although an km (1.8 mi) (Warner and Barker, 1989) (table 15). Texturally,
exception is the Geiger dike, which is located on the northwest the dikes are fine to medium grained and granular and banded
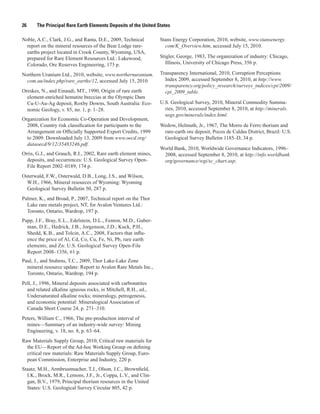
side of the mountain (fig. 5). Overall, the veins and dikes tend or cut by veinlets of quartz or opaque minerals. In addition,
to bifurcate and anastomose, especially away from the granite the Geoduck dike system has, for most of its strike length,
stock, which makes them appear more like members of a sys- chlorite- and epidote-altered pyritic quartz diorite wall rocks
tem rather than individual bodies (Philpotts and others, 1998). (Warner and Barker, 1989).](https://image.slidesharecdn.com/usgs-rareearth-110110140819-phpapp01/85/USGS-The-Principal-Rare-Earth-Elements-Deposits-of-the-United-States-38-320.jpg)
![Alaska—Bokan Mountain 31
The veins and dikes are of importance because they con- xenotime, and monazite. Thorium and uranium are present
tain anomalously high amounts of Be, Nb, REE, Ta, and Hf- in thorite and uranothorite. Other minerals identified in the
rich zirconium (table 16). From 1984 to 1987, the U.S. Bureau dikes include aegirine, barite, biotite, calcite, epidote, fluorite,
of Mines investigated several prospects on Bokan Mountain galena, iron oxides, magnetite, microcline, microperthite,
and in the surrounding area, including the mineralized dikes. native silver, pyrite, riebeckite, sphalerite, and zircon. Phil-
Collectively, the dikes indicate a resource of 6.8 million tons potts and others (1998) examined a 3-km (1.9 mi) transect
of ore that average 0.264 percent REE oxides, about one-third from the margin of the Bokan Mountain peralkaline granite
yttrium (Warner and Barker, 1989). In addition, the dikes are stock along a micro-pegmatite and aplite vein-dike system
extensively enriched in yttrium and heavy rare earth elements enriched in Y-REE-Zr-Nb, and they identified minerals such
(HREE) relative to the light rare earths (LREE); yttrium is as arfvedsonite, taeniolite, and gittinsite, as well as several
present at 1,000 times its normal crustal abundance. This com- other REE-, Zr-, and Nb-bearing phases. By use of various
position contrasts with REE deposits elsewhere in the United analytical methods, the examined transect was found to be
States and is important because most of the HREE and yttrium generally enriched in Y and HREE and to have a pronounced
in the United States is imported (Warner and Barker, 1989). negative Eu anomaly, which largely agrees with the results
The most abundant REE are, in order of generally decreasing obtained by Warner and Barker (1989) for several dike sys-
abundance, Y, Ce, Nd, La, and Sm. Gadolinium, Dy, Ho, Er, tems in the Bokan Mountain area.
and Tm are also present in variable and sometimes noteworthy Similar to the mineralogy of the dike systems, the
concentrations (Warner and Barker, 1989). On average, the mineralogy of the I & L vein system is complex. In particu-
dikes also contain 0.727 percent zirconium oxide and 0.155 lar, U, Th, and REE are present in several different minerals
percent niobium oxide, while the amount of thorium and from different parts of the veins, and they are usually in a
uranium in the dikes is negligible. Trace to minor amounts of gangue dominated by quartz and albite (Staatz, 1978; Keyser
other valuable elements are also present, including Be, Ga, Ge, and McKenney, 2007). Generally, U is located in Th-bearing
Au, Hf, Pb, Li, Pd, Rb, Ag, Sr, Ta, Sn, V, and Zn. uraninite, although it can be found in brannerite in some of the
The minerals of the euxenite-polycrase series host most transverse veins (Staatz, 1978). Secondary U minerals, such
of the Nb found in the dikes, though minor amounts are as kasolite and sklodowskite, have been identified, but they
also contained in columbite (now called ferrocolumbite), are rare (Keyser and McKenney, 2007). In the northwest part
aeschynite, and fergusonite (Warner and Barker, 1989). of the vein system, thorite is the main thorium mineral, while
Thalenite, or its alteration product tengerite, contains the allanite is found in the southeastern part of the system as well
observed Y as well as inclusions of xenotime. Other REE are as in the transverse veins. Other rare earth minerals besides
contained within the minerals bastnasite, parisite, synchysite, allanite include bastnasite, xenotime, and monazite. However,
Table 15. Dimensions of main orebodies in the Bokan Mountain district, Alaska.
[m, meter; --, not available]
Average Estimated
Length
Prospect Deposit type Trend width depth Source
(m)
(m) (m)
Shear zone, Warner and
Dotson shear zone -- -- 3.0 --
fracture controlled Barker (1989).
Shear zone, Thompson
Ross-Adams pipe N-NW 300 24 --
fracture controlled (1988).
Warner and
Cheri Dike N. 45° W. 1,097 0.9 264
Barker (1989).
Warner and
Upper Cheri Dike -- 366 1 --
Barker (1989).
Warner and
Dotson Dike -- 2,134 0.9 762
Barker (1989).
N. 15° E. to Warner and
Geiger Dike 1,707 1.5 762
N. 30° W. Barker (1989).
N. 40° W. to Warner and
Geoduck Dike 2,896 0.5 762
N. 50° W. Barker (1989.
I & L vein system Dike NW 2,600 ≤1.5 -- Staatz (1978).](https://image.slidesharecdn.com/usgs-rareearth-110110140819-phpapp01/85/USGS-The-Principal-Rare-Earth-Elements-Deposits-of-the-United-States-39-320.jpg)
![32 The Principal Rare Earth Elements Deposits of the United States
Lake
N
Arm
Pe
rki
ns
Geig
uth
Cr
ee
k
So
er
Bokan
Mountain
Lake
Ross
I&L
Adams Dot
X son
Dotson C
reek
We
s tA
U
Ge rm
pp
Ch od
er
er uc
i Kendrick
C
k
he
Lake Bay
ri
0 2 MILES
eri
Ch
Figure 5. Map of major vein and dike systems associated with Bokan Mountain, Alaska. Modified from
Heylmun (1999).
the distribution of the REE oxides is unusual in that one part Many of the dikes in the Bokan Mountain area crop out
of a vein may contain mostly LREE (for example, bastnasite) in heavily forested areas and thus the bedrock is covered by
whereas another part of the same vein has predominantly thick vegetation (Warner and Barker, 1989). For instance, the
HREE (for example, xenotime) (Staatz, 1978). Upper Cheri dike system can be traced only intermittently
In addition, the I & L vein system contains anomalous because of muskeg cover, glacial till, or obscuration by
amounts of Be, Nb, Zr, Ba, Sr, Sn, Pb, Zn, Cu, and Mo (table hillside talus where it is open-ended. On the northwest end
16). Most of the Nb-rich minerals are located in euxenite- of the Upper Cheri, the dike system passes under a low-lying
polycrase or columbite-tantalite series. (Columbite and tanta- creek valley (Warner and Barker, 1989). Heavy soil cover
lite are obsolete names for a mineral series; columbite is now also prohibits detailed mapping in the I & L vein system. In
named ferrocolumbite (Fe2+Nb2O6), which forms two minerals addition, accessibility to the area is limited given that the
series, one with ferrotantalite (Fe2+Ta2O6) and the other with topography of the Bokan Mountain area ranges from mod-
manganocolumbite [(Mn2+,Fe2+)(Nb,Ta)2O6)]. erately steep to precipitous (Keyser and McKenney, 2007).
Commonly, these minerals are associated with zircon as Although deep-water marine access is available to and from
microveinlets. Alternatively, these minerals may replace albite Ketchikan and Prince Rupert by way of Kendrick Bay and
and quartz in the vein matrix. Other minerals include aegirine, Moira Sound, accessing more remote sections of the area
barite, biotite, calcite, epidote, fluorite, galena, iron oxides, must be achieved by helicopter, boat, or on foot. In spite of
potassium feldspar, magnetite, pyrite, riebeckite, native silver, these limitations, the mineralization could have considerable
and sphalerite (Staatz, 1978). economic potential.](https://image.slidesharecdn.com/usgs-rareearth-110110140819-phpapp01/85/USGS-The-Principal-Rare-Earth-Elements-Deposits-of-the-United-States-40-320.jpg)
![Table 16. Resource estimates for main prospects on Bokan Mountain, Alaska, and surrounding property.
[%, percent; --, not available. Source of data: Warner and Barker (1989) and Keyser and McKenney (2007)]
Resource U3O8 Nb2O5 ThO2 Y2O3 ZrO2 REO BeO Ta2O5
Prospect
(tons) (percent) (percent) (percent) (percent) (percent) (percent) (percent) (percent)
Indicated Inferred
1
Cheri -- 73,000 0.012 0.089 0.025 0.095 0.320 0.281 0.025 0.01
Cheri1 -- 458,000 0.020 0.175 0.042 0.222 0.650 0.461 0.03 0.01
1
Cheri 4,443,000 -- 0.014 0.123 0.032 0.180 0.410 0.352 0.025 0.01
Upper Cheri 481,000 -- 0.014 0.099 0.025 0.159 0.460 0.411 -- --
Dotson shear zone -- 2,039,000 0.009 0.083 0.071 0.113 0.009 0.132 -- --
Dotson dike1 8,490,000 -- 0.011 0.103 0.052 0.138 0.260 0.21 0.16 0.026
Geiger1 -- 2,450,000 0.021 0.219 0.009 0.168 2.430 0.458 -- 0.014
1
Geiger 4,693,000 -- 0.021 0.219 0.168 2.430 0.458 -- 0.014
1
Geiger 2,600,000 -- 0.008 0.062 0.009 0.163 1.000 0.149 -- --
Geoduck1 -- 1,378,000 0.015 0.148 0.031 0.374 0.640 0.375 0.028 --
Geoduck1 9,528,000 -- 0.012 0.112 0.021 0.200 0.390 0.319 0.028 --
I&L -- 21,000 0.094 0.186 0.114 -- 0.094 -- -- --
I&L -- 23,000 -- 0.096 -- -- -- -- -- --
I&L -- 50,000 -- 0.100 -- -- -- -- -- --
I&L -- 6,000 -- 0.300 -- -- -- -- -- --
I&L 37,000 -- -- 0.100 -- -- -- -- -- --
I&L 5,000 -- -- 0.300 -- -- -- -- -- --
ILM 586,000 -- 0.017 0.176 -- 0.083 3.340 0.353 -- --
Ross-Adams mine -- 365,000 0.17 -- 0.460 0.400 0.320 0.32 -- --
Sunday Lake 27,000 -- 0.59 0.070 3.640 1.030 0.380 0.329 -- --
Total 30,890,000 6,863,000
1
Trace percentages of Ge, Hf, Pb, Zn, and Au also present.
Alaska—Bokan Mountain
33](https://image.slidesharecdn.com/usgs-rareearth-110110140819-phpapp01/85/USGS-The-Principal-Rare-Earth-Elements-Deposits-of-the-United-States-41-320.jpg)
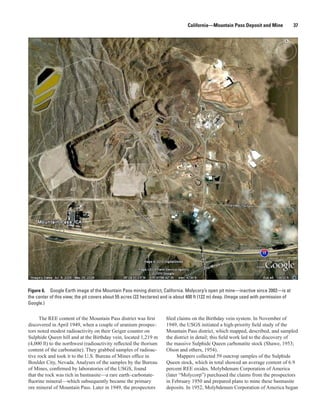
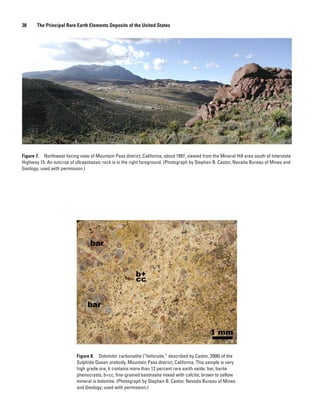
![36 The Principal Rare Earth Elements Deposits of the United States
the largest known mass of high-grade REE ore in the United
California—Mountain Pass Deposit States. Light REE are preferentially concentrated in the Moun-
and Mine tain Pass ore (Castor, 2008).
Molycorp ceased its mining of the Mountain Pass REE
Location: Northeastern corner of San Bernardino County, deposit in 2002 when its permit expired. However, in 2009,
California. Latitude: 35.47812 N., Longitude: 115.53068 Molycorp announced its intentions to resume mining at Moun-
W.; datum: WGS84 tain Pass by the year 2012. The mine’s open pit—inactive
since 2002—covers about 22 hectares (55 acres ) of area
Deposit type and basic geology: A massive carbonatite called and is about 122 m (400 ft ) deep. In July 2009, Molycorp
the Sulphide Queen body forms the core of the Mountain reached agreement with Arnold Magnetic Technologies Corp.
Pass igneous complex and hosts the bulk of the rare earth of Rochester, New York, to make permanent magnets using
elements resources in the district. This carbonatite body REE mined at Mountain Pass (Mining Engineering, 2009).
has an overall length of 730 m (2,395 ft) and average Molycorp announced that “Plans call for mining to resume
width of 120 m (394 ft). The typical ore contains about at Mountain Pass by 2012, at the rate of about 972 t/d [972
10–15 percent bastnasite (the ore mineral), 65 percent metric tons per day; 1,000 tons per day] of ore, enough to
calcite or dolomite (or both), and 20–25 percent barite, produce 20 kt [20,000 metric tons; 22,000 tons] of rare earth
plus other minor accessory minerals (Castor and Nason, oxides for sale each year” (Mining Engineering, 2009, p. 8); it
2004). The Sulphide Queen carbonatite body is the largest has received approval to double its output volume with time.
known mass of high-grade rare earth elements ore in the The mine’s peak output 20 years ago was 20,000 metric tons
United States. per year of rare earth oxides (Mining Engineering, 2009).
Status: Molycorp ceased its mining of the Mountain Pass rare Molycorp estimates that the remaining deposit holds 20 to
earth elements deposit in 2002 when its permit expired. In 47 million metric tons (22 to 52 million tons) of ore (Mining
2009, Molycorp announced its intentions to resume min- Engineering, 2009).
ing at Mountain Pass by the year 2012. The Sulphide Queen carbonatite stock and nearby car-
bonatite dikes are associated with Proterozoic, potassium-rich
Production: Rare earth elements were mined in the district igneous rocks—biotite shonkinite, hornblende and biotite
beginning in 1952, with nearly continuous production syenite, and granite—that intruded Precambrian metamorphic
until 2002. The mine’s peak output, around 1990, was and igneous rocks (Olson and others, 1954; Castor, 2008). The
20,000 metric tons/year (22,000 tons/year) of rare earth
Sulphide Queen body was originally mapped as three rock
elements oxides.
types with local variations—gray calcite-barite rock (fig. 8),
Estimated resources: Molycorp estimates that the remaining
ferruginous dolomitic rock, and silicified carbonate rock
deposit holds 20 to 47 million metric tons (22 to 52 mil-
(Olson and others, 1954). All phases of the stock contain bast-
lion tons) of ore with an estimated average grade of 8.9
nasite. Age determinations indicate that the Sulphide Queen
percent rare earth elements oxide.
carbonatite was emplaced 1375±5 million years ago (DeWitt
and others, 1987), about 25–35 million years after the alkaline
Detailed Discussion igneous intrusions in the district (Castor, 2008).
In addition to the massive Sulphide Queen carbonatite
The Mountain Pass deposit sits near the eastern edge of stock, several carbonatite dikes are exposed in the Mountain
the Mohave Desert in the northeastern corner of San Ber- Pass district. These dikes include the Birthday veins north
nardino County, California. It lies just north of Interstate High- and northwest of the Sulphide Queen mass and other car-
way 15 near Mountain Pass, about 60 mi (96 km) southwest of bonatite dikes southeast of the stock. The Sulphide Queen
Las Vegas, Nevada (figs. 6 and 7). stock and the carbonatite dikes are exposed across an area
The Mountain Pass deposit is commonly recognized as of less than 1 mi2 in the district. The carbonatite dikes range
the largest known rare earth elements (REE) resource in the from a few inches to about 6 m (20 ft) in thickness and
United States, with current reserves estimated to be greater can be exposed for as much as 122 m (400 ft) along strike
than 20 million metric tons of ore with an average grade of 8.9 (Olson and others, 1954). Like the Sulphide Queen stock,
percent rare earth elements oxide (Castor and Hedrick, 2006). the carbonatite dikes are abundant in calcite (as much as 90
A massive carbonatite called the Sulphide Queen body forms percent of the dike) and barite (as much as 30 percent); but
the core of the Mountain Pass igneous complex and hosts the in contrast to the stock, individual dikes may or may not con-
bulk of the REE mineral resources in the district. This car- tain bastnasite. Accessory minerals include siderite, quartz,
bonatite body has an overall length of 730 m (2,395 ft) and fluorite, galena, pyrite, apatite, crocidolite, wulfenite, biotite,
average width of 120 m (394 ft) (Olson and others, 1954). The thorite, hematite, magnetite, goethite, and potassium feldspar
typical ore contains about 10–15 percent bastnasite (the ore (Olson and others, 1954; Castor and Nason, 2004; Cas-
mineral), 65 percent calcite or dolomite (or both), and 20–25 tor, 2008). The carbonatite dikes range in total REE oxide
percent barite, plus other minor accessory minerals (Castor content from 2.03 to 18.64 percent (Olson and others, 1954;
and Nason, 2004). The Sulphide Queen carbonatite body is Staatz and others, 1980).](https://image.slidesharecdn.com/usgs-rareearth-110110140819-phpapp01/85/USGS-The-Principal-Rare-Earth-Elements-Deposits-of-the-United-States-44-320.jpg)
![California—Mountain Pass Deposit and Mine 39
mining of the surface outcrops and built small processing
facilities in the district. The early prospecting and discovery
history of the Mountain Pass district is thoroughly described
by D.F. Hewett, as the foreword to Olson and others (1954).
Although the report is more than half a century old and
was written prior to large-scale mining in the district, the USGS
report of Olson and others (1954) remains the most compre-
hensive published report on the geology of the Mountain Pass
district. The geologic mapping, lithologic descriptions, and
mineralogy described in the report have been proven through
the several decades of development to be an accurate geologic
accounting of the district. The results of more recent geologic
and geochemical research in the district, which includes sub-
surface information, are detailed by Castor (2008).
References Cited
Castor, S.B., 2008, The Mountain Pass rare-earth carbonatite
and associated ultrapotassic rocks, California: The Canadian
Mineralogist, v. 46, no. 4, p. 779–806.
Castor, S.B., and Hedrick, J.B., 2006, Rare earth elements, in
Kogel, J.E., Trivedi, N.C., Barker, J.M., and Krukowski,
S.T., eds., Industrial minerals & rocks—Commodities, mar-
kets, and uses (7th ed.): Littleton, Colo., Society for Mining,
Metallurgy, and Exploration, Inc. (SME), p. 769–792.
Castor, S.B., and Nason, G.W., 2004, Mountain Pass rare earth
deposit, California, in Castor, S.B., Papke, K.G., and Meeu-
wig, R.O., eds., Betting on industrial minerals—Proceed-
ings of the 39th Forum on the Geology of Industrial Miner-
als, Reno/Sparks, Nev., May 18–24, 2003: Nevada Bureau
of Mines and Geology Special Publication 33, p. 68–81.
DeWitt, Ed, Kwak, L.M., and Zartman, R.E., 1987, U-Th-Pb
and 40Ar/39Ar dating of the Mountain Pass carbonatite and
alkalic igneous rocks, S.E. Cal. [abs.]: Geological Society
of America Abstracts with Programs, v. 19, no. 7, p. 642.
Mining Engineering, 2009, Rare earths mine to come back on
line to fuel green cars: Mining Engineering, v. 61, no. 10,
[October 2009], p. 8.
Olson, J.C., Shawe, D.R., Pray, L.C., and Sharp, W.N., 1954,
Rare-earth mineral deposits of the Mountain Pass district,
San Bernardino County, California: U.S. Geological Survey
Professional Paper 261, 75 p.
Shawe, D.R., 1953, Thorium resources of the Mountain Pass
district, San Bernardino County, California: U.S. Geologi-
cal Survey Trace Elements Investigations Report 251,
73 p., 4 plates.
Staatz, M.H., Hall, R.B., Macke, D.L., Armbrustmacher, T.J.,
and Brownfield, I.K., 1980, Thorium resources of selected
regions in the United States: U.S. Geological Survey
Circular 824, 32 p.](https://image.slidesharecdn.com/usgs-rareearth-110110140819-phpapp01/85/USGS-The-Principal-Rare-Earth-Elements-Deposits-of-the-United-States-47-320.jpg)
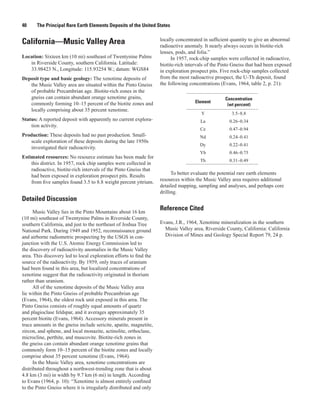
![Colorado—Iron Hill Carbonatite Complex 41
carbonatite-alkalic rock association in the United States and is
Colorado—Iron Hill Carbonatite one of the outstanding occurrences in the world, comparable to
Complex many of the classic areas in Africa and other continents.” The
primary rock types of the complex are, from oldest to young-
Location: Located near the small town of Powderhorn, about est, pyroxenite, uncompahgrite, ijolite, nepheline syenite, and
35 km (22 mi) south-southwest of Gunnison, Colorado. carbonatite (Olson, 1974; Hedlund and Olson, 1975; Olson
Latitude: 38.25319 N., Longitude: 107.05328 W.; datum: and Hedlund, 1981; Armbrustmacher, 1983). Substantial
WGS84 titanium concentrations have been measured in the pyroxenite
unit, which is thought to host the largest titanium (Ti) resource
Deposit type and basic geology: A massive carbonatite
in the United States (Thompson, 1987; Shaver and Lunceford,
stock forms the core of the Iron Hill carbonatite complex.
1998; Van Gosen and Lowers, 2007). The carbonatite stock
The carbonatite stock is enriched in rare earth elements,
is enriched in rare earth elements (REE), niobium (Nb), and
niobium, and thorium; the adjacent pyroxenite unit is
thorium (Th); the pyroxenite unit is also enriched in these ele-
enriched in these elements also and in substantial amounts
ments plus vanadium (V). Thus, it may be economic to extract
of titanium.
several resources from this complex with a well-coordinated
Status: Since 1990, Teck Resources Ltd. has owned many mine and mill plan. Thus far, none of these resources has been
of the patented claims within this intrusive complex. Its developed at Iron Hill.
interests have focused on the substantial titanium resource A dolomitic carbonatite stock was the last major igne-
within the pyroxenite unit of the complex. Currently ous phase of the Iron Hill intrusive complex. The stock
(2010), it appears that Teck Resources is not actively forms Iron Hill (fig. 9) and the ridge to its northwest, and
conducting work at this property. it is exposed throughout an area of about 3.7 km (2.3 mi)
Production: No mineral resources have been produced from long by 1.9–0.8 km (1.2–0.5 mi) wide, making it the larg-
this intrusive complex, despite its varied and substantial est exposed carbonatite mass in the United States. Staatz and
mineral resources (Van Gosen and Lowers, 2007). others (1979) estimated that the carbonatite stock of Iron Hill
contains 655.6 million metric tons (722.7 million tons) of
Estimated resources: The U.S. Geological Survey (Staatz carbonatite. On the basis of the averaged analytical results
and others, 1979) estimated that the carbonatite stock of of 28 samples of the carbonatite stock—0.4 percent for total
Iron Hill contains 655.6 million metric tons (722.7 million rare earth oxides and 0.004 percent ThO2—Staatz and others
tons) of carbonatite. On the basis of the averaged analyti- (1979) calculated potential reserves within the stock of 2.6
cal results of 28 samples of the carbonatite stock—0.4 million metric tons (2.865 million tons) of rare earth elements
percent total rare earth elements oxides and 0.004 per- oxides and 28,190 metric tons (31,080 tons) of ThO2. Recent
cent thorium oxide—Staatz and others (1979) calculated sampling of the Iron Hill carbonatite stock by Van Gosen
potential reserves within the stock of 2.6 million metric (2008) found median values (from 13 samples) of 0.19 percent
tons (2.865 million tons) of rare earth elements oxides and total rare earth oxides (table 17) and 0.0035 percent ThO2;
28,190 metric tons (31,080 tons) of thorium oxide. Apply- this result represents estimated resources within the stock of
ing an average grade of 0.057 percent niobium oxide, about 1.22 million metric tons (1.34 million tons) of rare earth
Staatz and others (1979) estimated a reserve of 374,000 elements oxides and about 23,000 metric tons (25,300 tons)
metric tons (412,000 tons) of niobium oxide in the carbon- of ThO2. (Median values were used for the Van Gosen (2008)
atite stock of Iron Hill. For an area of the pyroxenite unit, data because a few individual results exceeded the upper
Teck Resources reported that “mineable proven, probable analytical limit of detection for an element.)
and possible reserves***are 41.8 million tonnes [46 mil- Applying an average grade of 0.057 percent Nb2O5, Staatz
lion tons] grading 13.2% TiO2 [titanium oxide] within an and others (1979) estimated a reserve of 374,000 metric tons
open-ended global proven, probable and possible geologic (412,000 tons) of Nb2O5 in the carbonatite stock of Iron Hill.
resource of 1.6 billion tonnes [1.8 billion tons] grading Armbrustmacher and Brownfield (1979) found 0.003 to 0.2
10.9% TiO2” (Shaver and Lunceford, 1998, p. 63). weight percent Nb (niobium) in 28 samples of the carbonatite
stock. Van Gosen (2008) found median values of 0.0595 weight
Detailed Discussion percent Nb2O5 from 13 samples of the stock, suggesting an esti-
mated resource of 390,000 metric tons (430,000 tons) of Nb2O5.
The Iron Hill carbonatite complex is exposed for 31 km2 As noted earlier, the pyroxenite unit of the Iron Hill
(12 mi2) near the small town of Powderhorn, about 35 km complex is enriched in titanium and likely is the largest tita-
(22 mi) south-southwest of Gunnison, Colorado. The intru- nium resource in the United States. In 1968, Buttes Gas & Oil
sion is alkaline with a prominent carbonatite stock at its core. Company purchased the properties of the Iron Hill intrusive
This intrusive complex is noteworthy because of its classic complex. It focused its exploration and development primarily
geology and its mineral resource potential (Van Gosen and on titanium resources in the perovskite-rich pyroxenite on the
Lowers, 2007). This intrusive complex was described by northeast side of the Cimarron fault (Thompson, 1983). Explo-
Olson and Hedlund (1981, p. 5) as “the best example of the ration by Buttes Gas & Oil continued at the site into the 1980s.](https://image.slidesharecdn.com/usgs-rareearth-110110140819-phpapp01/85/USGS-The-Principal-Rare-Earth-Elements-Deposits-of-the-United-States-49-320.jpg)
![Colorado—Iron Hill Carbonatite Complex 43
Table 17. Median concentrations of rare earth elements in samples of carbonatite stock and pyroxenite unit, Iron Hill
carbonatite complex, Colorado.
[Rare earth elements listed in order of increasing atomic number; yttrium (Y) is included with these elements because it shares chemical and physical
similarities with the lanthanides. ppm, parts per million; wt percent, weight percent. Data from Van Gosen (2008)]
Carbonatite stock (13 samples) Pyroxenite unit (24 samples)
Median value Oxide equivalent Median value Oxide equivalent
Element Oxide Element Oxide
(ppm) (wt percent) (ppm) (wt percent)
La 344 La2O3 0.040 La 264 La2O3 0.031
Ce 681 Ce2O3 0.080 Ce 508 Ce2O3 0.060
Pr 89.7 Pr2O3 0.010 Pr 60.2 Pr2O3 0.007
Nd 337 Nd2O3 0.039 Nd 227 Nd2O3 0.026
Sm 47.8 Sm2O3 0.006 Sm 39.1 Sm2O3 0.005
Eu 11 Eu2O3 0.001 Eu 10.6 Eu2O3 0.001
Gd 33.7 Gd2O3 0.004 Gd 31.1 Gd2O3 0.004
Tb 3.72 Tb2O3 0.0004 Tb 3.64 Tb2O3 0.0004
Dy 8.04 Dy2O3 0.0009 Dy 14.1 Dy2O3 0.002
Ho 1.10 Ho2O3 0.0001 Ho 2.04 Ho2O3 0.0002
Er 2.63 Er2O3 0.0003 Er 4.48 Er2O3 0.0005
Tm 0.29 Tm2O3 0.00003 Tm 0.45 Tm2O3 0.00005
Yb 1.6 Yb2O3 0.0002 Yb 2.5 Yb2O3 0.0003
Lu 0.17 Lu2O3 0.00002 Lu 0.29 Lu2O3 0.00003
Y 27.9 Y2O3 0.004 Y 47.8 Y2O3 0.006
Total 1,590 0.186 1,215 0.143](https://image.slidesharecdn.com/usgs-rareearth-110110140819-phpapp01/85/USGS-The-Principal-Rare-Earth-Elements-Deposits-of-the-United-States-51-320.jpg)
![44 The Principal Rare Earth Elements Deposits of the United States
Figure 10. Outcrop of
pyroxenite unit in the
northern part of the Iron
Hill carbonatite complex,
southwestern Colorado.
Analyses of 24 widely
scattered samples of
this pyroxenite unit
collected throughout
the complex contained
median abundances of 5.3
percent titanium oxide,
0.06 percent cerium oxide,
0.143 percent total rare
earth elements oxides,
0.036 percent niobium
oxide, 0.0025 percent
thorium oxide, and 0.046
percent vanadium oxide
(Van Gosen, 2008).
References Cited Shaver, K.C., and Lunceford, R.A., 1998, White Earth Project,
Colorado—The largest titanium resource in the United States:
Canadian Industrial Minerals Bulletin, v. 91, p. 63–65.
Armbrustmacher, T.J., 1983, The complex of alkaline rocks
at Iron Hill, Powderhorn district, Gunnison County, Staatz, M.H., Armbrustmacher, T.J., Olson, J.C., Brownfield,
Colorado, in Handfield, R.C., ed., Gunnison Gold Belt I.K., Brock, M.R., Lemons, J.F., Jr., Coppa, L.V., and Clin-
and Powderhorn Carbonatite Field Trip Guidebook, gan, B.V., 1979, Principal thorium resources in the United
1983: Denver Region Exploration Geologists Society, States: U.S. Geological Survey Circular 805, 42 p.
p. 28–31.
Thompson, J.V., 1983, Economic potential of the carbonatite
Armbrustmacher, T.J., and Brownfield, I.K., 1979, The car- and alkalic stock at Powderhorn, Gunnison County, Colo-
bonatite stock at Iron Hill, Gunnison County, Colorado— rado, in Handfield, R.C., ed., Gunnison Gold Belt and Pow-
Chemical and mineralogical data: U.S. Geological Survey derhorn Carbonatite Field Trip Guidebook, 1983: Denver
Open-File Report 79–537, 10 p. Region Exploration Geologists Society, p. 32–42.
Best, M.G., 1982, Igneous and metamorphic petrology: San Thompson, J.V., 1987, Titanium resource in Colorado equals
Francisco, Calif., W.H. Freeman and Company, 630 p. all other US deposits: Engineering and Mining Journal, v.
188, no. 7, p. 27–30.
Hedlund, D.C., and Olson, J.C., 1975, Geologic map of the
Powderhorn quadrangle, Gunnison and Saguache Counties, Upton, G.J., 1967, Alkaline pyroxenites, in Wyllie, P.J., ed., Ultra-
Colorado: U.S. Geological Survey Geologic Quadrangle mafic and related rocks: New York, John Wiley, p. 281–288.
Map GQ–1178, scale 1:24,000.
Van Gosen, B.S., 2008, Geochemistry of rock samples col-
Olson, J.C., 1974, Geologic map of the Rudolph Hill lected from the Iron Hill carbonatite complex, Gunnison
quadrangle, Gunnison, Hinsdale, and Saguache Counties, County, Colorado: U.S. Geological Survey Open-File
Colorado: U.S. Geological Survey Geologic Quadrangle Report 2008–1119, 27 p. and 2 spreadsheet data files. (Also
Map GQ–1177, scale 1:24,000. available at http://pubs.usgs.gov/of/2008/1119/)
Olson, J.C., and Hedlund, D.C., 1981, Alkalic rocks and Van Gosen, B.S., and Lowers, H.A., 2007, Iron Hill (Pow-
resources of thorium and associated elements in the derhorn) carbonatite complex, Gunnison County, CO—A
Powderhorn district, Gunnison County, Colorado: U.S. potential source of several uncommon mineral resources:
Geological Survey Professional Paper 1049–C, 34 p. Mining Engineering, v. 59, no. 10, [October 2007], p. 56–62.](https://image.slidesharecdn.com/usgs-rareearth-110110140819-phpapp01/85/USGS-The-Principal-Rare-Earth-Elements-Deposits-of-the-United-States-52-320.jpg)
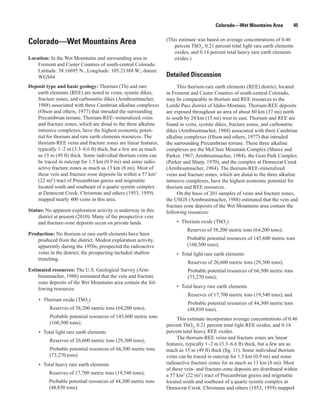
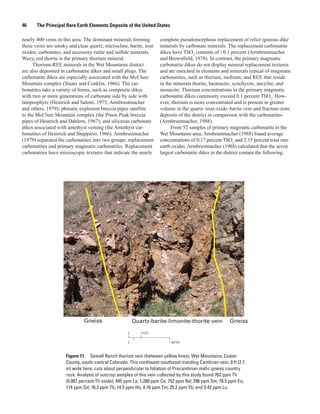
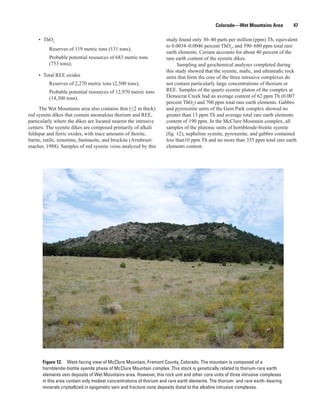
![Idaho—Hall Mountain 51
Idaho—Hall Mountain elements−bearing mineral; quartz and calcite are the most
abundant gangue minerals, associated with chlorite magnetite,
limonite, pyrite, and biotite, along with numerous minor and
Location: Veins crop out in an area of about 2.6 km2 (½ mi2)— trace minerals. A total of 30 minerals were identified by Staatz
1,830 m (6,000 ft) by 305 m (1,000 ft) wide—on Hall (1972).
Mountain in northernmost Idaho. Hall Mountain lies 1.6 According to the analyses of Staatz and others (1979),
km (1 mi) south of the United States−Canada border and the possible reserves in this district are limited to thorium
4.8 km (3 mi) east of the border station of Porthill, Idaho. resources in only a few large veins. They estimate that the tho-
Latitude: 48.98584 N., Longitude: 116.41887 W.; datum: rium reserves are 104,300 metric tons (115,000 tons) of vein
WGS84 material averaging 4.0 percent ThO2. They suggest that the
Deposit type and basic geology: The veins of Hall Mountain rare earths are probably not economical in this district because
cut Precambrian quartzite and quartz diorite. They range of their low overall concentrations (average about 0.05 percent
in exposed length from 1.8 m (6 ft) to 213 m (700 ft) rare earth elements oxides). The distribution of rare earth ele-
and in width from 0.18 m (0.6 ft) to 4 m (13 ft). Thorite ments in the Hall Mountain veins, on the basis of the average
is the primary thorium- and rare earth elements–bearing concentrations of 10 vein samples reported by Staatz and oth-
mineral; quartz and calcite are the most abundant gangue ers (1974), is summarized in table 18.
minerals, associated with chlorite magnetite, limonite,
pyrite, and biotite, along with numerous minor and trace
minerals. A total of 30 minerals were identified by Staatz
(1972).
Table 18. Mean concentrations of rare earth elements measured
Status: No active exploration has been reported in this district.
in 10 vein samples, Hall Mountain, Idaho.
Production: No mineral resources have been produced from
[Rare earth elements listed in order of increasing atomic number; yttrium (Y)
this district. is included with these elements because it shares chemical and physical simi-
Estimated resources: The U.S. Geological Survey (Staatz larities with the lanthanides. wt percent, weight percent. Data averaged from
analyses reported by Staatz and others (1974, table 1)]
and others, 1979) determined that the possible reserves
in this district are limited to thorium resources in only a
few large veins. They estimate that the thorium reserves Average
Oxide
are 104,300 metric tons (115,000 tons) of vein material wt percent
averaging 4.0 percent thorium oxide. They suggest that
the rare earth elements are probably not economical in La2O3 0.0013
this district because of their low overall concentrations Ce2O3 0.0053
(average about 0.05 percent rare earth elements oxides).
Pr2O3 <0.0006
Nd2O3 0.0016
Detailed Discussion
Sm2O3 0.0011
Thorium and REE-rich veins crop out in an area of about
2.6 km2 (½ mi2)—1,830 m (6,000 ft) by 305 m wide (1,000 Eu2O3 <0.0018
ft)—on Hall Mountain in northernmost Idaho. Hall Mountain
Gd2O3 0.0041
lies 1.6 km (1 mi) south of the United States-Canada border
and 4.8 km (3 mi) east of the border station of Porthill, Idaho. Tb2O3 <0.0018
Veins in this area can contain considerable thorium content, Dy2O3 0.0034
locally with as much as 21 percent ThO2 (Staatz, 1972);
however, their rare earth elements content is usually much less Ho2O3 <0.0012
than their thorium content. As reported by Staatz and others
(1974, p. 677), “Total rare-earth content of these veins ranges Er2O3 0.0024
from 0.00111 to 0.197 percent in 12 samples from 10 veins;
Tm2O3 <0.0017
the thoria (ThO2) content, from 0.011 to 5.84 percent.” Staatz
(1972, p. 240) reported, “The thorium content of 23 samples Yb2O3 0.0025
from 11 veins ranged from 0.0095 to 21 percent. Twelve
Lu2O3 <0. 0014
samples had a thorium content greater than 1 percent.”
The veins of Hall Mountain cut Precambrian quartzite Y 2O 3 0.0315
and quartz diorite. They range in exposed length from 1.8 Total 0.0512
to 213 m (6 to 700 ft) and vary in width from 0.18 to 4 m
(0.6 to 13 ft). Thorite is the primary thorium- and rare earth](https://image.slidesharecdn.com/usgs-rareearth-110110140819-phpapp01/85/USGS-The-Principal-Rare-Earth-Elements-Deposits-of-the-United-States-59-320.jpg)
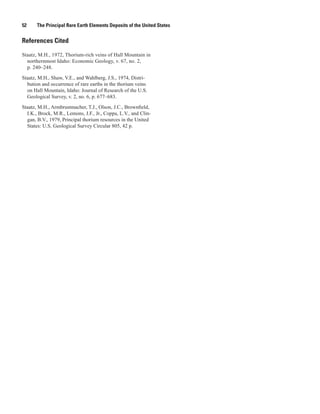
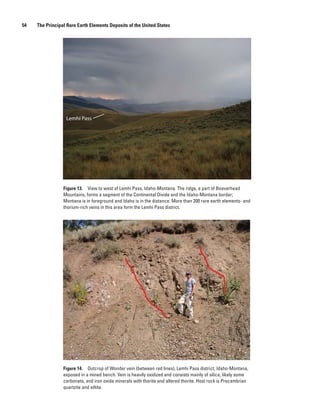
![Idaho—Lemhi Pass District, Idaho-Montana 55
The thorite veins of the Lemhi Pass district are approxi- enrichments in middle REE-group minerals. Hedrick (2010)
mately equally enriched in thorium and REE; the ratio of reported, “Based on average percentages of individual REE
thorium to REE concentrations in the veins averages around by recent sampling and previous analyses by Idaho Energy
1:1. Staatz (1972) reported the REE analyses of 31 vein Reserves Co. (a subsidiary of Idaho Power Co.), the Lemhi
samples, which showed total REE-oxide contents ranging Pass District had resources, in order of increasing atomic
from 0.073 to 2.20 percent, with an average value of 0.428 number, 77,345 t of yttrium; 25,780 t of lanthanum; 69,980
percent (very similar to the average thorium oxide content t of cerium; 11,050 t of praseodymium; 66,296 t of neodym-
of 0.43 percent found in the 10 largest veins in the district). ium; 40,515 t of samarium; 14,735 t of europium; 40,515 t of
Table 19 lists the average distribution of the rare earth ele- gadolinium; 1,840 of terbium; 14,730 t of dysprosium; 1,840
ments reported by Staatz (1972, table 5) from the analyses t each of holmium and ytterbium; and about 929 t or less
of nine samples of the Last Chance vein. The district’s each of erbium, thulium, and lutetium.”
thorium veins are most commonly enriched in the middle
REE (especially neodymium), with some veins apparently
enriched more in the heavy REE (Staatz, 1972, p. 76–77). References Cited
Using modern techniques in recent analytical work, the Idaho
Geological Survey and industry (Idaho Energy Resource Hedrick, J.B., 2010, Rare earths (advance release), in 2007
Company in 1991; Thorium Energy in 2008) has confirmed Minerals yearbook: U.S. Geological Survey, 19 p. accessed
the overall thorium and REE concentrations and the unusual September 8, 2010, at http://minerals.usgs.gov/minerals/
pubs/commodity/rare_earths/myb1-2007-raree.pdf.
Staatz, M.H., 1972, Geology and description of the thorium-
bearing veins, Lemhi Pass quadrangle, Idaho and Montana:
U.S. Geological Survey Bulletin 1351, 94 p.
Table 19. Mean concentrations of rare earth elements measured
in samples of Last Chance vein, Idaho-Montana. Staatz, M.H., Armbrustmacher, T.J., Olson, J.C., Brownfield,
I.K., Brock, M.R., Lemons, J.F., Jr., Coppa, L.V., and Clin-
[Rare earth elements listed in order of increasing atomic number; yttrium (Y) gan, B.V., 1979, Principal thorium resources in the United
is included with these elements because it shares chemical and physical simi-
States: U.S. Geological Survey Circular 805, 42 p.
larities with the lanthanides. wt percent, weight percent. Last Chance is the
largest vein in the Lemhi Pass district, Idaho-Montana. Data averaged from
Van Gosen, B.S., Gillerman, V.S., and Armbrustmacher, T.J.,
nine samples of the vein reported by Staatz (1972, table 5)]
2009, Thorium deposits of the United States—Energy
resources for the future?: U.S. Geological Survey Circu-
Average lar 1336, 21 p. (Also available at http://pubs.usgs.gov/
Oxide
wt percent circ/1336/.)
La2O3 0.033
Ce2O3 0.082
Pr2O3 0.014
Nd2O3 0.127
Sm2O3 0.087
Eu2O3 0.027
Gd2O3 0.056
Tb2O3 0.003
Dy2O3 0.008
Ho2O3 <0.003
Er2O3 0.002
Tm2O3 <0.003
Yb2O3 <0.003
Lu2O3 <0.003
Y2O3 0.015
Total 0.454](https://image.slidesharecdn.com/usgs-rareearth-110110140819-phpapp01/85/USGS-The-Principal-Rare-Earth-Elements-Deposits-of-the-United-States-63-320.jpg)
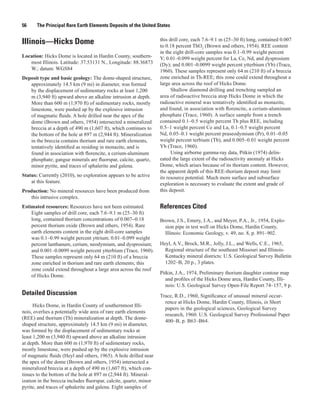
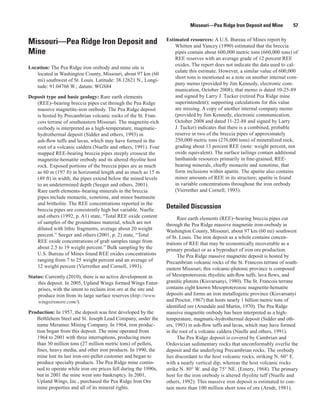
![58 The Principal Rare Earth Elements Deposits of the United States
The deposit area contains nine mappable rock units: retired Pea Ridge mine superintendent) indicates that there is a
amphibole-quartz rock; heterolithic breccia; pseudobreccia; combined, probable reserve for pipes X11 and X13 of approxi-
magnetite; hematite; silicified rock; REE mineral-bearing mately 250,000 metric tons of mineralized rock, grading about
breccia pipes; mafic dikes; and aplite dikes (Nuelle and oth- 13 percent REE (note: weight percent, not oxide equivalent).
ers, 1992; Seeger and others, 2001). Four mapped lantha- The reserves were calculated for the volume between levels
nide-bearing breccia pipes (X11, V12, X13, V14) steeply 2275 and 2675 by using a density of 2,000 lb per 9 cubic foot
crosscut the magnetite-hematite orebody and its altered (ft3) (approximately 3.56 gram per cubic centimeter (g/cm3)).
rhyolite host rock (fig. 15); the pipes are situated along the (Working levels in the mine, now flooded, are named for their
footwall and eastern edge of the iron orebody (Seeger and depth below the collar of the shaft; the uppermost level was at
others, 2001). Exposed portions of the breccia pipes are as 1,375 ft and the deepest level was at 2,675 ft.)
much as 60 m (197 ft) in horizontal length and as much as A U.S. Bureau of Mines report by Whitten and Yancey
15 m (49 ft) in width; the pipes extend below the mined (1990) estimated that the breccia pipes contain about 600,000
levels to an undetermined depth (Seeger and others, 2001). metric tons of REE reserves with an average grade of 12
One of the pipes is exposed for 120 m (394 ft) vertically. As percent REE oxides. The report does not indicate the data
described by Seeger and others (2001, p. 2), the four breccia used to calculate the 600,000 metric ton resource estimate.
pipes of the Pea Ridge deposit consist of the following: However, a similar value of 600,000 short tons is mentioned
as a note on another internal company memo (provided by
“Fragments of rhyolite, iron oxide, and silicified rock
Jim Kennedy, electronic communication, October 2008) that
in a groundmass of rock flour, feldspar, chlorite, bar-
is dated 10-25-89 and signed by Larry J. Tucker; supporting
ite, apatite, monazite, xenotime, quartz, and calcite.
calculations for this value are missing. The surface tailings
Volcanic rock fragments range from less than 1 mm
contain additional lanthanide resources, primarily in fine-
to about 0.5 m in diameter, are subrounded to angular
grained, REE-bearing minerals, chiefly monazite and xeno-
with moderate to high sphericity, and have undergone
time, that form inclusions within apatite. The apatite also
potassium metasomatism. Specularite [iron oxide]
contains minor amounts of REE in its structure; apatite is
fragments are angular, are as long as several meters,
found in variable concentrations throughout the iron orebody
and have low to moderate sphericity.”
(Vierrether and Cornell, 1993).
The REE-bearing minerals in the breccia pipes include The rare earth elements in the breccia pipes of the Pea
monazite, xenotime, and minor bastnasite and britholite. Ridge are dominated by the light REE lanthanum (La) and
Nuelle and others (1992) describe the monazite and xeno- cerium (Ce), but the pipes are also relatively enriched in
time as forming radial crystal aggregates and granular heavy REE, including dysprosium (Dy), holmium (Ho),
crystals 0.5–1.9 mm (0.02—0.75 in.) across; these minerals erbium (Er), ytterbium (Yb), lutetium (Lu), and yttrium (Y)
also replace microfragments in the wall rock and within the (table 20). The REE (lanthanide) resources of Pea Ridge are
groundmass fill fractures in barite and potassium feldspar proportionally more concentrated in these heavy REE than is
crystals. The mineralogy of Pea Ridge is summarized by true of most other U.S. deposits (table 21). The REE distri-
Nuelle (1998), and its mineral paragenesis and alteration bution in the Pea Ridge deposit was generally confirmed by
zones are described by Sidder and others (1993). Gold, tin, a recent USGS study, which collected limited samples of
and silver are unevenly distributed in the breccia pipes and in tailings and drill core at the site (Grauch and others, 2010).
both the hematite and silicified zones (Husman, 1989). Nuelle Although the total REE oxide resource at Pea Ridge (72,000
and others (1992) report localized gold concentrations as metric tons) is very small in comparison with the Mountain
much as 371 parts per million. Pass deposit (2.58 million metric tons), the Pea Ridge deposit
The REE oxide concentrations are relatively high within may be viewed as a potential source of heavy REE as a
the breccia pipes of the Pea Ridge deposit. The REE abun- byproduct of iron ore production.
dances reported in the breccia pipes are consistently high but The Pea Ridge magnetite deposit was identified in 1950
variable. Nuelle and others (1992, p. A1) state, “Total REE from a prominent magnetic anomaly. In 1957, the deposit was
oxide content of samples of the groundmass material, which first developed by the Bethlehem Steel and St. Joseph Lead
are not diluted with lithic fragments, average about 20 weight Company, under the name Meramec Mining Company. In
percent.” Seeger and others (2001, p. 2) state, “Total REE 1964, production began from this deposit. The mine operated
oxide concentrations of grab samples range from about 2.5 from 1964 to 2001, with three interruptions, and produced
to 19 weight percent.” Bulk sampling by the U.S. Bureau more than 30 million tons (27 million metric tons) of pellets,
of Mines found REE oxides concentrations ranging from 7 fines, heavy media, and other iron products. In 1990, the mine
to 25 weight percent and an average of 12 weight percent lost its last iron-ore-pellet customer and began to produce spe-
(Vierrether and Cornell, 1993). The size of the REE resource cialty products (information from the Wing Enterprises Web
in the four breccia pipes has not been determined and these site, http://www.wingsironore.com/). In contrast, Nuelle (1998)
pipes are open downward. A copy of an internal company reported a much higher historic production and stated, “to date
memo (provided by Jim Kennedy, electronic communication, [March 1998], Pea Ridge has produced 50.7 million metric
October 2008, dated 11-22-88 and signed by Larry J. Tucker, tons of iron ore.”](https://image.slidesharecdn.com/usgs-rareearth-110110140819-phpapp01/85/USGS-The-Principal-Rare-Earth-Elements-Deposits-of-the-United-States-66-320.jpg)
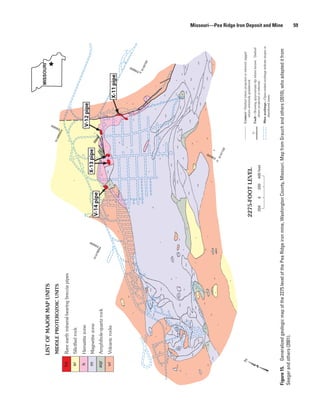
![60 The Principal Rare Earth Elements Deposits of the United States
Table 20. Rare earth elements and thorium concentrations in four breccia pipes, Pea Ridge deposit,
Missouri.
[Rare earth elements listed in order of increasing atomic number; yttrium (Y) is included with these elements because it
shares chemical and physical similarities with the lanthanides. --, not available. Data from internal company memo by
Larry J. Tucker, dated 10-25-89 (Jim Kennedy, electronic communication, October, 2008)]
Breccia pipe
Element
X-11 V-12 X-13 V-14
(percent) (percent) (percent) (percent)
La 4.45 2.70 2.95 2.05
Ce 8.00 4.50 4.95 4.05
Pr 0.68 -- 0.41 0.34
Nd 2.15 -- 1.50 1.10
Sm 0.42 -- 0.33 0.24
Eu 0.03 -- 0.03 0.02
Gd 0.15 -- 0.18 0.08
Tb -- -- -- --
Dy 0.19 -- 0.18 0.09
Ho 0.03 -- 0.03 0.01
Er 0.09 -- 0.09 0.04
Tm -- -- -- --
Yb 0.16 -- 0.12 0.06
Lu 0.02 -- 0.01 --
Y 0.70 0.69 0.67 0.36
Th 0.63 -- 0.23 0.41
The Pea Ridge mine continued to operate while iron ore The Pea Ridge mine site, currently inactive (2010), con-
prices fell during the 1990s, but in 2001 the mine went into tains an iron mine, mill, iron-pellet-making facility, and large
bankruptcy. Later that year, Upland Wings, Inc. purchased piles of milled iron-ore tailings resulting from its earlier opera-
the Pea Ridge Iron Ore mine properties and all of its mineral tion. The property now has two large tailings lakes flanked by
rights. In 2005, Upland Wings formed Wings Enterprises, extensive waste and tailings piles; most have vegetation cover,
with the intent to reclaim iron ore at the site and produce iron and several contain smaller ponds and wetlands. There are also
from its large surface reserves. Wings Enterprises suggests several small, dry tailings ponds and a variety of ore stockpiles.
that its reclamation production facility can produce more than Tailings underlie approximately 180 acres in total. The entire
30 short tons per hour of 70 percent Fe (95 percent magnetite) property is currently owned by Jim Kennedy, the president of
ore material from its estimated 300,000 short tons of surface Wings Enterprises, Inc., in Saint Louis, Missouri (http://www.
reserve. wingsironore.com/).](https://image.slidesharecdn.com/usgs-rareearth-110110140819-phpapp01/85/USGS-The-Principal-Rare-Earth-Elements-Deposits-of-the-United-States-68-320.jpg)
![Missouri—Pea Ridge Iron Deposit and Mine 61
Table 21. Rare earth elements oxide concentrations of two world-class Chinese rare earth elements deposits compared with
concentrations in major United States rare earth elements deposits.
[Rare earth elements listed in order of increasing atomic number; yttrium (Y) is included with these elements because it shares chemical and physical similari-
ties with the lanthanides. --, not available. Values listed below were calculated by combining data from sources providing either tonnage or rare earth elements
distribution]
Bayan Obo China Clay Mountain Pass Iron Hill Pea Ridge Lemhi Pass
Rare earth deposit1 deposits2 deposit3 carbonatite4 deposit5 district6
oxide
(metric tons) (metric tons) (metric tons) (metric tons) (metric tons) (metric tons)
La2O3 15,267,052 193,001 872,120 264,469 18,275 4,672
Ce2O3 23,720,328 311,762 1,279,918 522,907 32,298 11,584
Pr2O3 1,734,339 40,529 106,337 68,838 2,862 1,984
Nd2O3 6,083,552 135,197 288,040 257,716 9,474 17,903
Sm2O3 616,088 38,165 21,939 36,340 1,963 12,264
Eu2O3 99,822 3,430 2,710 8,352 158 3,776
Gd2O3 247,460 29,699 5,420 25,464 808 7,872
Tb2O3 23,884 4,282 413 2,806 -- 448
Dy2O3 56,584 22,994 878 6,051 903 1,128
Ho2O3 12,594 4,918 103 826 137 --
Er2O3 14,270 14,401 155 1,973 430 256
Tm2O3 3,376 2,059 52 216 -- --
Yb2O3 2,364 10,755 52 1,195 662 --
Lu2O3 490 1,627 -- 125 88 --
Y2O3 117,798 187,181 3,355 23,228 3,942 2,113
Total 48,000,000 1,000,000 2,581,490 1,220,506 72,000 64,000
1
Bayan Obo deposit, Inner Mongolia, China: Berger and others (2009) indicate that Bayan Obo has 800 million metric tons of ore at 6 percent REE oxide
content. Rare earth elements distribution is based on the average of three analyses of mineralized material from the East Ore Deposit; data from Yang and others
(2009).
2
China Clay deposits, southern China: Clark and Zheng (1991) indicate that the combined rare earth elements oxide content of all the China Clay deposits is at
least 1 million metric tons. Rare earth elements distribution is based on a single ore concentrate (Grauch and others, 2010, table 4).
3
Mountain Pass deposit, California: Castor and Nason (2004) indicate that Mountain Pass contains estimated reserves of 29 million metric tons of ore at 8.9
wt. percent rare earth elements oxides (by using a 5 percent cutoff). Rare earth elements distribution calculated from data in Castor (2008) from rare earth ele-
ments oxide contents in concentrate.
4
Iron Hill carbonatite, Colorado: Staatz and others (1979) estimated that the carbonatite stock of Iron Hill consists of 655.6 million metric tons of carbonatite.
Rare earth elements oxide resources were calculated from median concentrations measured by Van Gosen (2008) in 13 samples of the Iron Hill stock.
5
Pea Ridge deposit, Missouri: Whitten and Yancey (1990) indicate that Pea Ridge contains 600,000 metric tons of ore with an average tenor of 12 percent
rare earth elements oxides. Rare earth elements distribution is based on the average of composite assays of samples from four breccia pipes (Grauch and others,
2010).
6
Lemhi Pass district, Idaho-Montana: Rare earth elements distribution is based on the average of analyses of nine samples of the Last Chance vein, reported
by Staatz (1972).
References Cited Berger, V.I., Singer, D.A., and Orris, G.J., 2009, Carbonatites
of the world, explored deposits of Nb and REE—Database
Arndt, R.H., 1981, The mineral industry of Missouri, in Min- and grade and tonnage models: U.S. Geological Survey
erals Yearbook, 1978–79, Volume II, Area reports—Domes- Open-File Report 2009–1139, 17 p. plus database. (Also
tic: U.S. Bureau of Mines, p. 299–314. available at http://pubs.usgs.gov/of/2009/1139/)
Arundale, J.S., and Martin, J.A., 1970, The mineral industry Castor, S.B., 2008, The Mountain Pass rare-earth carbonatite
of Missouri, in Minerals Yearbook, 1968, Volume III, Area and associated ultrapotassic rocks, California: The Canadian
reports—Domestic: U.S. Bureau of Mines, p. 429–443. Mineralogist, v. 46, no. 4, p. 779–806.](https://image.slidesharecdn.com/usgs-rareearth-110110140819-phpapp01/85/USGS-The-Principal-Rare-Earth-Elements-Deposits-of-the-United-States-69-320.jpg)
![62 The Principal Rare Earth Elements Deposits of the United States
Castor, S.B., and Nason, G.W., 2004, Mountain Pass rare earth Seeger, C.M., Nuelle, L.M., Day, W.C., Sidder, G.B.,
deposit, California, in Castor, S.B., Papke, K.G., and Meeu- Marikos, M.A., and Smith, D.C., 2001, Geologic maps and
wig, R.O., eds., Betting on industrial minerals—Forum cross sections of mine levels at the Pea Ridge iron mine,
on the Geology of Industrial Minerals, 39th, Reno/Sparks, Washington County, Missouri: U.S. Geological Survey
Nev., May 18–24, 2003, Proceedings: Nevada Bureau of Miscellaneous Field Studies Map MF–2353, version 1.0,
Mines and Geology Special Publication 33, p. 68–81. 6 p. pamphlet, 5 sheets.
Clark, A.L., and Zheng, Shuhui, 1991, China’s rare earth Sidder, G.B., Day, W.C., Nuelle, L.M., Seeger, C.M., and
potential, industry and policy, in Siribumrungsukha, B., Kisvarsanyi, E.B., 1993, Mineralogic and fluid-inclusion
Arrykul, S., Sanguansai, P., Pungrassami, T., Sikong, L., studies of the Pea Ridge iron-rare-earth-element deposit,
and Kooptarnond, K., eds., International Conference on southeast Missouri, Chapter U, in Scott, R.W., Jr., Detra,
Rare Earth Minerals and Minerals for Electronic Uses, Hat P.S., and Berger, B.R., eds., Advances related to United
Yai, Thailand, January 23–25, 1991, Proceedings: Hat Yai, States and international mineral resources—Developing
Thailand, Prince of Songkla University, p. 577–601. frameworks and exploration technologies: U.S. Geological
Survey Bulletin 2039, p. 205–216.
Emery, J.A., 1968, Geology of the Pea Ridge iron ore body, in
Ridge, J.D., ed., Ore deposits in the United States, 1933– Staatz, M.H., 1972, Geology and description of the thorium-
1967, The Graton-Sales Volume, volume 1: New York, N.Y., bearing veins, Lemhi Pass quadrangle, Idaho and Montana:
American Institute of Mining, Metallurgical, and Petroleum U.S. Geological Survey Bulletin 1351, 94 p.
Engineers, Inc., p. 359–369.
Staatz, M.H., Armbrustmacher, T.J., Olson, J.C., Brownfield,
Grauch, R.I., Verplanck, P.L., Seeger, C.M., Budahn, J.R., and I.K., Brock, M.R., Lemons, J.F., Jr., Coppa, L.V., and Clin-
Van Gosen, B.S., 2010, Chemistry of selected core sam- gan, B.V., 1979, Principal thorium resources in the United
ples, concentrate, tailings, and tailings pond waters—Pea States: U.S. Geological Survey Circular 805, 42 p.
Ridge iron (-lanthanide-gold) deposit, Washington County,
Missouri: U.S. Geological Survey Open-File Report Van Gosen, B.S., 2008, Geochemistry of rock samples col-
2010–1080, 15 p. (Also available at http://pubs.usgs.gov/ lected from the Iron Hill carbonatite complex, Gunnison
of/2010/1080/.) County, Colorado: U.S. Geological Survey Open-File
Report 2008–1119, 27 p. and 2 spreadsheet data files. (Also
Husman, J.R., 1989, Gold, rare earth element, and other poten- available at http://pubs.usgs.gov/of/2008/1119/)
tial by-products of the Pea Ridge iron ore mine: Missouri
Department of Natural Resources, Division of Geology and Vierrether, C.W., and Cornell, W.L., 1993, Rare-earth occur-
Land Survey, Contributions to Precambrian Geology 21, rences in the Pea Ridge tailings: U.S. Bureau of Mines
Open-File Report OFR–89–78–MR, 18 p. Report of Investigations 9453, 10 p.
Kisvarsanyi, E.B., 1980, Granitic ring complexes and Precam- Whitten, C.W., and Yancey, R.J., 1990, Characterization of the
brian hot-spot activity in the St. Francois terrane, midconti- rare-earth mineralogy at the Pea Ridge deposit, Missouri:
nent region, United States: Geology, v. 8, no. 1, p. 43–47. U.S. Bureau of Mines Report of Investigations 9331, 9 p.
Kisvarsanyi, Geza, and Proctor, P.D., 1967, Trace element Yang, Xiao-Yong, Sun, Wei-Dong, Zhang, Yu-Xu, and Zheng,
content of magnetites and hematites, southeast Missouri iron Yong-Fei, 2009, Geochemical constraints on the genesis
metallogenic province, U.S.A.: Economic Geology, v. 62, of the Bayan Obo Fe-Nb-REE deposit in Inner Mongo-
no. 4, p. 449–471. lia, China: Geochimica et Cosmochimica Acta, v. 73, p.
1417–1435.
Nuelle, L.M., 1998, Minerals of the Pea Ridge mine, Washington
County, Missouri: Rocks & Minerals, v. 73, issue 2, p. 90–97.
Nuelle, L.M., Day, W.C., Sidder, G.B., and Seeger, C.M.,
1992, Geology and mineral paragenesis of the Pea Ridge
iron ore mine, Washington County, Missouri—Origin of the
rare-earth-element- and gold-bearing breccia pipes, Chapter
A, in Day, W.C., and Lane, D.E., eds., Strategic and critical
minerals in the midcontinent region, United States: U.S.
Geological Survey Bulletin 1989–A, p. A1–A11.
Nuelle, L.M., Kisvarsanyi, E.B., Seeger, C.M., Day, W.C., and
Sidder, G.B., 1991, Structural setting and control of the Pea
Ridge magnetite deposit, Middle Proterozoic St. Francois
terrane, Missouri [abs.]: Geological Society of America
Abstracts with Programs, v. 23, no. 5, p. 292.](https://image.slidesharecdn.com/usgs-rareearth-110110140819-phpapp01/85/USGS-The-Principal-Rare-Earth-Elements-Deposits-of-the-United-States-70-320.jpg)
![64 The Principal Rare Earth Elements Deposits of the United States
release, Quantum reported several assay results from Moly-
corp’s earlier drilling program, which included: detailed drill-
ing of 25 holes within a core (central) zone of the 7-km (4.3-
mi) diameter geophysical anomaly and holes spaced about
610 m (2,000 ft) apart surrounding the core zone. Reportedly,
the drilling within the core zone found high-grade niobium
contents, estimated at “39.4 million tons of 0.82 percent Nb2O5
and is open to the north, west and at depth (Molycorp, Inc.
internal memorandum, Feb 05/1986).” In the widely spaced
drilling surrounding the core zone, “least 18 of the surround-
ing holes intersected greater than 20 feet (6.1 metres) of
greater than 1.0% REO [total rare earth oxides], while at least
17 of the surrounding holes intersected greater than 10 feet
(3.05 metres) of greater than 0.6% Nb2O5.” Quantum reports
assays intervals that range from 1.02 to 3.12 percent total rare
earth oxide. They also note, “Most of the historic drill core,
sample rejects, and pulps from Molycorp’s exploration are
available for review and sampling.”
References Cited
Burfeind, W.J., Carlson, M.P., and Smith, Russell, 1971, The
Elk Creek geophysical anomaly, Johnson and Pawnee
Counties, Nebraska [abs.]: Geological Society of America
Abstracts with Programs, v. 3, no. 4, p. 254.
Carlson, M.P., and Treves, S.B., 2005, The Elk Creek Carbon-
atite, southeast Nebraska—An overview: Natural Resources
Research, v. 14, no. 1, p. 39–45.
Xu, Anshun, 1996, Mineralogy, petrology, geochemistry and
origin of the Elk Creek Carbonatite, Nebraska: Lincoln,
Nebr., University of Nebraska, Ph.D. dissertation, 299 p.](https://image.slidesharecdn.com/usgs-rareearth-110110140819-phpapp01/85/USGS-The-Principal-Rare-Earth-Elements-Deposits-of-the-United-States-72-320.jpg)
![New Mexico—Gallinas Mountains 67
New Mexico—Gallinas Mountains Detailed Discussion
Location: Gallinas mining district lies in the Gallinas Moun- The cerium-rich mineral bastnasite formed within
tains, about 16 km (10 mi) west of the town of Corona fluorite-copper sulfide deposits in the Gallinas Mountains,
in Lincoln County, central New Mexico. Latitude: about 16 km (10 mi) west of the town of Corona in Lincoln
34.19368 N., Longitude: 105.73744 W.; datum: WGS84 County, central New Mexico. In 1953–54, the Gallinas min-
ing district produced small amounts of fluorspar-rich ore (for
Deposit type and basic geology: The cerium-rich mineral
fluorine); output is estimated to have been less than 2,000 tons
bastnasite precipitated in fluorite-copper sulfide deposits
(1,800 metric tons) (Griswold, 1959). During 1954–55, the
in the Gallinas Mountains. The fluorite-copper-bastnasite
Conqueror No. 9 claim produced approximately 60 tons
deposits form veins and fill brecciated zones in sand-
(54 metric tons) of bastnasite concentrate from these same
stones and siltstones of the Permian Yeso Formation.
fluorspar deposits, which was processed nearby in Gallinas
Only two fluorspar deposits were found in porphyritic
at a small mill owned by the United States Rare Earths, Inc.
trachyte; all other fluorspar deposits in the district are
(Griswold, 1959). In 1956, the New Mexico Copper Corp.
hosted by sandstone and siltstones of the Yeso Formation.
produced about 300 tons (270 metric tons) of copper-lead-
The porphyritic character of the trachyte and the char-
fluorspar ore from its Conqueror claim in the Gallinas district,
acter of the mineral deposits (low-temperature mineral
of which about 11 tons (10 metric tons) was bastnasite ore
assemblage, brecciation, infilling of open spaces) suggest
concentrate from the Conqueror No. 10 claim.
that the intrusions and mineralizing events were shallow
The Gallinas Mountains consist of Lower Permian sedi-
(hypabyssal). The fluorite-copper-bastnasite deposits of
mentary rocks that were domed, uplifted, faulted, and frac-
the Gallinas district are found in two settings within the
tured during the emplacement of middle(?) Tertiary laccoliths
sandstones and siltstones of the Yeso Formation: as veins
composed mainly of alkaline trachyte and rhyolite (Perhac,
that fill thin fissures (1–3 in. (2.5–7.6 cm) wide] in highly
1970). The fluorite-copper-bastnasite deposits form veins and
fractured zones, and as mineral-rich masses that fill open
fill brecciated zones in sandstones and siltstones of the Perm-
spaces and veinlets in breccia zones. The brecciated
ian Yeso Formation. Only two fluorspar deposits were found in
zones were formed by faulting and are therefore regarded
porphyritic trachyte; all other fluorspar deposits in the district
as fault breccias. In both settings, fluorite is the most
are hosted by sandstone and siltstones of the Yeso Formation.
abundant mineral.
The district’s fluorite-copper-bastnasite deposits are inter-
Status: Currently (2010), there appears to be no active preted to result from epithermal (relatively low temperature)
exploration in this district. mineralization related to the intrusion of the alkaline trachyte
(Perhac and Heinrich, 1964; Perhac, 1970). The porphyritic
Production: In 1953–54, the Gallinas mining district pro-
character of the trachyte and the character of the mineral
duced small amounts of fluorspar-rich ore (for fluorine);
deposits (low-temperature mineral assemblage, brecciation,
output is estimated to have been less than 2,000 tons
and infilling of open spaces) suggest that the intrusions and
(1,800 metric tons) (Griswold, 1959). During 1954–55,
mineralizing events occurred at shallow depths (hypabyssal).
the Conqueror No. 9 claim produced approximately 60
The fluorite-copper-bastnasite ore of the Gallinas district
tons (54 metric tons) of bastnasite (a cerium-rich mineral)
was deposited in two settings within the sandstones and
concentrate from these same fluorspar deposits, which
siltstones of the Yeso Formation: as veins that fill thin fissures
was processed nearby in Gallinas at a small mill owned
(1–3 inches (2.5–7.6 cm wide) in highly fractured zones, and
by the United States Rare Earths, Inc. (Griswold, 1959).
as mineral-rich masses that fill open spaces and veinlets in
In 1956, the New Mexico Copper Corp. produced about
breccia zones. The brecciated zones were formed by faulting
300 tons (270 metric tons) of copper-lead-fluorspar ore
and are therefore regarded as fault breccias. In both settings,
from its Conqueror claim in the Gallinas district, of which
fluorite is the most abundant mineral. Fluorite content in the
about 11 tons (10 metric tons) of bastnasite ore concen-
breccia deposits averages about 60 percent (Soule, 1946).
trate from the Conqueror No. 10 claim.
Barite, calcite, and quartz are next in abundance (Soule, 1946;
Estimated resources: Soule (1946) estimated that bastna- Perhac, 1970). Other associated minerals are pyrite, galena,
site forms about 5 percent of the breccia deposits. Soule chalcopyrite, mimetite, sphalerite, conichalcite, chalcocite,
(1946) analyzed hand-picked grains of bastnasite from the wulfenite, malachite, azurite, vanadinite, mottramite, cerussite,
Gallinas district and found that the bastnasite contained chrysocolla, agardite (yttrium-bearing mineral), and bastna-
74.39 percent total rare earth elements oxides: 25.61 site (Glass and Smalley, 1945; Griswold, 1959; Perhac, 1970;
percent cerium oxide and 48.78 percent other rare earth DeMark, 1980).
elements oxides. No resource estimate of the potential The bastnasite ore forms thin, tabular, waxy yellow,
fluorspar and bastnasite tonnage within the Gallinas transparent to translucent crystals 1 to 10 mm in length, usu-
district has been published. ally about 4 mm (0.16 in.) in width and embedded in fluorite](https://image.slidesharecdn.com/usgs-rareearth-110110140819-phpapp01/85/USGS-The-Principal-Rare-Earth-Elements-Deposits-of-the-United-States-75-320.jpg)
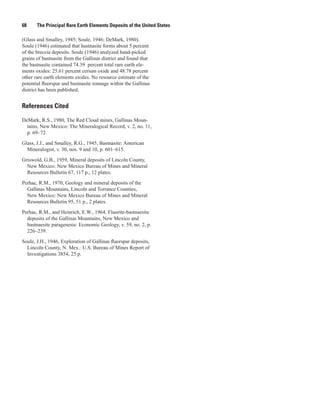
![New Mexico—Gold Hill Area and White Signal District 69
In the Gold Hill area, near the crest of the Burro Moun-
New Mexico—Gold Hill Area and tains, the same REE-bearing minerals are hosted in similar
White Signal District but larger pegmatites that also cut the Burro Mountain granite
(Hedlund, 1978). These pegmatites were prospected by small
Location: The White Signal district is located in Grant pits between 1952 and 1955. However, “the amount and
County, southwestern New Mexico. The adjacent Gold concentration of rare-earth minerals was so small that work
Hill area lies near the crest of the Burro Mountains. was soon stopped” (Gillerman, 1964, p. 127). The primary
Latitude: 32.45400 N., Longitude: 108.50603 W.; datum: pegmatite minerals are milky quartz, microcline, albite, and
WGS84 muscovite with accessory biotite, magnetite, garnet, fluorite,
and the REE-bearing minerals, such as allanite, euxenite, and
Deposit type and basic geology: Rare earth elements (REE)–
samarskite. No report of the REE concentrations in these peg-
thorium−bearing minerals form pods and lenses within
matites has been published, but Th concentrations can reach as
pegmatites hosted by the Proterozoic Burro Mountain
high as 0.72 percent (Staatz, 1974).
granite in the western part of the White Signal district.
Quartz, muscovite, and microcline are the primary miner-
als of these pegmatites. Large euhedral crystals of eux- References Cited
enite [Y,Ca,Ce,U,Th)(Nb,Ta,Ti)2O6] are found locally, and
some crystals are several inches long (Gillerman, 1964). Gillerman, Elliott, 1964, Mineral deposits of western Grant
Other REE-bearing minerals reported in the pegmatites County, New Mexico: New Mexico Bureau of Mines and
are allanite and samarskite (Richter and others, 1986). In Mineral Resources Bulletin 83, 213 p., 11 plates.
the Gold Hill area, near the crest of the Burro Mountains,
the same REE-bearing minerals are hosted in similar Hedlund, D.C., 1978, Geologic map of the Gold Hill quadran-
but larger pegmatites that also cut the Burro Mountain gle, Hidalgo and Grant Counties, New Mexico: U.S. Geo-
granite (Hedlund, 1978). The primary pegmatite miner- logical Survey Miscellaneous Field Studies Map MF–1035,
als are milky quartz, microcline, albite, and muscovite scale 1:24,000.
with accessory biotite, magnetite, garnet, fluorite, and
REE-bearing minerals such as allanite, euxenite, and Richter, D.H., and Lawrence, V.A., 1983, Mineral deposit map
samarskite. of the Silver City 1° x 2° quadrangle, New Mexico and Ari-
zona: U.S. Geological Survey Miscellaneous Investigations
Status: Currently (2010), there appears to be no active Series Map I–1310–B, scale 1:250,000.
exploration in this district.
Richter, D.H., Sharp, W.N., Watts, K.C., Raines, G.L., Houser,
Production: Shallow prospect pits were dug into the pegma- B.B., and Klein, D.P., 1986, Maps showing mineral resource
tites in order to explore their radioactivity, presumably assessment of the Silver City 1° x 2° quadrangle, New
during the 1950s, but no further development is reported. Mexico and Arizona: U.S. Geological Survey Miscella-
Estimated resources: No report of the REE concentrations in neous Investigations Series Map I–1310–F, 24 p. pamphlet,
these pegmatites has been published, but thorium concen- 1 sheet, various scales.
trations can reach as high as 0.72 percent (Staatz, 1974).
Staatz, M.H., 1974, Thorium veins in the United States: Eco-
nomic Geology, v. 69, no. 4, p. 494–507.
Detailed Discussion
Rare earth elements (REE)−thorium−bearing miner-
als form pods and lenses within pegmatites hosted by the
Proterozoic Burro Mountain granite in the western part of the
White Signal district, which lies in Grant County, southwest-
ern New Mexico (Gillerman, 1964; Richter and Lawrence,
1983; Richter and others, 1986). Shallow prospect pits were
dug into the pegmatites in order to explore their radioactiv-
ity, presumably during the 1950s, but no further development
is reported.
Quartz, muscovite, and microcline are the primary miner-
als of these pegmatites. Large euhedral crystals of euxenite
[Y,Ca,Ce,U,Th)(Nb,Ta,Ti)2O6] are found locally, and some
crystals are several inches long (Gillerman, 1964). Other REE-
bearing minerals reported in the pegmatites are allanite and
samarskite (Richter and others, 1986). No analyses of the REE
concentrations in these pegmatites have been reported.](https://image.slidesharecdn.com/usgs-rareearth-110110140819-phpapp01/85/USGS-The-Principal-Rare-Earth-Elements-Deposits-of-the-United-States-77-320.jpg)
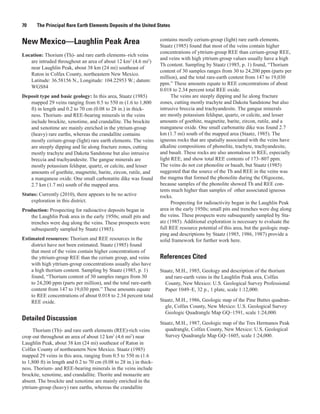
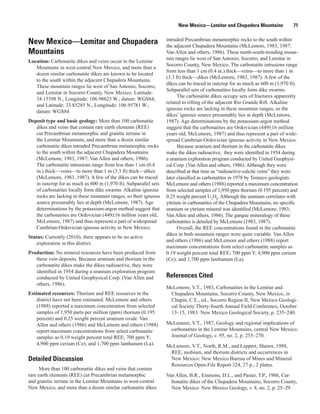
![72 The Principal Rare Earth Elements Deposits of the United States
of pegmatites in the district were mined for their large books
New Mexico—Petaca District of muscovite mica crystals beginning in 1870 and continuing
intermittently until 1944 (Bingler, 1968). Almost 50 accessory
Location: The Petaca district is located between Ojo Caliente minerals have been identified; the most common is spes-
and Tres Piedras, in Rio Arriba County, north-central New sartite (now called spessartine) garnet, columbite-tantalite
Mexico. Latitude: 36.58835 N., Longitude: 106.07170 W.; [(Fe,Mn)(Nb,Ta)2O6], fluorite, beryl, monazite, samarskite,
datum: WGS84 and ilmenite-magnetite (Wright, 1948; Redmon, 1961;
Deposit type and basic geology: Thorium- and rare earth Bingler, 1968). (Columbite and tantalite are obsolete names
elements (REE)−bearing pegmatites crop out in Precam- for a mineral series; columbite is now named ferrocolumbite
brian rocks in the southeastern Tusas Mountains (Bingler, (Fe2+Nb2O6), which forms two minerals series, with ferrotan-
1968). The pegmatites of the Petaca district take a variety talite (Fe2+Ta2O6) and with manganocolumbite [(Mn2+,Fe2+)
of shapes, such as dikes, sills, pipes, pods, troughs, and (Nb,Ta)2O6)].
irregular forms. The pegmatites crop out for 75 to 1,430 ft The elevated concentrations of niobium (Nb) and tanta-
(23 to 436 m) in length (an average outcrop length is 410 lum (Ta) in the pegmatites arise from Nb- and Ta-bearing min-
ft (125 m)), and they have an average width of 30 to 35 ft erals. For example, McLemore and others (1988) reported an
(9 to 11 m) (Bingler, 1968). Elevated REE concentrations average of Nb content of 0.04 percent in 87 pegmatites of the
in Petaca district pegmatites mainly reflect the mineral district. Similarly, monazite accounts for the pegmatites’ high
samarskite, a REE-iron-uranium-thorium-niobium-tanta- Th content. Specifically, analysis of the Globe pegmatite in the
lum-titanium−bearing oxide. district found 10,332 ppm Th (McLemore and others, 1988).
Elevated REE concentrations in Petaca district pegmatites
Status: Currently (2010), there appears to be no active mainly reflect the mineral samarskite, an REE-iron-uranium-
exploration in this district. thorium-niobium-tantalum-titanium−bearing oxide. The REE
Production: A number of pegmatites in the district were are reportedly restricted to albite-rich zones in the pegmatites.
mined for their large books of muscovite mica crystals, McLemore and others (1988, p. 4) reported this REE analysis
beginning in 1870 and continuing intermittently until of a sample of the Globe pegmatite: “600 ppm Y, 660 ppm Yb,
1944 (Bingler, 1968). 396 ppm Er, 186 ppm Gd, 3,117 ppm [total] REE + Y.” Other-
wise, the REE content of the pegmatites of the Petaca district
Estimated resources: Thorium and REE resources in the has not been published.
district have not been estimated. McLemore and oth-
ers (1988) reported an average niobium content of 0.04
percent in 87 pegmatites of the district. Monazite accounts References Cited
for the pegmatites’ high thorium content. An analysis
of the Globe pegmatite in the district found 10,332 ppm Bingler, E.C., 1968, Geology and mineral resources of Rio
thorium (McLemore and others, 1988). McLemore and Arriba County, New Mexico: New Mexico Bureau of Mines
others (1988, p. 4) reported the following REE analysis of and Mineral Resources Bulletin 91, 158 p., 8 plates.
a sample of the Globe pegmatite: “600 ppm Y, 660 ppm
Yb, 396 ppm Er, 186 ppm Gd, 3,117 ppm [total] REE + Jahns, R.H., 1946, Mica deposits of the Petaca district, Rio
Y.” Otherwise, the REE content of the pegmatites of the Arriba County, New Mexico: New Mexico Bureau of Mines
Petaca district has not been published. and Mineral Resources Bulletin 25, 294 p., 25 plates.
McLemore, V.T., North, R.M., and Leppert, Shawn, 1988,
Detailed Discussion REE, niobium, and thorium districts and occurrences in
New Mexico: New Mexico Bureau of Mines and Mineral
Thorium- and rare earth elements (REE)–bearing peg- Resources Open-File Report 324, 27 p., 2 plates.
matites are exposed in the Petaca district, located between Redmon, D.E., 1961, Reconnaissance of selected pegmatite
Ojo Caliente and Tres Piedras, in Rio Arriba County, north- districts in north-central New Mexico: U.S. Bureau of
central New Mexico. The pegmatites crop out in Precambrian Mines Information Circular 8013, 79 p.
rocks in the southeastern Tusas Mountains (Bingler, 1968).
The pegmatites of the Petaca district take a variety of shapes, Wright, L.A., 1948, The Globe pegmatite, Rio Arriba County,
such as dikes, sills, pipes, pods, troughs, and irregular forms. New Mexico: American Journal of Science, v. 246, no. 11,
The pegmatite forms and their characteristics are described p. 665–688.
in detail by Jahns (1946). They crop out for 75 to 1,430 ft (23
to 436 m) in length (an average outcrop length is 410 ft (125
m)), and they have an average width of 30 to 35 ft (9 to 11 m)
(Bingler, 1968).
The primary minerals of the Petaca district pegmatites
are microcline, quartz, plagioclase, and muscovite. A number](https://image.slidesharecdn.com/usgs-rareearth-110110140819-phpapp01/85/USGS-The-Principal-Rare-Earth-Elements-Deposits-of-the-United-States-80-320.jpg)
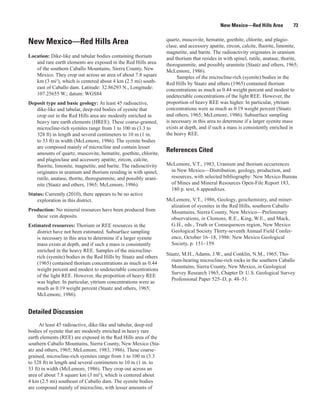
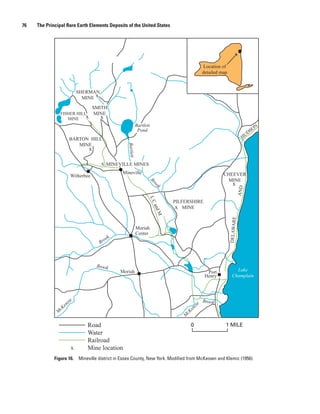
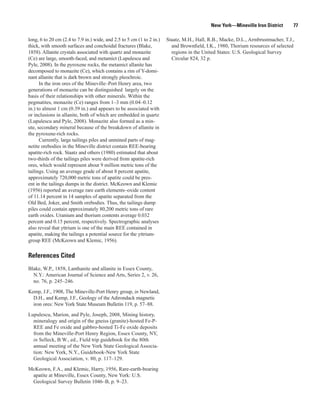
![Wyoming—Bear Lodge Mountains 79
In a broader sampling survey, Staatz (1983) collected a Table 22. Typical rare earth elements distribution in the Bear
total of 341 samples throughout an area of 10.6 km2 (4.1 mi2) Lodge Mountains deposit, Wyoming.
across the exposed core of the Bear Lodge dome (centered
[Rare earth elements listed in order of increasing atomic number; yttrium (Y) is
along Taylor Divide and Bull Hill). He found that the REE included with these elements because it shares chemical and physical similari-
content of the disseminated deposits was about 27 times greater ties with the lanthanides. Elements listed in order of increasing atomic number.
than their Th content. Staatz (1983, p. 1) reported, “Total rare- Each sample is a composite metallurgical sample. The most abundant rare earth
earth content of these samples ranged from 47 to 27,145 ppm, elements in this deposit (in bold) are light rare earths elements. Source: Rare
and the thorium content from 9.3 to 990 ppm. The amount of Element Resources, Ltd. (http://www.rareelementresources.com/s/Home.asp)]
total rare earths of individual samples shows little correlation
with that of thorium.” Staatz (1983, p. 1) also stated, Rare earth Oxide sample Unoxidized sample
element (percent) (percent)
“These deposits could be mined by open pit. The 32.5
Lanthanum 29.3
Bear Lodge disseminated deposits have one of the
largest resources of both total rare earths and tho- Cerium 45.0 46.4
rium in the United States, and although the grade of Praseodymium 4.8 4.3
both commodities is lower than some other deposits,
Neodymium 16.8 13.7
their large size and relative cheapness of mining
make them an important future resource.”
Samarium 2.0 1.4
Vein deposits in the southern Bear Lodge Mountains were Europium 0.4 0.3
defined by Staatz (1983) as all tabular bodies at least 5 cm (2
in.) in thickness. Staatz (1983) mapped 26 veins in the core Gadolinium 0.8 0.6
of the Bear Lodge uplift and described them all as thin and Terbium 0.1 0.0
short—the longest vein is exposed for 137 m (450 ft). Gangue
Dysprosium 0.2 0.2
minerals are mostly potassium feldspar and quartz, with limo-
nite, hematite, and manganese oxides. The REE and thorium Yttrium 0.5 0.5
in these veins is observed in monazite, brockite, and bast- Total 99.9 99.9
nasite. Staatz (1983, p. 1) reported, “Thorium content of 35
[vein] samples ranged from 0.01 to 1.2 percent, and the total
rare-earth content of 21 samples from 0.23 to 9.8 percent.”
Rare Element Resources, Ltd., has focused its recent REE
exploration efforts (http://www.rareelementresources.com/s/
Home.asp) on Bull Mountain (near the center of the dome) and
References Cited
areas just to the west and southeast of Bull Mountain, where
numerous carbonatite dikes are exposed. It has delineated three Ranta, Don, and Clark, Jim, 2010, Geology and evaluation of
mineralogical zones in these deposits dependent on depth of the Bear Lodge rare-earths project, Wyoming [unpublished
weathering—oxide, transitional, and unoxidized (Ranta and abs.]: Presentation to the Denver Region Exploration Geolo-
Clark, 2010). As of 2010, they estimate that the oxide zone (the gists’ Society, January 4, 2010, Lakewood, Colo.
near-surface part of the “Bull Hill deposit”) hosts 4.5 million Staatz, M.H., 1983, Geology and description of thorium and
tons at 4.3 percent REE oxides. They suggest that the total rare-earth deposits in the southern Bear Lodge Mountains,
inferred resource of the deposit is 9.8 million tons averaging northeastern Wyoming: U.S. Geological Survey Profes-
4.1 percent REE oxides. During 2009, the company drilled five sional Paper 1049–D, 52 p., 2 plates.
holes just to the northwest of Bull Mountain through a total of
5,141 vertical feet of veins and dikes; there, total REE oxide Staatz, M.H., Armbrustmacher, T.J., Olson, J.C., Brownfield,
concentrations ranged from 2.08 to 9.12 percent. The company I.K., Brock, M.R., Lemons, J.F., Jr., Coppa, L.V., and Clin-
drilled again in the summer of 2010, which will further update gan, B.V., 1979, Principal thorium resources in the United
and refine its REE resource estimates for this district. The States: U.S. Geological Survey Circular 805, 42 p.
rare earth elements distribution in these deposits is apparently
weighted toward light REE, as shown in table 22.
Rare Element Resources has focused on the oxide portions of
the Bull Hill deposit because this material has displayed favorable
recovery in its metallurgical testing (Ranta and Clark, 2010). The
loose, friable character of this material and fine-grained nature of
the REE minerals have reportedly shown a 90 percent recovery of
REE with a 13 percent REE oxide grade in the less-than-25-mm
(1-in.) fraction by employing a process using simple crushing to
less than ¼ in., scrubbing, and screening (Ranta and Clark, 2010).](https://image.slidesharecdn.com/usgs-rareearth-110110140819-phpapp01/85/USGS-The-Principal-Rare-Earth-Elements-Deposits-of-the-United-States-87-320.jpg)
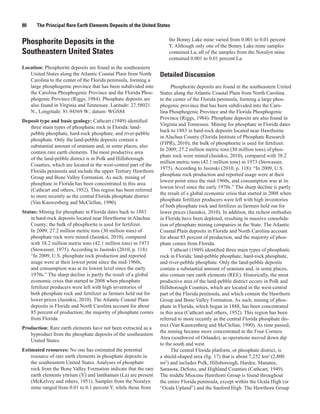
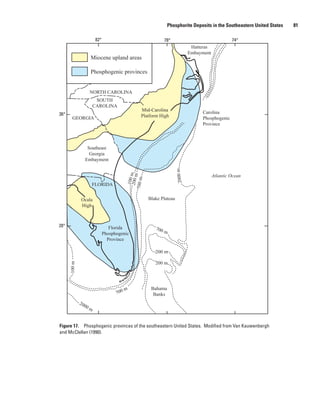
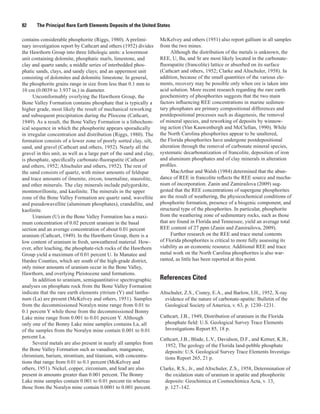
![86 The Principal Rare Earth Elements Deposits of the United States
area. The reported thorium oxide contents of monazite in
Idaho—Placer Deposits the Idaho placer deposits range from 2.2 to 6.24 percent.
The few analyses of REE in monazites from Idaho placers
Location: At least 11 monazite-bearing placer districts exist
indicate that these monazites contain 63 percent total REE
in the valleys of a region extending north of Boise,
oxides Staatz and others (1980). Staatz and others (1980)
Idaho, and along the western flank of the Idaho batholith.
calculated thorium reserves for each of the five major
Latitude: 44.40416 N., Longitude: 115.35356 W.; datum:
placer districts individually; in total, the five districts have
WGS84
total reserves of about 9,130 metric tons (10,060 tons) of
Deposit type and basic geology: Monazite-bearing alluvial thorium oxide. The REE resources of the five placer dis-
stream deposits (placers) exist in the valleys of a region tricts would presumably be at least ten times the thorium
that extends north of Boise, Idaho along the western flank resource, because the typical monazite contains about 63
of the Idaho batholith. The primary source of the resistant percent total REE oxides and 2.2–6.24 percent thorium
rare earth elements (REE)–thorium-bearing minerals in oxide.
the Idaho placers is thought to be the Idaho batholith,
in particular the quartz monzonite and pegmatite phases
of the batholith (Mackin and Schmidt, 1957). The most Detailed Discussion
common heavy minerals in the alluvial deposits (in gener-
At least 11 monazite-bearing placer districts exist in
ally decreasing amounts) are ilmenite, magnetite, sphene,
the valleys of a region extending north of Boise, Idaho, and
garnet, monazite, euxenite, zircon, and uranothorite
along the western flank of the Idaho batholith (fig. 19). Mon-
(uranium-rich thorite). In addition to REE and thorium
azite was first recognized here in 1896 as the heavy, yellow
from monazite and euxenite, the Idaho placer deposits
to brownish-yellow mineral that collected with other heavy
(and the abandoned historic dredge waste piles) contain
minerals and gold within the sluice boxes of gold placer
coproducts of titanium (in ilmenite), and niobium and
operations in the Boise Basin near Idaho City, Centerville,
tantalum (in euxenite).
and Placerville (Lindgren, 1897). In 1909, a mill designed to
Status: Currently (2010), there is no active exploration in this capture the monazite was built by the Centerville Mining and
district. Milling Co. Only a small amount of monazite concentrate
was produced for its thorium content before the mill burned
Production: In the 1950s, two areas of west-central Idaho
down in a forest fire in 1910.
were mined by dredges for monazite, Long Valley and
In the 1950s, two areas of west-central Idaho were mined
Bear Valley. Beginning in September 1950, Long Valley
by dredges for monazite recovery, Long Valley and Bear
was worked by three dredges that had earlier been used
Valley (figs. 19 and 20). Beginning in September 1950, Long
to recover gold but later were converted (with assistance
Valley was worked by three dredges that were earlier used to
from the U.S. Bureau of Mines under the sponsorship of
recover gold but later were converted (with assistance from
the U.S. Atomic Energy Commission) to recover mona-
the U.S. Bureau of Mines under the sponsorship of the U.S.
zite. The history of these dredging operations is described
Atomic Energy Commission) to recover monazite. The history
by Argall (1954) and Staatz and others (1980, p. 9–16,
of these dredging operations is described by Argall (1954) and
and references cited therein). During this 5-year period,
Staatz and others (1980, p. 9–16, and references cited therein).
Staatz and others (1980) estimated that the three dredges
The heavy minerals recovered in the Long Valley district
recovered 6,430 metric tons (7,085 tons) of monazite
were dominated by ilmenite (84 percent of heavy minerals),
containing 269 metric tons (297 tons) of thorium oxide.
followed by monazite (8 percent), garnet (5 percent), and
Dredging ended here in mid-1955, when the government
zircon (3 percent). During this 5-year period, Staatz and others
stockpile order was fulfilled. The Bear Valley placers
(1980) estimated that the three dredges recovered 6,430 metric
were worked by first one dredge in 1955, then a second
tons (7,085 tons) of monazite containing 269 metric tons
in 1956, with the intent to recover Nb and Ta for another
(297 tons) of thorium oxide. The dredging ended here in mid-
Federal government contract. According to Staatz and
1955, when the government stockpile order was fulfilled.
others (1980, p. 10), “from alluvium of Bear Valley, 2,049
Rare earth elements (REE) and thorium were also
short tons [1,858 metric tons] of euxenite, 83.5 tons [75.7
unintentionally recovered within the minerals euxenite and
metric tons] of columbite, and 54,862 tons [49,760 metric
monazite from the Bear Valley placers. The Bear Valley plac-
tons] of ilmenite were recovered.” No records of monazite
ers were worked by first one dredge in 1955, then a second
recovery were kept.
in 1956, with the intent to recover Nb and Ta for another
Estimated resources: U.S. Geological Survey geologists Federal government contract. According to Staatz and others
(Staatz and others, 1980) extensively reviewed results of (1980, p. 10), “from alluvium of Bear Valley, 2,049 short
the 1950s government dredging program in central Idaho. tons [1,858 metric tons] of euxenite, 83.5 tons [75.7 metric
They determined that the five most important monazite tons] of columbite, and 54,862 tons [49,760 metric tons] of
districts are Long Valley, Bear Valley, the Boise Basin, ilmenite were recovered.” No records of the monazite
the Burgdorf-Warren area, and the Elk City–Newsome recovery were kept.](https://image.slidesharecdn.com/usgs-rareearth-110110140819-phpapp01/85/USGS-The-Principal-Rare-Earth-Elements-Deposits-of-the-United-States-94-320.jpg)
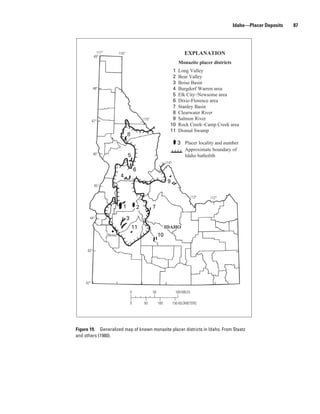
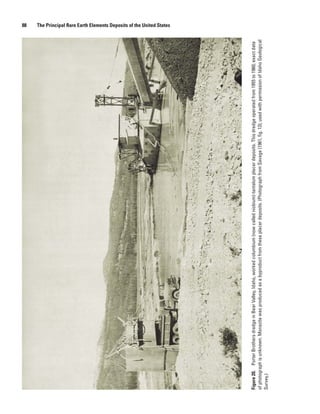
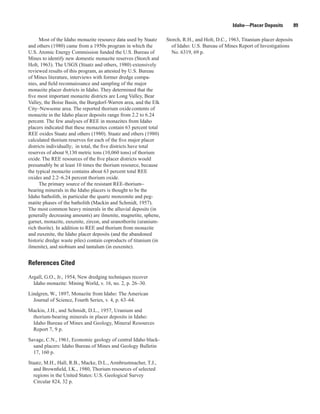
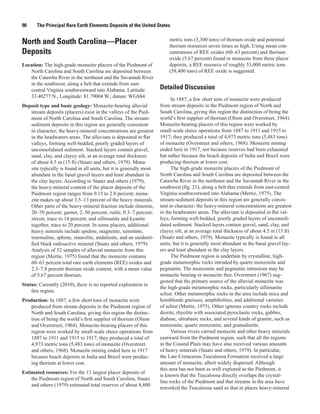
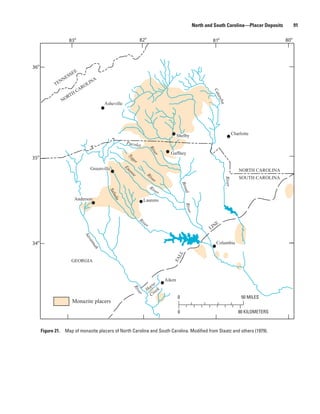
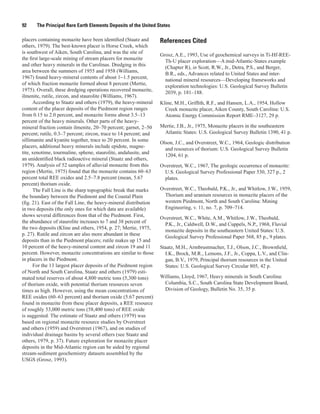
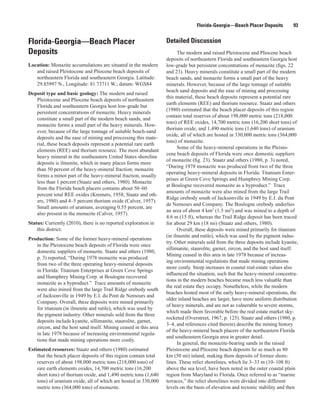
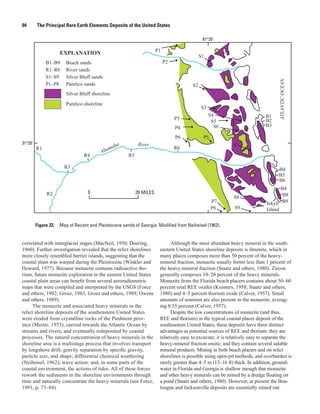
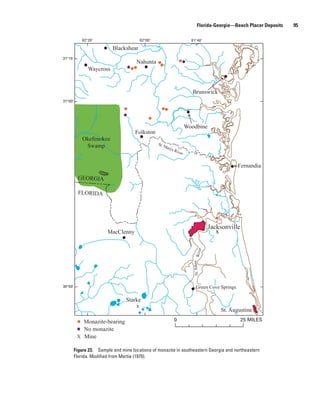
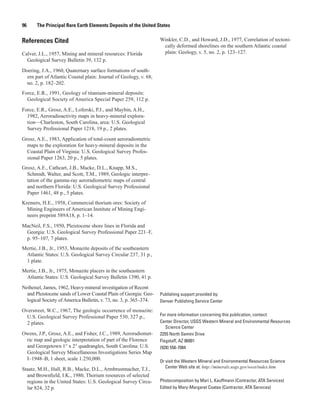


![[ls머트리얼즈]LS Materials 417200 Algorithm Investment Report](https://cdn.slidesharecdn.com/ss_thumbnails/lsmaterials417200algorithminvestmentreport-260202182715-66072c7b-thumbnail.jpg?width=640&height=640&fit=bounds)
