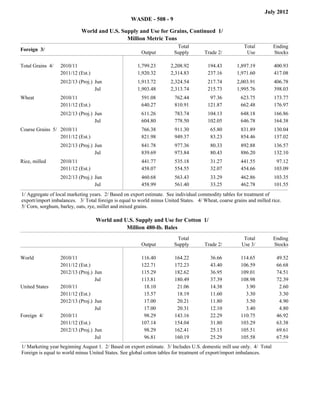
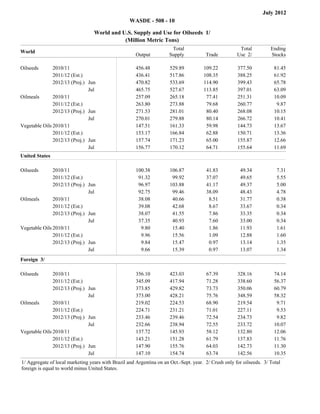
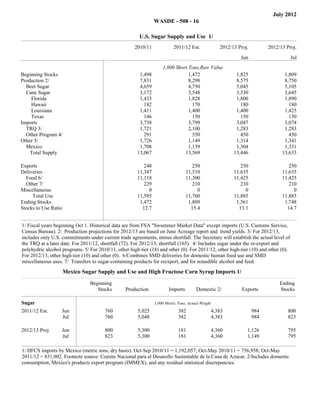
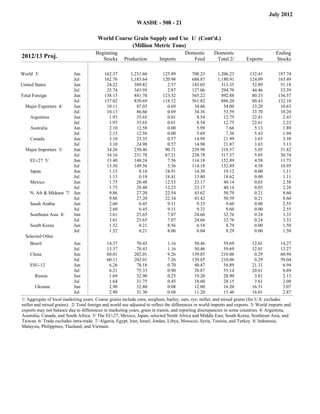
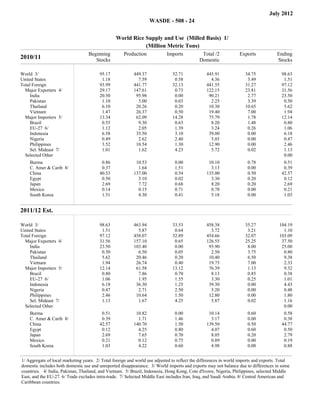
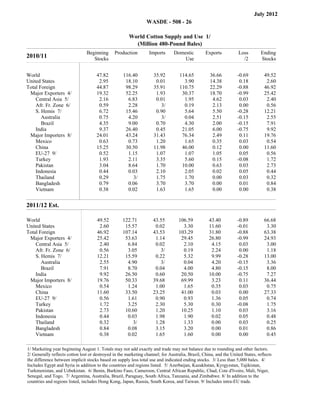
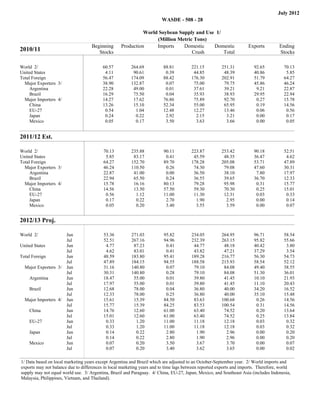
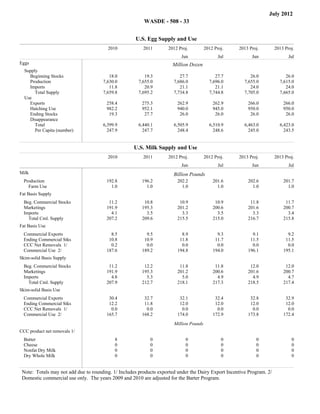
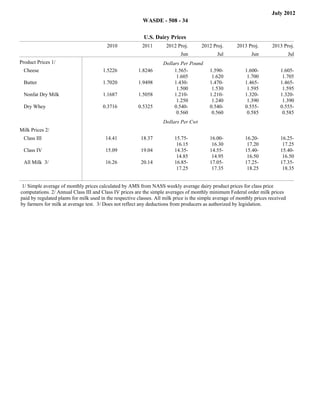
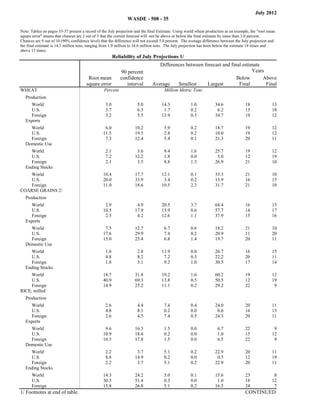
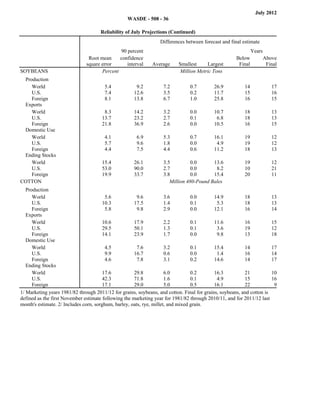
World Agricultural Supply
ISSN: 1554-9089        and Demand Estimates
                                       United States Department of Agriculture
Office of the          Agricultural Marketing Service                   Economic Research Service
Chief Economist        Farm Service Agency                              Foreign Agricultural Service
WASDE - 508               Approved by the World Agricultural Outlook Board              July 11, 2012

Note: This report adopts U.S. area, yield, and production forecasts for winter wheat, durum, other
spring wheat, barley, and oats released today by the National Agricultural Statistics Service (NASS).
For rice, corn, sorghum, soybeans, and cotton, area estimates reflect the June 29 NASS Acreage
report, and methods used to project production are noted on each table. Non-survey based yields for
some crops have been adjusted to reflect weather conditions to date. The first survey-based 2012
production forecasts for those crops will be reported by NASS on August 10.


WHEAT: Projected U.S. wheat supplies for 2012/13 are raised 5 million bushels with higher
estimated beginning stocks more than offsetting lower forecast production. Beginning stocks
were reported in the June 29 Grain Stocks report 15 million bushels above last month’s
projection. Feed and residual disappearance, seed use, and exports are all lowered slightly for
2011/12. Production for 2012/13 is reduced 10 million bushels as a 14-million-bushel reduction in
winter wheat is only partly offset by higher forecast spring wheat. Among the Hard Red Winter
wheat states, lower production for Texas, Colorado, Oklahoma, and Montana is only partly offset
by increases for Kansas and Nebraska. For the Soft Red Winter (SRW) wheat states, increases
for Ohio, Illinois, and Indiana are mostly offset by reductions in the southern SRW-producing
states.

Total U.S. wheat use for 2012/13 is projected 35 million bushels higher. Domestic U.S. food use
for 2012/13 is raised 5 million bushels on expectations of lower flour extraction rates for this
year’s crop. Projected feed and residual use is lowered 20 million bushels, with higher prices and
stronger export demand. Exports are projected 50 million bushels higher with reduced
competition from Black Sea exporters. Ending stocks for 2012/13 are projected 30 million
bushels lower. The projected range for the 2012/13 season average farm price is raised 60 cents
on both ends to $6.20 to $7.40 per bushel, supported by sharply higher corn and soybean prices.
This compares with the record $7.24 per bushel reported for 2011/12.

Global wheat supplies for 2012/13 are reduced 5.1 million tons with lower world production more
than offsetting a 1.6-million-ton increase in beginning stocks. World production is lowered 6.7
million tons with reductions for Russia, Kazakhstan, and China accounting for most of the
reduction. Russia production is lowered 4.0 million tons with lower expected yields for winter
wheat and lower area and yield prospects for spring wheat. Kazakhstan production is lowered
2.0 million tons as persistent June heat and dryness have also reduced production prospects.
China production is reduced 2.0 million tons reflecting government indications of lower yields.
Canada production is also lowered slightly, down 0.4 million tons, based on lower reported
plantings in the latest official survey by Statistics Canada. EU-27 production is raised 2.1 million
tons with increases for France, Germany, and Hungary more than offsetting a reduction for
Poland.

Global wheat consumption for 2012/13 is lowered 1.8 million tons mostly reflecting lower
expected wheat feeding in Kazakhstan, Australia, and the United States. Partly offsetting are
small increases in wheat feed and residual use for EU-27 and South Korea. Global wheat trade
is lowered slightly with imports lowered for China, Indonesia, and Uzbekistan. Partly offsetting is
an increase in imports for Iran. Exports are reduced 4.0 million tons for Russia and 1.5 million
WASDE-508-2

tons for Kazakhstan. Exports, however, are raised 2.0 million tons for India, 1.5 million tons for
EU-27, and 1.4 million tons for the United States. World ending stocks for 2012/13 are projected
3.3 million tons lower at 182.4 million.

COARSE GRAINS: U.S. feed grain supplies for 2012/13 are projected sharply lower with corn
production prospects reduced 1.8 billion bushels from last month. The projected U.S. corn yield
is lowered 20 bushels per acre to 146 bushels reflecting the rapid decline in crop conditions since
early June and the latest weather data. Persistent and extreme June dryness across the central
and eastern Corn Belt and extreme late June and early July heat from the central Plains to the
Ohio River Valley have substantially lowered yield prospects across most of the major growing
regions. Harvested area is also reduced slightly based on the June 29 Acreage report.

Reduced supplies and higher prices are expected to sharply lower 2012/13 corn usage with the
biggest reduction for feed and residual disappearance, projected down 650 million bushels.
Food, seed, and industrial use is also projected lower, down 105 million bushels, mostly reflecting
a 100-million-bushel reduction in corn used to produce ethanol. Exports are projected 300 million
bushels lower as tight supplies, higher prices, and strong competition from South American
exporters limit U.S. shipments. A 52-million-bushel increase in beginning stocks and a 15-
million-bushel increase in imports offset only a small portion of the expected reduction in this
year’s crop. Ending stocks for 2012/13 are projected at 1.2 billion bushels, down 698 million from
last month’s projection. The season average 2012/13 farm price for corn is projected at $5.40 to
$6.40 per bushel, up sharply from $4.20 to $5.00 per bushel in June.

Trade changes to the 2011/12 corn balance sheet boost projected 2011/12 ending stocks.
Imports are raised 2 million bushels based on the latest trade data. Exports are projected 50
million bushels lower reflecting the slowing pace of old-crop sales and shipments. The season
average 2011/12 farm price for corn is projected at $6.10 to $6.30 per bushel, up from $5.95 to
$6.25 per bushel last month, as cash and futures prices have soared since early June on
intensifying drought and heat across the Midwest.

Global coarse grain supplies for 2012/13 are lowered 47.6 million tons mostly reflecting the 46.2-
million-ton projected reduction in the U.S. corn crop. Partly offsetting is a 1.3-million-ton increase
in EU-27 corn production, mostly reflecting higher reported area, and a 0.4-million-ton increase in
Canada corn, also on higher reported area. Other important 2012/13 coarse grain production
changes include a 1.5-million-ton reduction for Ukraine barley, a 1.0-million-ton reduction for
Russia barley, a 0.5-million-ton reduction for Canada barley, and a 0.3-million-ton reduction for
Canada oats. Brazil 2011/12 corn production is raised again this month, up 1.0 million tons,
based on the latest reports from national and state statistical agencies.

Global 2012/13 coarse grain trade is projected lower this month mostly reflecting lower corn
exports from the United States. Corn imports are lowered 2.0 million tons each for China and
EU-27, 0.5 million tons each for Japan and South Korea, and 0.3 million tons for Mexico. Global
barley trade is also lowered with Ukraine exports down 0.5 million tons and Russia and Canada
exports each down 0.2 million tons. Barley exports for Australia and Argentina are raised 0.3
million tons and 0.2 million tons, respectively. Global corn consumption drops 22.9 million tons
with most of the decline in the United States. Corn consumption is also lowered 0.8 million tons
for India and 0.5 million tons each for Japan and South Korea. Global corn ending stocks are
projected 21.7 million tons lower with the United States accounting for 17.7 million tons of the
decline. Stocks are also lowered for China, Brazil, EU-27, and Mexico.

RICE: U.S. rice supplies in 2012/13 are raised 12.5 million cwt or 5 percent to 247.0 million cwt
as beginning stocks and production are increased 5.0 million and 8.0 million, respectively.
Conversely, the import forecast is reduced 0.5 million cwt to 21.5 million because of the
availability of larger domestic supplies. Beginning stocks for 2012/13 (ending stocks for 2011/12)
WASDE-508-3

are raised 5.0 million cwt as 2011/12 domestic and residual use is lowered based on the Rice
Stocks report released on June 29. The higher-than-expected stocks reported by USDA as of
June 1 implied lower 2011/12 usage than previously estimated during the March through May
period and a reduction in the annual estimate as well. Rice production in 2012/13 is raised 4
percent to 191.0 million cwt this month due mostly to an increase in harvested area as indicated
by the Acreage report released on June 29. Harvested area for 2012/13 is raised 107,000 acres
to 2.64 million, but is still the lowest since 1987/88. Total use for 2012/13 is raised 9.0 million cwt
to 218.0 million as domestic and residual use and exports are increased 5.0 million and 4 million,
respectively. Ending stocks for 2011/12 are projected at 29.0 million cwt, up 3.5 million, or 14
percent from a month ago.

The 2012/13 long-grain rice U.S. season average farm price (SAFP) is projected at $13.00 to
$14.00 per cwt, down $1.50 cents per cwt on each end of the range from last month compared to
$13.40 per cwt for 2011/12. The combined medium- and short-grain SAFP is projected at $15.50
to $16.50 per cwt, down $1.75 per cwt on both ends from a month ago, compared to $15.70 per
cwt for 2011/12. The 2012/13 all rice SAFP is projected at $13.80 to $14.80 per cwt, down $1.50
per cwt on each end of the range compared to $14.10 per cwt for 2011/12. Rice price projections
for 2012/13 are lowered due mostly to an increase in supplies for both long-grain and combined
medium- and short-grain rice.

Global 2012/13 rice production and ending stocks are reduced from last month, and consumption
and trade are raised slightly. Global production is projected at 465.1 million tons, still a record
despite decreases totaling 1.4 million mostly due to reductions for India and Ecuador. These
reductions are partially offset by increases for Egypt, Vietnam, and the United States. India’s
crop is projected at 100.0 million tons, down 2.5 million from last month, but still the second
largest harvest on record. The delayed and slow progress of 2012 monsoon rains has reduced
production prospects in India. Egypt’s rice crop is raised 0.7 million tons to 4.5 million due to an
increase in area as reported by the Agricultural Counselor in Cairo. Ecuador’s crop is reduced
250 thousand tons because of pest and disease problems. Global exports in 2011/12 are raised
slightly due mostly to an expected increase in U.S. exports, which is partially offset by a decrease
for Ecuador. Global imports are raised for China and several African countries. Global
consumption for 2012/13 is raised slightly to a record 466.8 million tons. World ending stocks for
2012/13 are projected at 102.5 million tons, down 1.7 million from last month, and 1.7 million
below the previous year. The decrease in ending stocks is due mostly to a decline for India.

OILSEEDS: U.S. oilseed production for 2012/13 is projected at 92.7 million tons, down 4.2
million from last month, with lower soybean production accounting for most of the change.
Soybean production is projected at 3.050 billion bushels, down 155 million as increased
harvested area is more than offset by reduced yields. Harvested area, estimated at 75.3 million
acres in the June 29 Acreage report, is 2.3 million above the June projection. The soybean yield
is projected at 40.5 bushels per acre, down 3.4 bushels from last month. The drop reflects
sharply declining crop conditions resulting from limited rainfall since early April coupled with
excessive heat across much of the producing area in late June and early July. Soybean supplies
are 160 million bushels below last month’s forecast due to lower beginning stocks and reduced
production. Soybean crush is projected at 1.61 billion bushels, down 35 million reflecting the
impact of higher soybean meal prices on meal exports and domestic disappearance. Soybean
exports for 2012/13 are reduced 115 million bushels to 1.37 billion reflecting lower U.S. supplies.
Increased exports from South America and Canada partly offset reduced U.S. exports. Soybean
ending stocks are projected at 130 million bushels, down 10 million.

U.S. soybean crush for 2011/12 is raised 15 million bushels to 1.675 billion reflecting stronger-
than-expected domestic soybean meal use. Soybean exports for 2011/12 are projected at 1.34
billion bushels, up 5 million, reflecting strong late-season sales and increased imports for China.
Seed use is raised and residual is reduced based on indications from the June 29 Acreage and
WASDE-508-4

Grain Stocks reports, respectively. Soybean ending stocks for 2011/12 are projected at 170
million bushels, down 5 million.

Prices for soybeans and soybean meal for 2012/13 are raised this month. The U.S. season
average soybean price is projected at $13.00 to $15.00 per bushel, up $1.00 on both ends of the
range. Soybean meal prices are projected at $365 to $395 per short ton, up $30 on both ends of
the range. The soybean oil price projection is unchanged at 52.5 to 56.5 cents per pound.

Global oilseed production for 2012/13 is projected at 465.7 million tons, down 5.1 million from last
month. Lower soybean, cottonseed, and sunflowerseed production estimates are only partly
offset by increases for peanuts and rapeseed. Global soybean production is projected at 267.2
million tons, down 3.9 million mostly due to lower production in the United States. Higher
soybean production for Canada resulting from increased area partly offsets the U.S. reduction.
Rapeseed production is raised for Canada due to increased harvested area reflecting record
plantings reported by Statistics Canada. Sunflowerseed production is reduced for Russia based
on indications from planting progress data reported by Russia’s Ministry of Agriculture. Other
changes include reduced rapeseed production for Russia and increased peanut, canola, and
sunflowerseed production for the United States. Global oilseed ending stocks for 2012/13 are
projected at 63.1 million tons, down 2.7 million as reduced supplies are only partly offset by lower
crush. Lower soybean stocks in the United States and South America account for most of the
change.

SUGAR: Projected U.S. sugar supply for fiscal year 2012/13 is increased 186,000 short tons,
raw value, compared with last month. Carry-in stocks are lowered due to reduced CAFTA-DR
imports in 2011/12, which lower that year’s ending stocks. Higher 2012/13 U.S. beet and cane
sugar production reflects higher-than-expected harvest area reported in the June Acreage report.
Imports from Mexico are increased due to higher carry-in supplies. Total use is unchanged.

LIVESTOCK, POULTRY, AND DAIRY: The forecasts for 2012 and 2013 red meat and poultry
production are reduced from last month as higher feed prices are expected to slow the pace of
pork and poultry expansion and temper growth in weights. Beef production is forecast higher for
2012 as deteriorating pasture conditions are expected to increase placements in feedlots.
USDA’s Cattle report, to be released on July 20 will provide an indication of the 2012 calf crop
and producers’ intentions regarding heifer retention. Beef production is reduced slightly for 2013
as the earlier placement of calves in 2012 results in a small adjustment to early 2013 marketings.
Cattle carcass weights are raised for the first part of 2012, but placement of lighter-weight cattle
in feedlots and the higher forecast cost of feed are expected to dampen weight growth in 2012
and 2013. Egg production is raised slightly for 2012 as higher prices support slightly faster
growth, but the forecast for 2013 is reduced as higher feed prices pressure producer returns.

Beef imports are raised for 2012 as demand for processing beef remains strong and a
strengthening of the U.S. dollar has helped support imports from Oceania. Beef exports are
reduced from last month as exports have slowed. Strong pork exports in April support an
increase in the 2012 forecast. Pork imports are unchanged. Broiler and turkey exports for 2012
are raised based on current export demand. Beef, pork, and turkey trade forecasts for 2013 are
unchanged from last month but the forecast of broiler exports is raised on expectations of
continued strong demand.

Cattle, broiler, and turkey price forecasts 2012 are lowered from last month, but hog prices are
raised. Egg prices are raised as current prices have been stronger than expected and supplies
are expected to be tighter in the later part of the year. For 2013, the cattle price is unchanged,
but hog, broiler, and turkey prices are raised from last month on tighter supplies. The egg price
forecast is raised as the production forecast is reduced.
WASDE-508-5

The milk production forecasts for 2012 and 2013 are reduced from last month as higher forecast
feed prices are expected to pressure producer returns and encourage a more rapid decline in the
cow herd. Milk per cow is also reduced due to higher forecast feed prices this year and next. In
addition, milk yields in the short term may be affected by recent high temperatures. Imports are
raised on a fat basis, reflecting stronger imports of cheese. Exports are raised on stronger sales
of cheese, whey, and nonfat dry milk (NDM).

Cheese prices are forecast higher for 2012 and into early 2013 as stronger exports support
prices. Butter prices are forecast higher in 2012 but weaker domestic demand is expected to
offset lower production in 2013 and the price forecast is unchanged. Weaker expected domestic
demand will also limit price movements for NDM and whey. The NDM price is reduced slightly
from last month, but the forecast for 2013 is unchanged. The whey price forecasts for both 2012
and 2013 are unchanged from last month. The Class III price forecasts for 2012 and 2013 are
raised from last month due to the higher forecast cheese price and the Class IV price for 2012 is
raised on the higher butter price. The 2012 all milk price is forecast at $17.05 to $17.35 per cwt
and the all milk price for 2013 is raised to $17.35 to $18.35 per cwt.

COTTON: This month’s 2012/13 U.S. cotton estimates show slight revisions in supply and
offtake, resulting in marginally lower ending stocks. Beginning stocks are raised 100,000 bales to
3.3 million, reflecting a decrease for domestic mill use in 2011/12. Production for 2012/13 is
unchanged at 17.0 million bales, despite a 4-percent reduction in planted area in the June
Acreage report, as abandonment and yield have been adjusted based on current conditions.
Forecast domestic mill use is reduced 100,000 bales based on recent activity levels. Exports are
raised due to higher projected global imports and slightly reduced foreign competition. Ending
stocks are now projected at 4.8 million bales. The projected range for the season average farm
price is unchanged at 60 to 80 cents per pound.

Lower beginning stocks and production trim this month’s 2012/13 world stocks projection by 3
percent. World production is reduced 1.5 million bales due to decreases for India, Pakistan, and
others. A reduction in India’s crop of 1.0 million bales reflects lower-than-expected planted area
and slightly lower yield prospects due to the monsoon delay. Total world consumption is virtually
unchanged as reductions for China and the United States are offset by increases for India,
Pakistan, and Vietnam.


Approved by the Secretary of Agriculture and the Chairperson of the World Agricultural Outlook
Board, Gerald A. Bange, (202) 720-6030. This report was prepared by the Interagency Commodity
Estimates Committees.

                                                APPROVED BY:


                                               JOSEPH W. GLAUBER
                                               ACTING SECRETARY OF AGRICULTURE
WASDE-508-6

      INTERAGENCY COMMODITY ESTIMATES COMMITTEES


Note: The World Agricultural Outlook Board reviews and approves the World Agricultural Supply and
Demand Estimates (WASDE) report. The Board’s analysts chair the Interagency Commodity
Estimates Committees (ICECs) that prepare the monthly report.

   Wheat: Jerry Norton, ICEC Chair, WAOB, E-mail: jnorton@oce.usda.gov
   Gary Vocke, ERS; Teresa McKeivier, FAS; William Chambers, FSA.

   Rice: Andrew C. Aaronson, ICEC Chair, WAOB, E-mail: aaaronson@oce.usda.gov
   Nathan Childs, ERS; Debbie Rubas, FAS; Mark Simone, FSA.

   Feed Grains: Jerry Norton, ICEC Chair, WAOB, E-mail: jnorton@oce.usda.gov
   Thomas Capehart, ERS; Richard O’Meara, FAS; Pete Riley, FSA.

   Oilseeds: Keith Menzie, ICEC Chair, WAOB, E-mail: kmenzie@oce.usda.gov
   Mark Ash, ERS; Bill George, FAS; Dale Leuck, FSA.

   Cotton: Carol Skelly, ICEC Chair, WAOB, E-mail: cskelly@oce.usda.gov
   Darryl Earnest, AMS; Leslie Meyer, ERS; James Johnson, FAS; Eugene Rosera, FSA.

   Sugar: John Love, ICEC Chair, WAOB, E-mail: jlove@oce.usda.gov
   Stephen Haley, ERS; Ron Lord, FAS; Barbara Fecso, FSA.

   Meat Animals: Shayle Shagam, ICEC Chair, WAOB, E-mail: sshagam@oce.usda.gov
   Sherry Wise, AMS; Kenneth Mathews, ERS; Claire Mezoughem, FAS; Dale Leuck, FSA.

   Poultry: Shayle Shagam, ICEC Chair, WAOB, E-mail: sshagam@oce.usda.gov
   Larry Haller, AMS; David Harvey, ERS; Lazaro Sandoval, FAS; Milton Madison, FSA.

   Dairy: Shayle Shagam, ICEC Chair, WAOB, E-mail: sshagam@oce.usda.gov
   Jerry Cessna, AMS; Roger Hoskin, ERS; Paul Kiendl, FAS; Milton Madison, FSA.


           In 2012, the WASDE report will be released on Aug. 10, Sep. 12, Oct. 11,
           Nov. 9, Dec. 11.
WASDE-508-7

                            T A B L E OF C O N T E N T S

                                                                                                                    Page
Highlights ............................................................................................................... 1
Interagency Commodity Estimates Committees ..................................................... 6
World & U.S. Supply & Use for Grains ................................................................... 8
World & U.S. Supply & Use for Cotton ................................................................... 9
World & U.S. Supply & Use for Oilseeds .............................................................. 10
U.S. Wheat Supply & Use .................................................................................... 11
U.S. Wheat Supply & Use by Class ..................................................................... 11
U.S. Feed Grain & Corn Supply & Use ................................................................ 12
U.S. Sorghum, Barley & Oats Supply & Use ........................................................ 13
U.S. Rice Supply & Use ....................................................................................... 14
U.S. Soybeans & Products Supply & Use ............................................................ 15
U.S. Sugar Supply & Use ..................................................................................... 16
Mexico Sugar Supply and Use ............................................................................. 16
U.S. Cotton Supply & Use .................................................................................... 17
World Wheat Supply & Use.................................................................................. 18
World Coarse Grains Supply & Use ..................................................................... 20
World Corn Supply & Use .................................................................................... 22
World Rice Supply & Use ..................................................................................... 24
World Cotton Supply & Use ................................................................................. 26
World Soybean Supply & Use .............................................................................. 28
World Soybean Meal Supply & Use ..................................................................... 29
World Soybean Oil Supply & Use......................................................................... 30
U.S. Quarterly Animal Product Production ........................................................... 31
U.S. Quarterly Prices for Animal Products ........................................................... 31
U.S. Meats Supply and Use ................................................................................. 32
U.S. Egg Supply & Use ........................................................................................ 33
U.S. Milk Supply and Use .................................................................................... 33
U.S. Dairy Prices ................................................................................................. 34
Reliability Tables ................................................................................................. 35
Related USDA Reports ........................................................................................ 38
Metric Conversion Factors ................................................................................... 38
Electronic Access and Subscriptions ....................................................................... 40
July 2012
                                                       WASDE - 508 - 8

                                      World and U.S Supply and Use for Grains 1/
                                                 Million Metric Tons
                                                                        Total                           Total           Ending
World
                                                       Output          Supply         Trade 2/         Use 3/           Stocks

Total Grains 4/    2010/11                            2197.12          2688.42         283.62         2230.22           458.20
                   2011/12 (Est.)                     2304.31          2762.50         311.01         2298.37           464.13
                                                              filler         filler          filler         filler           filler


                   2012/13 (Proj.) Jun                2370.17          2832.49         303.90         2354.84           477.66
                   2012/13 (Proj.) Jul                2314.04          2778.17         295.78         2327.76           450.41
                                                              filler         filler          filler         filler           filler


Wheat              2010/11                             651.14           851.69         132.43          654.46           197.23
                   2011/12 (Est.)                      694.69           891.92         150.40          694.74           197.18
                                                              filler         filler          filler         filler           filler


                   2012/13 (Proj.) Jun                 672.06           867.62         135.42          681.87           185.76
                   2012/13 (Proj.) Jul                 665.33           862.50         134.71          680.06           182.44
                                                              filler         filler          filler         filler           filler


Coarse Grains 5/ 2010/11                              1096.61          1292.19         116.43         1129.86           162.33
                 2011/12 (Est.)                       1145.68          1308.01         125.34         1145.25           162.76
                                                              filler         filler          filler         filler           filler


                   2012/13 (Proj.) Jun                1231.60          1393.97         132.41         1206.23           187.74
                   2012/13 (Proj.) Jul                1183.63          1346.39         124.89         1180.91           165.49
                                                              filler         filler          filler         filler           filler


Rice, milled       2010/11                             449.37           544.54          34.75          445.91            98.63
                   2011/12 (Est.)                      463.94           562.57          35.27          458.38           104.19
                                                              filler         filler          filler         filler           filler


                   2012/13 (Proj.) Jun                 466.51           570.90          36.06          466.74           104.16
                   2012/13 (Proj.) Jul                 465.08           569.27          36.18          466.79           102.47
                                                              filler         filler          filler         filler           filler


United States                                                           Total                           Total           Ending
                                                       Output                         Trade 2/
                                                                       Supply                          Use 3/           Stocks

Total Grains 4/   2010/11                              397.89           479.50          89.19          333.04            57.27
                  2011/12 (Est.)                       383.98           447.67          73.85          326.78            47.05
                                                              filler         filler          filler         filler           filler


                  2012/13 (Proj.) Jun                  456.45           507.96          86.16          350.92            70.88
                  2012/13 (Proj.) Jul                  410.56           464.43          80.06          332.00            52.38
                                                              filler         filler          filler         filler           filler


Wheat             2010/11                               60.06            89.25          35.08           30.71            23.47
                  2011/12 (Est.)                        54.41            81.01          28.53           32.27            20.21
                                                              filler         filler          filler         filler           filler


                  2012/13 (Proj.) Jun                   60.80            83.88          31.30           33.69            18.89
                  2012/13 (Proj.) Jul                   60.53            84.01          32.66           33.29            18.07
                                                              filler         filler          filler         filler           filler


Coarse Grains 5/ 2010/11                               330.24           380.89          50.63          297.97            32.29
                 2011/12 (Est.)                        323.70           358.64          42.11          290.79            25.74
                                                              filler         filler          filler         filler           filler


                  2012/13 (Proj.) Jun                  389.82           416.61          52.09          313.35            51.18
                  2012/13 (Proj.) Jul                  343.95           372.55          44.47          294.70            33.39
                                                              filler         filler          filler         filler           filler


Rice, milled      2010/11                                 7.59            9.36           3.49            4.36             1.51
                  2011/12 (Est.)                          5.87            8.02           3.21            3.72             1.10
                                                              filler         filler          filler         filler           filler


                  2012/13 (Proj.) Jun                     5.83            7.47           2.77            3.88             0.81
                  2012/13 (Proj.) Jul                     6.09            7.86           2.93            4.01             0.92
                                                              filler         filler          filler         filler           filler


 1/ Aggregate of local marketing years. 2/ Based on export estimate. See individual commodity tables for treatment of
 export/import imbalances. 3/ Total use for the United States is equal to domestic consumption only (excludes exports).
 4/ Wheat, coarse grains and milled rice. 5/ Corn, sorghum, barley, oats, rye, millet and mixed grains (for U.S. excludes
 millet and mixed grains).
July 2012
                                                   WASDE - 508 - 9

                            World and U.S. Supply and Use for Grains, Continued 1/
                                             Million Metric Tons
                                                                         Total                            Total           Ending
Foreign 3/
                                                        Output          Supply         Trade 2/            Use            Stocks

Total Grains 4/   2010/11                             1,799.23         2,208.92         194.43         1,897.19           400.93
                  2011/12 (Est.)                      1,920.32         2,314.83         237.16         1,971.60           417.08
                                                              filler          filler          filler          filler           filler


                  2012/13 (Proj.) Jun                 1,913.72         2,324.54         217.74         2,003.91           406.78
                  2012/13 (Proj.) Jul                 1,903.48         2,313.74         215.73         1,995.76           398.03
                                                              filler          filler          filler          filler           filler


Wheat             2010/11                               591.08          762.44           97.36          623.75            173.77
                  2011/12 (Est.)                        640.27          810.91          121.87          662.48            176.97
                                                              filler          filler          filler          filler           filler


                  2012/13 (Proj.) Jun                   611.26          783.74          104.13          648.18            166.86
                  2012/13 (Proj.) Jul                   604.80          778.50          102.05          646.78            164.38
                                                              filler          filler          filler          filler           filler


Coarse Grains 5/ 2010/11                                766.38          911.30           65.80          831.89            130.04
                 2011/12 (Est.)                         821.98          949.37           83.23          854.46            137.02
                                                              filler          filler          filler          filler           filler


                  2012/13 (Proj.) Jun                   841.78          977.36           80.33          892.88            136.57
                  2012/13 (Proj.) Jul                   839.69          973.84           80.43          886.20            132.10
                                                              filler          filler          filler          filler           filler


Rice, milled      2010/11                               441.77          535.18           31.27          441.55             97.12
                  2011/12 (Est.)                        458.07          554.55           32.07          454.66            103.09
                                                              filler          filler          filler          filler           filler


                  2012/13 (Proj.) Jun                   460.68          563.43           33.29          462.86            103.35
                  2012/13 (Proj.) Jul                   458.99          561.40           33.25          462.78            101.55
                                                              filler          filler          filler          filler           filler


1/ Aggregate of local marketing years. 2/ Based on export estimate. See individual commodity tables for treatment of
export/import imbalances. 3/ Total foreign is equal to world minus United States. 4/ Wheat, coarse grains and milled rice.
5/ Corn, sorghum, barley, oats, rye, millet and mixed grains.

                                    World and U.S. Supply and Use for Cotton 1/
                                               Million 480-lb. Bales
                                                                         Total                            Total           Ending
                                                        Output          Supply         Trade 2/          Use 3/           Stocks

World             2010/11                               116.40          164.22           36.66          114.65             49.52
                  2011/12 (Est.)                        122.71          172.23           43.40          106.59             66.68
                  2012/13 (Proj.)   Jun                 115.29          182.62           36.95          109.01             74.51
                  2012/13 (Proj.)   Jul                 113.81          180.49           37.39          108.98             72.39
United States     2010/11                                18.10           21.06           14.38            3.90              2.60
                  2011/12 (Est.)                         15.57           18.19           11.60            3.30              3.30
                  2012/13 (Proj.)   Jun                  17.00           20.21           11.80            3.50              4.90
                  2012/13 (Proj.)   Jul                  17.00           20.31           12.10            3.40              4.80
Foreign 4/        2010/11                                98.29          143.16           22.29          110.75             46.92
                  2011/12 (Est.)                        107.14          154.04           31.80          103.29             63.38
                  2012/13 (Proj.)   Jun                  98.29          162.41           25.15          105.51             69.61
                  2012/13 (Proj.)   Jul                  96.81          160.19           25.29          105.58             67.59
1/ Marketing year beginning August 1. 2/ Based on export estimate. 3/ Includes U.S. domestic mill use only. 4/ Total
Foreign is equal to world minus United States. See global cotton tables for treatment of export/import imbalances.
July 2012
                                                   WASDE - 508 - 10

                                   World and U.S. Supply and Use for Oilseeds 1/
                                              (Million Metric Tons)
                                                                       Total                           Total              Ending
World
                                                      Output          Supply           Trade          Use 2/              Stocks

Oilseeds       2010/11                                456.48          529.89          109.22          377.50               81.45
               2011/12 (Est.)                         436.41          517.86          108.35          388.25               61.92
               2012/13 (Proj.)   Jun                  470.82          533.69          114.90          399.43               65.78
               2012/13 (Proj.)   Jul                  465.75          527.67          113.85          397.01               63.09
Oilmeals       2010/11                                257.09          265.18           77.41          251.31               10.09
               2011/12 (Est.)                         263.80          273.88           79.68          260.77                9.87
               2012/13 (Proj.)   Jun                  271.53          281.01           80.40          268.08               10.15
               2012/13 (Proj.)   Jul                  270.01          279.88           80.14          266.72               10.41
Vegetable Oils 2010/11                                147.51          161.33           59.98          144.73               13.67
               2011/12 (Est.)                         153.17          166.84           62.88          150.71               13.36
               2012/13 (Proj.)   Jun                  157.74          171.23           65.00          155.87               12.66
               2012/13 (Proj.)   Jul                  156.77          170.12           64.71          155.64               11.69
United States                                               Output
                                                                             Total
                                                                            Supply          Trade
                                                                                                              Total
                                                                                                            /Use 2
                                                                                                                               Ending
                                                                                                                               Stocks


Oilseeds       2010/11                                100.38          106.87           41.83           49.34                7.31
               2011/12 (Est.)                          91.32           99.92           37.07           49.65                5.55
               2012/13 (Proj.)   Jun                   96.97          103.88           41.17           49.37                5.00
               2012/13 (Proj.)   Jul                   92.75           99.46           38.09           48.43                4.78
Oilmeals       2010/11                                 38.08           40.66            8.51           31.77                0.38
               2011/12 (Est.)                          39.08           42.68            8.67           33.67                0.34
               2012/13 (Proj.)   Jun                   38.07           41.55            7.86           33.35                0.34
               2012/13 (Proj.)   Jul                   37.35           40.93            7.60           33.00                0.34
Vegetable Oils 2010/11                                  9.80           15.40            1.86           11.93                1.61
               2011/12 (Est.)                           9.96           15.56            1.09           12.88                1.60
               2012/13 (Proj.)   Jun                    9.84           15.47            0.97           13.14                1.35
               2012/13 (Proj.)   Jul                    9.66           15.39            0.97           13.07                1.34
                                                             filler          filler         filler            filler            filler


Foreign 3/                                                  Output
                                                                             Total
                                                                            Supply          Trade
                                                                                                              Total
                                                                                                            /Use 2
                                                                                                                               Ending
                                                                                                                               Stocks


Oilseeds       2010/11                                356.10          423.03           67.39          328.16               74.14
               2011/12 (Est.)                         345.09          417.94           71.28          338.60               56.37
               2012/13 (Proj.)   Jun                  373.85          429.82           73.73          350.06               60.79
               2012/13 (Proj.)   Jul                  373.00          428.21           75.76          348.59               58.32
Oilmeals       2010/11                                219.02          224.53           68.90          219.54                9.71
               2011/12 (Est.)                         224.71          231.21           71.01          227.11                9.53
               2012/13 (Proj.)   Jun                  233.46          239.46           72.54          234.73                9.82
               2012/13 (Proj.)   Jul                  232.66          238.94           72.55          233.72               10.07
Vegetable Oils 2010/11                                137.72          145.93           58.12          132.80               12.06
               2011/12 (Est.)                         143.21          151.28           61.79          137.83               11.76
               2012/13 (Proj.)   Jun                  147.90          155.76           64.03          142.73               11.30
               2012/13 (Proj.)   Jul                  147.10          154.74           63.74          142.56               10.35
1/ Aggregate of local marketing years with Brazil and Argentina on an Oct.-Sept. year. 2/ Crush only for oilseeds. 3/ Total
foreign is equal to world minus United States.
July 2012
                                                    WASDE - 508 - 11

                                               U.S. Wheat Supply and Use 1/

                                                           2010/11              2011/12 Est.     2012/13 Proj.      2012/13 Proj.

                                                                                                           Jun                  Jul
                                                                                           Million Acres
Area Planted                                                    53.6                   54.4             55.9 *                56.0
Area Harvested                                                  47.6                   45.7             49.2 *                48.8
                                                                                           Bushels
Yield per Harvested Acre                                        46.3                   43.7             45.4 *                45.6
                                                                                           Million Bushels
Beginning Stocks                                                 976                    862                728                 743
Production                                                     2,207                  1,999              2,234               2,224
Imports                                                           97                    115                120                 120
 Supply, Total                                                 3,279                  2,977              3,082               3,087
Food                                                             926                    940                945                 950
Seed                                                              71                     77                  73                 73
Feed and Residual                                                132                    169                220                 200
 Domestic, Total                                               1,128                  1,186              1,238               1,223
Exports                                                        1,289                  1,048              1,150               1,200
 Use, Total                                                    2,417                  2,234              2,388               2,423
Ending Stocks                                                    862                    743                694                 664
 CCC Inventory                                                     0                      0
 Free Stocks                                                     862                    743
   Outstanding Loans                                              15                     10
Avg. Farm Price ($/bu) 2/                                       5.70                   7.24         5.60 - 6.80         6.20 - 7.40


                                        U.S. Wheat by Class: Supply and Use
                                                       Hard             Hard            Soft
Year beginning June 1
                                                      Winter           Spring           Red       White       Durum          Total
                                                                                     Million    Bushels
2011/12 (Est.) Beginning Stocks                          386             185            171           85          35           862
               Production                                780             398            458          314          50          1,999
                Supply, Total 3/                       1,167             619            662          407          123         2,977
                Domestic Use                             452             223            313          127          71          1,186
               Exports                                   398             245            163          216          26          1,048
                Use, Total                               850             468            477          343          97          2,234
               Ending Stocks, Total                      317             151            185           64          26           743


2012/13 (Proj.) Beginning Stocks                         317             151            185           64          26           743
                Production                             1,010             435            429          268          82          2,224
                 Supply, Total 3/                      1,328             626            644          341          148         3,087
                 Domestic Use                            462             246            311          121          83          1,223
                Exports                                  600             225            190          160          25          1,200
                 Use, Total                            1,062             471            501          281          108         2,423
                Ending Stocks, Total     Jul             266             155            143           60           40          664
                Ending Stocks, Total     Jun             NA              NA             NA           NA           NA           NA


Note: Totals may not add due to rounding. 1/ Marketing year beginning June 1. 2/ Marketing-year weighted average price
received by farmers. 3/ Includes imports. * For June, planted acres reported in the March 30, 2012, "Prospective Plantings."
Winter wheat harvested acres and yield reported in the June 12, 2012,"Crop Production." Harvested acres and yield for other
spring wheat and durum are projected using 10-year harvested-to-planted ratios by state and 1985-2011 yield trends by state
(except for Arizona, California, and Idaho durum). For July, area planted, area harvested, yield, and production as reported in
the July 11, 2012,"Crop Production."
July 2012
                                                        WASDE - 508 - 12

                                       U.S. Feed Grain and Corn Supply and Use 1/
                                                         2010/11            2011/12 Est.          2012/13 Proj.                        2012/13 Proj.
FEED GRAINS
                                                                                                            Jun                                  Jul
                                                                                          Million Acres
Area Planted                                                 99.6                   102.5               108.0 *                             109.0 *
Area Harvested                                               90.0                    91.1                98.3 *                              98.4 *
                                                                                          Metric Tons
Yield per Harvested Acre                                     3.67                    3.55                  3.96                                3.49
                                                                                          Million Metric Tons
Beginning Stocks                                             48.1                    32.3                  24.2                                25.7
Production                                                  330.0                   323.5                 389.6                               343.8
Imports                                                       2.4                     2.5                   2.4                                 2.7
  Supply, Total                                             380.5                   358.3                 416.3                               372.2
Feed and Residual                                           127.7                   119.6                 143.0                               127.0
Food Seed & Industrial                                      170.0                   170.8                 170.1                               167.4
  Domestic, Total                                           297.6                   290.5                 313.0                               294.4
Exports                                                      50.6                    42.1                  52.1                                44.5
  Use, Total                                                348.3                   332.6                 365.1                               338.8
Ending Stocks                                                32.3                    25.7                  51.2                                33.4
  CCC Inventory                                               0.0                     0.0
  Free Stocks                                                32.3                    25.7
    Outstanding Loans                                         1.3                     2.6
                                                                 11/2010                .Est 12/2011                   .Proj 13/2012              .Proj 13/2012


CORN                                                                                                                           June                        July


                                                                                                   Million Acres
Area Planted                                                 88.2                    91.9                          95.9 *                     96.4 *
Area Harvested                                               81.4                    84.0                          89.1 *                     88.9 *
                                                                                         Bushels
Yield per Harvested Acre                                    152.8                  147.2              166.0 *                               146.0 *
                                                                                         Million Bushels
Beginning Stocks                                            1,708                  1,128                   851                                  903
Production                                                 12,447                 12,358               14,790                                12,970
Imports                                                        28                      22                   15                                   30
  Supply, Total                                            14,182                 13,508               15,656                                13,903
Feed and Residual                                           4,793                  4,550                 5,450                                4,800
Food, Seed & Industrial 2/                                  6,428                  6,455                 6,425                                6,320
  Ethanol & by-products 3/                                  5,021                  5,050                 5,000                                4,900
  Domestic, Total                                          11,220                 11,005               11,875                                11,120
Exports                                                     1,835                  1,600                 1,900                                1,600
  Use, Total                                               13,055                 12,605               13,775                                12,720
Ending Stocks                                               1,128                    903                 1,881                                1,183
  CCC Inventory                                                 0                       0
  Free Stocks                                               1,128                    903
    Outstanding Loans                                          48                    100
Avg. Farm Price ($/bu) 4/                                    5.18             6.10 - 6.30          4.20 - 5.00                           5.40 - 6.40

Note: Totals may not add due to rounding. 1/ Marketing year beginning September 1 for corn and sorghum; June 1 for barley and oats.
2/ For a breakout of FSI corn uses, see Feed Outlook table 5 or access the data on the Web through the Feed Grains Database at
www.ers.usda.gov/data/feedgrains. 3/ Corn processed in ethanol plants to produce ethanol and by-products including distillers' grains,
corn gluten feed, corn gluten meal, and corn oil. 4/ Marketing-year weighted average price received by farmers. * For June, planted acres
reported in the March 30, 2012, "Prospective Plantings." For corn, harvested acres projected based on historical abandonment and derived
demand for silage. Projected corn yield based on the simple linear trend of the national average yield for 1990-2010 adjusted for 2012
planting progress. For July, corn planted and harvested area as reported in the June 29, 2012, "Acreage." Projected corn yield lowered to
reflect expected impacts of persistent and extreme June and early July dryness and heat across the central and eastern Corn Belt.
July 2012
                                                              WASDE - 508 - 13

                                         U.S. Sorghum, Barley, and Oats Supply and Use 1/
                                                               2010/11            2011/12 Est.                       2012/13 Proj.               2012/13 Proj.
     SORGHUM
                                                                                                                              Jun                          Jul
                                                                                                              Bushels Million
Filler                                                                   Filler                      Filler                             Filler                     Filler


Area Planted (mil. acres)                                           5.4                     5.5                               6.0 *                      6.2 *
Area Harvested (mil. acres)                                         4.8                     3.9                               5.2 *                      5.2 *
Yield (bushels/acre)                                               71.8                    54.6                             65.0 *                     64.9 *
Beginning Stocks                                                     41                      27                                  27                         27
Production                                                          346                     214                                335                        340
Imports                                                               0                       0                                   0                          0
  Supply, Total                                                     387                     242                                362                        367
Feed and Residual                                                   124                      75                                  90                       100
Food, Seed & Industrial                                              85                      90                                  90                         90
  Total Domestic                                                    209                     165                                180                        190
Exports                                                             150                      50                                140                        140
  Use, Total                                                        359                     215                                320                        330
Ending Stocks                                                        27                      27                                  42                         37
Avg. Farm Price ($/bu) 2/                                          5.02             6.00 - 6.20                         3.85 - 4.65                5.00 - 6.00
Filler                                                                   Filler                      Filler                             Filler                     Filler


                                                                       11/2010                 .Est 12/2011                      .Proj 13/2012              .Proj 13/2012


     BARLEY
                                                                                                                                         June                        July


Filler                                                                   Filler                      Filler                             Filler                     Filler


Area Planted (mil. acres)                                           2.9                     2.6                               3.3 *                      3.7 *
Area Harvested (mil. acres)                                         2.5                     2.2                               2.9 *                      3.3 *
Yield (bushels/acre)                                               73.1                    69.6                             69.0 *                     66.3 *
Beginning Stocks                                                    115                      89                                  52                         60
Production                                                          180                     156                                200                        217
Imports                                                               9                      14                                  15                         15
  Supply, Total                                                     305                     259                                267                        292
Feed and Residual                                                    50                      32                                  30                         50
Food, Seed & Industrial                                             159                     160                                160                        160
  Total Domestic                                                    208                     192                                190                        210
Exports                                                               8                       7                                  10                         10
  Use, Total                                                        216                     199                                200                        220
Ending Stocks                                                        89                      60                                  67                         72
Avg. Farm Price ($/bu) 2/                                          3.86                    5.35                         5.10 - 6.10                5.30 - 6.30
Filler                                                                   Filler                      Filler                             Filler                     Filler


                                                                       11/2010                 .Est 12/2011                      .Proj 13/2012              .Proj 13/2012


     OATS
                                                                                                                                         June                        July


Filler                                                                   Filler                      Filler                             Filler                     Filler


Area Planted (mil. acres)                                           3.1                     2.5                               2.9 *                      2.7 *
Area Harvested (mil. acres)                                         1.3                     0.9                               1.2 *                      1.1 *
Yield (bushels/acre)                                               64.3                    57.1                             65.2 *                     59.8 *
Beginning Stocks                                                     80                      68                                  52                         55
Production                                                           81                      54                                  75                         65
Imports                                                              85                      95                                100                          95
  Supply, Total                                                     247                     216                                227                        215
Feed and Residual                                                   102                      82                                  90                         80
Food, Seed & Industrial                                              74                      76                                  76                         76
  Total Domestic                                                    176                     158                                166                        156
Exports                                                               3                       3                                   3                          3
  Use, Total                                                        179                     161                                169                        159
Ending Stocks                                                        68                      55                                  58                         56
Avg. Farm Price ($/bu) 2/                                          2.52                    3.49                         2.40 - 3.00                3.10 - 3.90
Filler                                                                   Filler                      Filler                             Filler                     Filler


     Note: Totals may not add due to rounding. 1/ Marketing year beginning September 1 for sorghum; June 1 for barley and oats. 2/
     Marketing-year weighted average price received by farmers. * For June--Planted acres reported in the March 30, 2012, "Prospective
     Plantings." Harvested area - For sorghum, harvested acres are based on the 5-year Olympic average harvested-to-planted ratio, 2007-
     2011. For barley and oats, harvested acres are based on the 5-year average harvested-to-planted ratios, 2007-2011. Yield - For sorghum
     the projected yield is based on the 3-year average, 2009-2011, adjusted for rounding in production. For barley and oats, projected yields
     are based on the 1990-2011 trends adjusted for rounding in production. For July--Sorghum planted and harvested area as reported in the
     June 29, 2012, "Acreage." Sorghum projected yield is based on the 3-year average, 2009-2011, adjusted for rounding in production.
     Barley and oats area planted, area harvested, yield, and production as reported in the July 11, 2012, "Crop Production."
July 2012
                                                                                           WASDE - 508 - 14

                                                                     U.S. Rice Supply and Use 1/
                                                              (Rough Equivalent of Rough and Milled Rice)
                                                                       2010/11                   2011/12 Est.         2012/13 Proj.                      2012/13 Proj.
         TOTAL RICE
                                                                                                                                Jun                                Jul
                                                                                                             Million Acres
Area Planted                                                                3.64                        2.69                 2.56 *                             2.66 *
Area Harvested
Filler
                                                                            3.62                        2.62                 2.53 *                             2.64 *
                                                                                                             Pounds
Yield per Harvested Acre                                                  6,725                        7,067               7,225 *                            7,235 *
                                                                                                      Million Hundredweight
 Beginning Stocks 2/                                                       36.5                         48.5                   29.5                               34.5
 Production                                                               243.1                        185.0                  183.0                              191.0
 Imports                                                                   18.3                         20.0                   22.0                               21.5
   Supply, Total                                                          297.9                        253.5                  234.5                              247.0
 Domestic & Residual 3/                                                   137.8                        118.0                  122.0                              126.0
 Exports, Total 4/                                                        111.6                        101.0                   87.0                               92.0
   Rough                                                                   34.9                         33.0                   32.0                               32.0
   Milled (rough equiv.)                                                   76.8                         68.0                   55.0                               60.0
     Use, Total                                                           249.5                        219.0                  209.0                              218.0
 Ending Stocks                                                             48.5                         34.5                   25.5                               29.0
Avg. Milling Yield (%) 5/                                                 68.86                        70.00                  70.25                              70.25
Avg. Farm Price ($/cwt) 6/                                                12.70                        14.10          15.30 - 16.30                      13.80 - 14.80
Total


                                                                                11/2010                     .Est 12/2011                 .Proj 13/2012                .Proj 13/2012


     LONG-GRAIN RICE
                                                                                                                                                 June                          July


         Harvested Acres (mil.)                                             2.83                        1.74
Filler                                                                            Filler                          Filler                        Filler                       Filler


         Yield (pounds/acre)                                              6,486                        6,691
         Beginning Stocks                                                  23.0                         35.6                        16.1                          18.6
         Production                                                       183.3                        116.4                       127.5                         133.5
           Supply, Total 7/                                               222.2                        169.6                       162.6                         171.1
         Domestic & Residual 3/                                           108.5                         85.0                        90.0                          94.0
         Exports 8/                                                        78.0                         66.0                        57.0                          60.0
           Use, Total                                                     186.5                        151.0                       147.0                         154.0
         Ending Stocks                                                     35.6                         18.6                        15.6                          17.1
         Avg. Farm Price ($/cwt) 6/                                       11.00                        13.40               14.50 - 15.50                 13.00 - 14.00
Filler                                                                            Filler                          Filler                        Filler                       Filler


                                                                                11/2010                     .Est 12/2011                 .Proj 13/2012                .Proj 13/2012


         MEDIUM & SHORT-GRAIN
         RICE                                                                                                                                    June                          July


         Harvested Acres (mil.)                                             0.79                        0.88
Filler                                                                            Filler                          Filler                        Filler                       Filler


         Yield (pounds/acre)                                              7,580                        7,812
         Beginning Stocks                                                  12.0                         10.1                        10.7                          13.2
         Production                                                        59.8                         68.6                        55.5                          57.5
           Supply, Total 7/                                                73.1                         81.2                        69.2                          73.2
         Domestic & Residual 3/                                            29.4                         33.0                        32.0                          32.0
         Exports 8/                                                        33.6                         35.0                        30.0                          32.0
           Use, Total                                                      63.0                         68.0                        62.0                          64.0
         Ending Stocks                                                     10.1                         13.2                         7.2                           9.2
         Avg. Farm Price ($/cwt) 6/                                       18.80                        15.70               17.25 - 18.25                 15.50 - 16.50
Filler                                                                            Filler                          Filler                        Filler                       Filler


   Note: Totals may not add due to rounding. 1/ Marketing year beginning August 1. 2/ Includes the following quantities of broken kernel rice (type undetermined) not
   included in estimates of beginning stocks by type (in mil. cwt): 2010/11-1.5; 2011/12-2.7; 2012/13-2.7. 3/ Residual includes unreported use, processing losses, and
   estimating errors. Use by type may not add to total rice use because of the difference in brokens between beginning and ending stocks. 4/ Includes rough rice and
   milled rice exports. Milled rice exports are converted to an equivalent rough basis. 5/ Expressed as a percent, i.e., the total quantity of whole kernel and broken rice
   produced divided by the quantity of rough rice milled. Data supplied by the USA Rice Federation. The 2012/13 milling yield is calculated using the previous five-
   year average-- 2007/08-2011/12. 6/ Marketing-year weighted average price received by farmers. 7/ Includes imports. 8/ Exports by type of rice are estimated. * For
   June-- Planted acres reported in March 30, 2012 "Prospective Plantings". Harvested acres are estimated using the average harvested-to-planted ratios by rice class,
   2007-2011. For July-- Planted and harvested area reported in June 29, 2012 "Acreage" report. For June and July: projected yield is based on linear trend analysis
   by rice class for the period 1990/91 to 2011/12.
July 2012
                                                                                  WASDE - 508 - 15

                                          U.S. Soybeans and Products Supply and Use (Domestic Measure) 1/
                                                               2010/11                 2011/12 Est.                    2012/13 Proj.                 2012/13 Proj.
     SOYBEANS
                                                                                                                                Jun                            Jul
Filler                                                                   Filler                         Filler                            Filler                       Filler


                                                                                                             Million Acres
Area Planted                                                       77.4                        75.0                            73.9 *                     76.1 **
Area Harvested                                                     76.6                        73.6                            73.0 *                     75.3 **
Filler


                                                                                                             Bushels
Yield per Harvested Acre                                           43.5                        41.5                            43.9 *                     40.5 **
                                                                                                             Million Bushels
Beginning Stocks                                                    151                         215                              175                           170
Production                                                        3,329                       3,056                            3,205                         3,050
Imports                                                              14                          15                               15                            15
  Supply, Total                                                   3,495                       3,286                            3,395                         3,235
Crushings                                                         1,648                       1,675                            1,645                         1,610
Exports                                                           1,501                       1,340                            1,485                         1,370
Seed                                                                 87                          88                               89                            89
Residual                                                             43                          13                               36                            35
  Use, Total                                                      3,280                       3,116                            3,255                         3,105
Ending Stocks                                                       215                         170                              140                           130
Avg. Farm Price ($/bu) 2/                                         11.30                       12.40                    12.00 - 14.00                 13.00 - 15.00
Total


                                                                       11/2010                    .Est 12/2011                     .Proj 13/2012                .Proj 13/2012


     SOYBEAN OIL                                                                                                                           June                          July


Filler                                                                   Filler                         Filler                            Filler                       Filler


                                                                                                    Million Pounds
Beginning Stocks                                                 3,406                        2,425                  2,590                                   2,660
Production 3/                                                   18,888                       19,450                18,800                                  18,400
Imports                                                            159                          185                    195                                     195
  Supply, Total                                                 22,453                       22,060                21,585                                  21,255
Domestic Disappearance                                          16,795                       18,100                18,200                                  18,000
Exports                                                          3,233                        1,300                  1,250                                   1,250
   Use, Total                                                   20,028                       19,400                19,450                                  19,250
Ending stocks                                                    2,425                        2,660                  2,135                                   2,005
Avg. Farm Price (c/lb) 2/                                        53.20                        51.75          52.50 - 56.50                           52.50 - 56.50
Total


                                                                       11/2010                    .Est 12/2011                     .Proj 13/2012                .Proj 13/2012


     SOYBEAN MEAL                                                                                                                          June                          July


Filler                                                                       1                              2                                 3                            4


                                                                                     Thousand Short Tons
Beginning Stocks                                                   302                          350                  300                                       300
Production 3/                                                   39,251                      40,500                39,135                                    38,335
Imports                                                            179                          200                  165                                       165
  Supply, Total                                                 39,731                      41,050                39,600                                    38,800
Domestic Disappearance                                          30,277                      31,450                30,900                                    30,400
Exports                                                          9,104                        9,300                8,400                                     8,100
  Use, Total                                                    39,381                      40,750                39,300                                    38,500
Ending Stocks                                                      350                          300                  300                                       300
Avg. Farm Price ($/s.t.) 2/                                     345.52                      365.00       335.00 - 365.00                           365.00 - 395.00
Total


     Note: Reliability calculations at end of report. 1/ Marketing year beginning September 1 for soybeans; October 1 for soybean oil and soybean
     meal. 2/ Prices: soybeans, marketing year weighted average price received by farmers; oil, simple average of crude soybean oil, Decatur; meal,
     simple average of 48 percent, Decatur. 3/ Current month projection for 2011/12 based on October year crush of 1,690 million bushels. * Planted
     acres are reported in the March 30 Prospective Plantings. Harvested acres based on 5-year average planted-to-harvested ratio. Projected yields
     based on 1989-2010 trend analysis. **Planted and harvested acres from the June 29 Acreage report. Projected yield based on 1989 - 2010 trend
     analysis adjusted for weather and crop conditions through early July.
July 2012
                                                                             WASDE - 508 - 16

                                                             U.S. Sugar Supply and Use 1/
                                                           2010/11                     2011/12 Est.               2012/13 Proj.              2012/13 Proj.
                                                                                                                           Jun                         Jul
Filler                                                              Filler                            Filler                  Filler                       Filler


                                                                                 1,000 Short Tons,Raw Value
Beginning Stocks                                             1,498                           1,472                       1,825                      1,809
Production 2/                                                7,831                           8,298                       8,575                      8,750
  Beet Sugar                                                 4,659                           4,750                       5,045                      5,105
  Cane Sugar                                                 3,172                           3,548                       3,530                      3,645
    Florida                                                  1,433                           1,828                       1,800                      1,890
    Hawaii                                                     182                             170                         180                        180
    Louisiana                                                1,411                           1,400                       1,400                      1,425
    Texas                                                      146                             150                         150                        150
Imports                                                      3,738                           3,799                       3,047                      3,074
  TRQ 3/                                                     1,721                           2,100                       1,283                      1,283
  Other Program 4/                                             291                             550                         450                        450
Other 5/                                                     1,726                           1,149                       1,314                      1,341
  Mexico                                                     1,708                           1,139                       1,304                      1,331
    Total Supply                                            13,067                         13,569                       13,446                     13,633

Exports                                                        248                                250                      250                        250
Deliveries                                                  11,347                             11,510                   11,635                     11,635
  Food 6/                                                   11,118                             11,300                   11,425                     11,425
  Other 7/                                                     229                                210                      210                        210
Miscellaneous                                                    0                                  0                        0                          0
     Total Use                                              11,595                             11,760                   11,885                     11,885
Ending Stocks                                                1,472                              1,809                    1,561                      1,748
Stocks to Use Ratio                                           12.7                               15.4                     13.1                       14.7
Total


     1/ Fiscal years beginning Oct 1. Historical data are from FSA "Sweetener Market Data" except imports (U.S. Customs Service,
     Census Bureau). 2/ Production projections for 2012/13 are based on June Acreage report and trend yields. 3/ For 2012/13,
     includes only U.S. commitments under current trade agreements, minus shortfall. The Secretary will establish the actual level of
     the TRQ at a later date. For 2011/12, shortfall (72). For 2012/13, shortfall (165). 4/ Includes sugar under the re-export and
     polyhydric alcohol programs. 5/ For 2010/11, other high-tier (18) and other (0). For 2011/12, other high-tier (10) and other (0).
     For 2012/13, other high-tier (10) and other (0). 6/Combines SMD deliveries for domestic human food use and SMD
     miscellaneous uses. 7/ Transfers to sugar-containing products for reexport, and for nonedible alcohol and feed.
                        Mexico Sugar Supply and Use and High Fructose Corn Syrup Imports 1/
                                     Beginning                                                                                                    Ending
                                        Stocks        Production                     Imports        Domestic 2/             Exports               Stocks

   Sugar                                                                     1,000 Metric Tons, Actual Weight
   2011/12 Est.         Jun                  760            5,025                         382                  4,383                   984            800
   2011/12 Est.         Jul                  760            5,048                         382                  4,383                   984            823

   2012/13 Proj.        Jun                  800            5,300                         181                  4,360           1,126                  795
   2012/13 Proj.        Jul                  823            5,300                         181                  4,360           1,149                  795

     1/ HFCS imports by Mexico (metric tons, dry basis): Oct-Sep 2010/11 = 1,192,057; Oct-May 2010/11 = 756,958; Oct-May
     2011/12 = 831,902. Footnote source: Comite Nacional para el Desarollo Sustentable de la Cana de Azucar. 2/Includes domestic
     consumption, Mexico's products export program (IMMEX), and any residual statistical discrepancies.
July 2012
                                                                     WASDE - 508 - 17

                                                               U.S. Cotton Supply and Use 1/
                                             2010/011              2011/012 Est.            2012/013 Proj.          2012/013 Proj.
                                                                                                        Jun                    Jul
Filler                                                Filler                    Filler                     Filler                Filler


Area                                                                                 Million Acres
  Planted                                        10.97                     14.74                     13.16 *             12.64 **
  Harvested                                      10.70                      9.46                     10.50 *             10.40 **
Filler


                                                                               Pounds
Yield per Harvested Acre                          812                       790                       777 *                785 **
                                                                      Million 480 Pound Bales
Beginning Stocks 2/                               2.95                      2.60                       3.20                   3.30
Production                                       18.10                     15.57                     17.00                  17.00
Imports                                           0.01                      0.02                       0.01                   0.01
  Supply, Total                                  21.06                     18.19                     20.21                  20.31
Domestic Use                                      3.90                      3.30                       3.50                   3.40
Exports, Total                                   14.38                     11.60                     11.80                  12.10
  Use, Total                                     18.28                     14.90                     15.30                  15.50
Unaccounted 3/                                    0.18                     -0.01                       0.01                   0.01
Ending Stocks                                     2.60                      3.30                       4.90                   4.80
Avg. Farm Price 4/                                81.5                      91.0                60.0 - 80.0            60.0 - 80.0
Total


     Note: Reliability calculations at end of report. 1/ Upland and extra-long staple; marketing year beginning August 1.
     Totals may not add due to rounding. 2/ Based on Bureau of Census data for 2010/11; estimated thereafter. 3/ Reflects
     the difference between the previous season's supply less total use and ending stocks. 4/ Cents per pound for upland
     cotton. *Planted area as reported in March 30 "Prospective Plantings." Projected harvested area based on 2009/10
     through 2011/12 average abandonment, weighted by region and adjusted to reflect drought on the Texas High Plains.
     Projected yield/harvested acres based on 2009/10 through 2011/12 average yield, weighted by region. **Planted area
     as reported in June 29 "Acreage." Projected harvested area and yield based on 2009/10 through 2011/12 averages,
     weighted by region. Harvested area is further adjusted to include estimated abandonment of 30 percent in the
     Southwest.
July 2012
                                                    WASDE - 508 - 18


                                           World Wheat Supply and Use 1/
                                               (Million Metric Tons)
                             Beginning                                     Domestic        Domestic                         Ending
2010/11                         Stocks      Production        Imports          Feed         Total 2/        Exports          Stocks
World 3/                        200.55         651.14          131.65        116.33          654.46          132.43          197.23
United States                    26.55          60.06            2.64          3.59           30.71           35.08           23.47
Total Foreign                   174.00         591.08          129.01        112.74          623.75           97.36          173.77
  Major Exporters 4/             31.92         202.86            5.31         58.44          141.76           67.63           30.68
     Argentina                    2.34          16.10            0.01          0.10            5.95            9.49            3.01
     Australia                    5.59          27.89            0.12          3.00            6.13           18.66            8.82
     Canada                       7.83          23.17            0.44          2.84            7.69           16.58            7.18
     EU-27 5/                    16.16         135.70            4.73         52.50          122.00           22.91           11.68
  Major Importers 6/             85.21         184.80           70.70         22.36          243.79            8.14           88.79
     Brazil                       2.60            5.90           6.70          0.20           10.80            2.54            1.86
     China                       54.43         115.18            0.93         13.00          110.50            0.94           59.09
     Sel. Mideast 7/              8.74          19.64           13.57          2.52           33.00            1.29            7.66
     N. Africa 8/                10.95          15.93           24.18          2.38           39.23            0.36           11.47
     Pakistan                     3.56          23.90            0.20          0.40           23.00            1.35            3.31
     Southeast Asia 9/            3.12            0.00          15.80          2.82           14.42            0.55            3.95
  Selected Other                                                                                                               0.00
     India                        16.12          80.80           0.27           2.90            81.76           0.07          15.36
     FSU-12                       25.84          81.06           5.66          23.73            75.04          13.88          23.64
       Russia                     14.72          41.51           0.09          16.00            38.60           3.98          13.74
       Kazakhstan                  4.30           9.64           0.01           1.90             6.20           4.86           2.88
       Ukraine                     2.36          16.84           0.04           2.80            11.60           4.30           3.34
                          Beginning                                      Domestic       Domestic                        Ending
2011/12 Est.                Stocks        Production       Imports         Feed          /Total 2        Exports        Stocks
World 3/                         197.23         694.69         144.78         147.16          694.74          150.40         197.18
United States                     23.47          54.41           3.13           4.59            32.27          28.53          20.21
Total Foreign                    173.77         640.27         141.65         142.57          662.48          121.87         176.97
  Major Exporters 4/              30.68         206.64           8.01          66.60          149.83           67.30          28.21
     Argentina                     3.01          14.50           0.01           0.10             5.95          10.80           0.76
     Australia                     8.82          29.50           0.10           3.50             6.73          23.00           8.70
     Canada                        7.18          25.26           0.40           5.50            10.40          17.30           5.14
     EU-27 5/                     11.68         137.38           7.50          57.50          126.75           16.20          13.61
  Major Importers 6/              88.79         188.41          78.10          36.71          260.58            7.21          87.51
     Brazil                        1.86           5.80           7.30           0.50            11.20           2.00           1.76
     China                        59.09         117.92           3.20          22.00          120.50            1.00          58.71
     Sel. Mideast 7/               7.66          17.62          15.60           3.67            33.67           1.11           6.10
     N. Africa 8/                 11.47          18.43          23.80           3.30            41.30           0.40          12.00
     Pakistan                      3.31          24.20           0.20           0.40            23.10           1.15           3.46
     Southeast Asia 9/             3.95           0.00          16.50           4.29            16.26           0.55           3.64
  Selected Other                                                                                                               0.00
     India                        15.36          86.87           0.03           3.10            81.56           0.75          19.95
     FSU-12                       23.64         114.42           7.44          29.43            81.71          38.11          25.68
       Russia                     13.74          56.23           0.10          16.00            38.50          21.30          10.27
       Kazakhstan                  2.88          22.73           0.01           4.00             9.00          11.00           5.63
       Ukraine                     3.34          22.12           0.10           6.10            14.95           5.00           5.61
1/ Aggregate of local marketing years. 2/ Total foreign and world use adjusted to reflect the differences in world imports and
exports. 3/ World imports and exports may not balance due to differences in marketing years, grain in transit, and reporting
discrepancies in some countries. 4/ Argentina, Australia, Canada, and the EU-27. 5/ Trade excludes intra-trade. 6/ Brazil, China,
Japan, Mexico, N. Africa, Pakistan, selected Middle East, and Southeast Asia. 7/ Lebanon, Iraq, Iran, Israel, Jordan, Kuwait,
Saudi Arabia, Yemen, United Arab Emirates, and Oman. 8/ Algeria, Egypt, Libya, Morocco, and Tunisia. 9/ Indonesia,
Malaysia, Philippines, Thailand, and Vietnam.
July 2012
                                                       WASDE - 508 - 19

                                        World Wheat Supply and Use 1/ (Cont'd.)
                                                (Million Metric Tons)
                                      Beginning                                Domestic      Domestic                     Ending
2012/13 Proj.                            Stocks    Production      Imports        Feed        Total 2/      Exports       Stocks


World 3/                  Jun            195.56        672.06       135.29        131.67       681.87        135.42       185.76
                          Jul            197.18        665.33       134.72        130.33       680.06        134.71       182.44
United States             Jun             19.82         60.80         3.27          5.99        33.69         31.30        18.89
                          Jul             20.21         60.53         3.27          5.44        33.29         32.66        18.07
Total Foreign             Jun            175.75        611.26       132.03        125.69       648.18        104.13       166.86
                          Jul            176.97        604.80       131.45        124.89       646.78        102.05       164.38
  Major Exporters 4/      Jun             28.31        196.01         6.01         60.30       144.40         59.70        26.22
                          Jul             28.21        197.74         6.01         60.30       144.34         61.20        26.42
    Argentina             Jun              1.46         12.00         0.01          0.10         6.00          6.20         1.27
                          Jul              0.76         12.00         0.01          0.10         6.00          6.20         0.57
    Australia             Jun              8.10         26.00         0.10          4.00         7.30         20.50         6.40
                          Jul              8.70         26.00         0.10          3.50         6.74         20.50         7.56
    Canada                Jun              5.14         27.00         0.40          2.70         7.85         18.50         6.19
                          Jul              5.14         26.60         0.40          2.70         7.85         18.50         5.79
    EU-27 5/              Jun             13.61        131.01         5.50         53.50       123.25         14.50        12.36
                          Jul             13.61        133.14         5.50         54.00       123.75         16.00        12.50
  Major Importers 6/      Jun             86.51        186.42        73.00         31.01       257.69          4.20        84.04
                          Jul             87.51        184.42        73.00         31.06       257.84          4.12        82.96
    Brazil                Jun              1.76          5.00         6.70          0.20        11.00          0.50         1.96
                          Jul              1.76          5.00         6.70          0.20        11.00          0.50         1.96
    China                 Jun             57.99        120.00         2.50         22.00       122.00          1.00        57.49
                          Jul             58.71        118.00         2.00         22.00       122.00          1.00        55.71
    Sel. Mideast 7/       Jun              6.05         17.59        15.20          1.92        31.73          0.52         6.60
                          Jul              6.10         17.59        15.80          1.92        31.93          0.52         7.05
    N. Africa 8/          Jun             11.77         16.78        23.00          2.40        40.90          0.40        10.25
                          Jul             12.00         16.78        23.10          2.45        41.05          0.33        10.50
    Pakistan              Jun              3.46         23.00         0.20          0.40        23.20          0.30         3.16
                          Jul              3.46         23.00         0.20          0.40        23.20          0.30         3.16
    Southeast Asia 9/     Jun              3.64          0.00        15.40          2.99        15.57          0.58         2.90
                          Jul              3.64          0.00        15.20          2.99        15.37          0.58         2.90
  Selected Other
    India                 Jun             19.95         91.00          0.00         3.60         85.45         2.50        23.00
                          Jul             19.95         91.00          0.00         3.60         85.45         4.50        21.00
    FSU-12                Jun             25.78         94.76          6.61        25.18         77.76        29.11        20.29
                          Jul             25.68         88.56          6.16        24.13         76.26        23.61        20.54
       Russia             Jun             10.67         53.00          0.20        15.50         37.90        16.00         9.97
                          Jul             10.27         49.00          0.20        15.50         37.90        12.00         9.57
       Kazakhstan         Jun              5.63         15.00          0.01         3.50          8.50         8.50         3.64
                          Jul              5.63         13.00          0.01         2.50          7.50         7.00         4.14
       Ukraine            Jun              5.61         13.00          0.10         2.80         11.70         4.00         3.01
                          Jul              5.61         13.00          0.10         2.80         11.70         4.00         3.01
1/ Aggregate of local marketing years. 2/ Total foreign and world use adjusted to reflect the differences in world imports and
exports. 3/ World imports and exports may not balance due to differences in marketing years, grain in transit, and reporting
discrepancies in some countries. 4/ Argentina, Australia, Canada, and the EU-27. 5/ Trade excludes intra-trade. 6/ Brazil, China,
Japan, Mexico, N. Africa, Pakistan, selected Middle East, and Southeast Asia. 7/ Lebanon, Iraq, Iran, Israel, Jordan, Kuwait,
Saudi Arabia, Yemen, United Arab Emirates, and Oman. 8/ Algeria, Egypt, Libya, Morocco, and Tunisia. 9/ Indonesia,
Malaysia, Philippines, Thailand, and Vietnam.
July 2012
                                                               WASDE - 508 - 20

                                           World Coarse Grain Supply and Use 1/
                                                  (Million Metric Tons)
                                  Beginning                                                    Domestic          Domestic                              Ending
2010/11                              Stocks              Production            Imports            Feed            Total 2/           Exports           Stocks

World 3/                               195.58              1,096.61             115.98           655.06           1,129.86            116.43            162.33
United States                           48.13                330.24               2.52           127.78             297.97             50.63             32.29
Total Foreign                          147.44                766.38             113.46           527.28             831.89             65.80            130.04
  Major Exporters 4/                    15.17                 77.00               1.61            32.61              50.49             32.40             10.90
     Argentina                           1.42                 31.66               0.01             8.09              11.38             19.67              2.03
     Australia                           2.73                 11.76               0.00             5.31               6.98              5.77              1.74
     Canada                              5.65                 22.26               1.02            14.21              20.91              4.48              3.54
  Major Importers 5/                    48.66                222.18              87.15           235.68             313.45              6.71             37.83
     EU-27 5/                           25.85                140.59               8.48           114.29             152.00              6.17             16.75
     Japan                               1.31                  0.17              18.59            14.06              18.88              0.00              1.19
     Mexico                              1.94                 29.26              10.74            22.79              39.34              0.09              2.52
     N. Afr & Mideast 7/                12.11                 28.44              21.55            43.33              51.31              0.15             10.65
     Saudi Arabia                        2.45                  0.46               7.44             8.43               8.70              0.00              1.65
     Southeast Asia 8/                   2.82                 23.07               7.83            22.46              30.36              0.31              3.05
     South Korea                         1.67                  0.16               8.17             6.11               8.36              0.00              1.64
  Selected Other                                                                                                                                          0.00
    Brazil                              10.29                 60.38               1.12            45.06              52.73              8.42             10.64
    China                               52.40                183.40               2.70           128.75             188.18              0.19             50.13
    FSU-12                               7.37                 47.57               1.20            28.52              41.92              8.72              5.51
      Russia                             3.22                 16.42               0.67            10.46              18.13              0.31              1.88
      Ukraine                            2.21                 21.44               0.08            10.23              13.74              7.84              2.14
2011/12 Est.                                 Beginning
                                                Stocks            Production         Imports
                                                                                                      Domestic
                                                                                                         Feed
                                                                                                                         Domestic
                                                                                                                          /Total 2         Exports
                                                                                                                                                             Ending
                                                                                                                                                             Stocks


World 3/                               162.33              1,145.68             118.97           658.41           1,145.25            125.34            162.76
United States                           32.29                323.70               2.66           119.71             290.79             42.11             25.74
Total Foreign                          130.04                821.98             116.31           538.69             854.46             83.23            137.02
  Major Exporters 4/                    10.90                 76.48               1.09            31.45              49.60             28.74             10.13
     Argentina                           2.03                 29.41               0.02             8.10              11.52             18.01              1.93
     Australia                           1.74                 13.23               0.00             5.27               6.94              5.88              2.15
     Canada                              3.54                 21.87               0.97            13.09              19.94              3.34              3.10
  Major Importers 5/                    37.83                225.89              86.09           230.53             308.79              6.86             34.16
     EU-27 5/                           16.75                145.96               6.91           111.55             150.01              6.31             13.30
     Japan                               1.19                  0.17              17.84            13.25              18.07              0.00              1.13
     Mexico                              2.52                 25.80              11.78            21.60              38.34              0.01              1.75
     N. Afr & Mideast 7/                10.65                 28.01              22.25            43.52              50.83              0.21              9.86
     Saudi Arabia                        1.65                  0.45               9.51             8.73               9.00              0.00              2.60
     Southeast Asia 8/                   3.05                 25.24               6.41            22.65              30.76              0.34              3.61
     South Korea                         1.64                  0.21               7.06             5.14               7.39              0.00              1.52
  Selected Other                                                                                                                                          0.00
    Brazil                               10.64          72.83             1.16           48.55           57.25         14.01            13.37
    China                                50.13         199.66             7.06          131.85         196.56            0.19           60.11
    FSU-12                                5.51          78.96             0.83           39.10           55.18         23.91             6.21
       Russia                             1.88          32.80             0.40           17.88           27.58           5.86            1.64
       Ukraine                            2.14          33.34             0.08           12.00           15.85         16.81             2.90
1/ Aggregate of local marketing years. Coarse grains include corn, sorghum, barley, oats, rye, millet, and mixed grains (for U.S. excludes
millet and mixed grains). 2/ Total foreign and world use adjusted to reflect the differences in world imports and exports. 3/ World imports
and exports may not balance due to differences in marketing years, grain in transit, and reporting discrepancies in some countries. 4/
Argentina, Australia, Canada, and South Africa. 5/ The EU-27, Mexico, Japan, selected North Africa and Middle East, South Korea,
Southeast Asia, and Taiwan. 6/ Trade excludes intra-trade. 7/ Algeria, Egypt, Iran, Israel, Jordan, Libya, Morocco, Syria, Tunisia, and
Turkey. 8/ Indonesia, Malaysia, Philippines, Thailand, and Vietnam.
July 2012
                                                             WASDE - 508 - 21

                                        World Coarse Grain Supply and Use 1/ (Cont'd.)
                                                    (Million Metric Tons)
                                       Beginning                                      Domestic        Domestic                         Ending
2012/13 Proj.                             Stocks      Production         Imports         Feed          Total 2/        Exports         Stocks

World 3/                 Jun               162.37        1,231.60         125.89          708.25        1,206.23         132.41         187.74
                         Jul               162.76        1,183.64         120.98          688.87        1,180.91         124.89         165.49
United States            Jun                24.22          389.82           2.57          143.03          313.35          52.09          51.18
                         Jul                25.74          343.95           2.87          127.06          294.70          44.46          33.39
Total Foreign            Jun               138.15          841.78         123.32          565.22          892.88          80.33         136.57
                         Jul               137.02          839.69         118.12          561.82          886.20          80.43         132.10
  Major Exporters 4/     Jun                10.11           87.03           0.69           34.66           54.00          33.20          10.63
                         Jul                10.13           86.66           0.69           34.36           53.59          33.70          10.20
     Argentina           Jun                 1.93           35.65           0.01            8.54           12.75          22.41           2.43
                         Jul                 1.93           35.65           0.01            8.54           12.75          22.61           2.23
     Australia           Jun                 2.10           12.58           0.00            5.99            7.66           5.13           1.89
                         Jul                 2.15           12.58           0.00            5.69            7.36           5.43           1.94
     Canada              Jun                 3.10           25.35           0.57           14.99           21.99           3.65           3.38
                         Jul                 3.10           24.98           0.57           14.98           21.87           3.65           3.13
  Major Importers 5/     Jun                34.26          230.46          90.71          239.98          318.57           5.05          31.82
                         Jul                34.16          231.78          87.21          238.78          317.37           5.05          30.74
     EU-27 5/            Jun                13.40          148.24           7.56          114.18          152.89           4.58          11.73
                         Jul                13.30          149.56           5.56          114.18          152.89           4.58          10.95
     Japan               Jun                 1.13            0.18          18.91           14.30           19.12           0.00           1.11
                         Jul                 1.13            0.18          18.41           13.80           18.62           0.00           1.11
     Mexico              Jun                 1.75           28.48          12.53           23.17           40.14           0.03           2.58
                         Jul                 1.75           28.48          12.23           23.17           40.14           0.03           2.28
     N. Afr & Mideast 7/ Jun                 9.86           27.20          22.54           43.62           50.79           0.21           8.60
                         Jul                 9.86           27.20          22.34           43.42           50.59           0.21           8.60
     Saudi Arabia        Jun                 2.60            0.45           9.11            9.33            9.60           0.00           2.55
                         Jul                 2.60            0.45           9.11            9.33            9.60           0.00           2.55
     Southeast Asia 8/   Jun                 3.61           25.65           7.07           24.66           32.76           0.24           3.33
                         Jul                 3.61           25.65           7.07           24.66           32.76           0.24           3.33
     South Korea         Jun                 1.52            0.21           8.56            6.54            8.79           0.00           1.50
                         Jul                 1.52            0.21           8.06            6.04            8.29           0.00           1.50
  Selected Other
    Brazil                 Jun               14.37          70.43            1.16          50.46           59.69          12.01          14.27
                           Jul               13.37          70.43            1.16          50.46           59.69          12.01          13.27
    China                  Jun               60.01         202.01            9.26         139.85          210.06           0.29          60.94
                           Jul               60.11         202.01            7.26         139.85          210.06           0.29          59.04
    FSU-12                 Jun                6.26          78.18            0.70          40.47           56.89          21.31           6.94
                           Jul                6.21          75.33            0.90          38.87           55.14          20.61           6.69
      Russia               Jun                1.69          32.90            0.25          19.20           28.90           3.81           2.13
                           Jul                1.64          31.75            0.45          18.60           28.15           3.61           2.08
      Ukraine              Jun                2.90          32.80            0.08          12.00           16.20          16.51           3.07
                           Jul                2.90          31.30            0.08          11.20           15.40          16.01           2.87
1/ Aggregate of local marketing years. Coarse grains include corn, sorghum, barley, oats, rye, millet, and mixed grains (for U.S. excludes
millet and mixed grains). 2/ Total foreign and world use adjusted to reflect the differences in world imports and exports. 3/ World imports and
exports may not balance due to differences in marketing years, grain in transit, and reporting discrepancies in some countries. 4/ Argentina,
Australia, Canada, and South Africa. 5/ The EU-27, Mexico, Japan, selected North Africa and Middle East, South Korea, Southeast Asia, and
Taiwan. 6/ Trade excludes intra-trade. 7/ Algeria, Egypt, Iran, Israel, Jordan, Libya, Morocco, Syria, Tunisia, and Turkey. 8/ Indonesia,
Malaysia, Philippines, Thailand, and Vietnam.
July 2012
                                                          WASDE - 508 - 22

                                             World Corn Supply and Use 1/
                                                 (Million Metric Tons)
                            Beginning                                         Domestic Domestic                           Ending
2010/11                        Stocks Production           Imports               Feed Total 2/        Exports             Stocks

World 3/                        144.07       829.12          92.62              501.05     848.87          91.46          124.31
United States                    43.38       316.17           0.70              121.74     285.01          46.60           28.64
Total Foreign                   100.69       512.95          91.91              379.31     563.87          44.87           95.67
  Major Exporters 4/              6.04        34.52           0.43               10.25      17.95          18.80            4.25
     Argentina                    0.87        23.60           0.01                5.30       7.30          16.35            0.83
     South Africa                 5.17        10.92           0.42                4.95      10.65           2.45            3.42
  Major Importers 5/             13.70       106.56          57.17              114.57     162.54           1.48           13.41
     Egypt                        1.49         6.50           5.80               10.10      12.50           0.01            1.28
     EU-27 6/                     5.21        55.93           7.36               47.50      62.50           1.08            4.92
     Japan                        0.68         0.00          15.65               11.20      15.70           0.00            0.63
     Mexico                       1.39        21.01           8.26               13.20      29.00           0.09            1.57
     Southeast Asia 7/            2.82        23.01           7.81               22.40      30.30           0.30            3.05
     South Korea                  1.62         0.07           8.11                6.07       8.21           0.00            1.58
  Selected Other                                                                                                            0.00
     Brazil                       9.99        57.40                    0.79      42.50      49.50                8.40      10.28
     Canada                       1.76        11.71                    0.95       6.67      11.43                1.71       1.28
     China                       51.30       177.25                    0.98     128.00     180.00                0.11      49.42
     FSU-12                       1.54        18.49                    0.33      11.37      13.26                5.21       1.89
       Ukraine                    0.67        11.92                    0.04       5.40       6.50                5.01       1.12


2011/12 Est.                     Beginning
                                  Stocks     Production      Imports
                                                                                Domestic
                                                                                 Feed
                                                                                           Domestic
                                                                                           /Total 2    Exports
                                                                                                                           Ending
                                                                                                                           Stocks


World 3/                        124.31       873.70            94.03            507.78     868.64        98.84            129.37
United States                    28.64       313.92             0.56            115.58     279.54        40.64             22.94
Total Foreign                    95.67       559.79            93.47            392.20     589.10        58.20            106.44
  Major Exporters 4/              4.25        32.50             0.04             10.55      18.40        14.50              3.88
     Argentina                    0.83        21.00             0.01              5.60       7.70        13.00              1.14
     South Africa                 3.42        11.50             0.03              4.95      10.70         1.50              2.74
  Major Importers 5/             13.41       114.44            54.40            116.90     165.13         3.45             13.67
     Egypt                        1.28         5.50             5.00              9.00      10.80         0.01              0.97
     EU-27 6/                     4.92        64.64             6.30             52.00      67.50         3.10              5.26
     Japan                        0.63         0.00            15.00             10.50      15.00         0.00              0.63
     Mexico                       1.57        19.00            10.50             13.70      29.70         0.01              1.36
     Southeast Asia 7/            3.05        25.19             6.40             22.60      30.70         0.33              3.60
     South Korea                  1.58         0.08             7.00              5.10       7.20         0.00              1.46
  Selected Other                                                                                                            0.00
     Brazil                         10.28     70.00                    0.80      46.00      54.00        14.00             13.08
     Canada                          1.28     10.70                    0.90       5.80      10.80         0.40              1.68
     China                          49.42    192.78                    5.00     131.00     188.00         0.10             59.10
     FSU-12                          1.89     33.69                    0.26      14.79      17.26        16.54              2.03
       Ukraine                       1.12     22.84                    0.05       7.50       8.80        14.00              1.21

1/ Aggregate of local marketing years. 2/ Total foreign and world use adjusted to reflect the differences in
world imports and exports. 3/ World imports and exports may not balance due to differences in marketing
years, grain in transit, and reporting discrepancies in some countries. 4/ Argentina and South Africa. 5/
Egypt, the EU-27, Mexico, Japan, South Korea, Taiwan, and Southeast Asia. 6/ Trade excludes intra-
trade. 7/ Indonesia, Malaysia, Philippines, Thailand, and Vietnam.
July 2012
                                                                    WASDE - 508 - 23


                                                  World Corn Supply and Use 1/ (Cont'd.)
                                                          (Million Metric Tons)
                                Beginning                                            Domestic        Domestic                          Ending
2012/13 Proj.                      Stocks Production                  Imports           Feed          Total 2/        Exports          Stocks

World 3/             Jun           129.19             949.93           100.32          553.31          923.39         105.32            155.74
                     Jul           129.37             905.23            95.75          535.95          900.51          98.30            134.09
United States        Jun            21.62             375.68             0.38          138.44          301.64          48.26             47.78
                     Jul            22.94             329.45             0.76          121.93          282.46          40.64             30.05
Total Foreign        Jun           107.57             574.25            99.94          414.88          621.75          57.06            107.96
                     Jul           106.44             575.77            94.99          414.03          618.05          57.66            104.04
  Major Exporters 4/ Jun             3.91              38.00             0.04           10.90           19.70          18.00              4.24
                     Jul             3.88              38.00             0.04           10.90           19.70          18.00              4.22
     Argentina       Jun             1.14              25.00             0.01            5.80            8.60          16.00              1.55
                     Jul             1.14              25.00             0.01            5.80            8.60          16.00              1.55
     South Africa    Jun             2.77              13.00             0.03            5.10           11.10           2.00              2.69
                     Jul             2.74              13.00             0.03            5.10           11.10           2.00              2.67
  Major Importers 5/ Jun            13.77             116.68            57.35          122.70          171.83           2.27             13.71
                     Jul            13.67             118.00            54.05          121.70          170.83           2.27             12.63
     Egypt           Jun             0.97               5.80             5.20            9.00           11.00           0.01              0.96
                     Jul             0.97               5.80             5.20            9.00           11.00           0.01              0.96
                                         filler            filler           filler          filler           filler         filler           filler


    EU-27 6/          Jun             5.36             64.15             7.00           53.50           69.50            2.00             5.01
                      Jul             5.26             65.47             5.00           53.50           69.50            2.00             4.23
    Japan             Jun             0.63              0.00            16.00           11.50           16.00            0.00             0.63
                      Jul             0.63              0.00            15.50           11.00           15.50            0.00             0.63
    Mexico            Jun             1.36             21.00             9.30           13.50           29.70            0.03             1.93
                      Jul             1.36             21.00             9.00           13.50           29.70            0.03             1.63
    Southeast Asia 7/ Jun             3.60             25.60             7.05           24.60           32.70            0.23             3.32
                      Jul             3.60             25.60             7.05           24.60           32.70            0.23             3.32
    South Korea       Jun             1.46              0.08             8.50            6.50            8.60            0.00             1.44
                      Jul             1.46              0.08             8.00            6.00            8.10            0.00             1.44
  Selected Other
    Brazil            Jun            14.08             67.00             0.80           47.50           56.00          12.00             13.88
                      Jul            13.08             67.00             0.80           47.50           56.00          12.00             12.88
    Canada            Jun             1.68             12.60             0.50            7.40           12.60           0.50              1.68
                      Jul             1.68             13.00             0.50            7.60           12.80           0.80              1.58
    China             Jun            59.00            195.00             7.00          139.00          201.00           0.20             59.80
                      Jul            59.10            195.00             5.00          139.00          201.00           0.20             57.90
    FSU-12            Jun             2.03             36.26             0.24           16.39           19.56          15.94              3.03
                      Jul             2.03             36.26             0.24           16.39           19.56          15.94              3.03
       Ukraine        Jun             1.21             24.00             0.05            7.50            9.30          14.00              1.96
                      Jul             1.21             24.00             0.05            7.50            9.30          14.00              1.96


1/ Aggregate of local marketing years. 2/ Total foreign and world use adjusted to reflect the differences in world
imports and exports. 3/ World imports and exports may not balance due to differences in marketing years, grain in
transit, and reporting discrepancies in some countries. 4/ Argentina and South Africa. 5/ Egypt, the EU-27, Mexico,
Japan, South Korea, Taiwan, and Southeast Asia. 6/ Trade excludes intra-trade. 7/ Indonesia, Malaysia, Philippines,
Thailand, and Vietnam.
July 2012
                                                                                 WASDE - 508 - 24


                                                         World Rice Supply and Use (Milled Basis) 1/
                                                                    (Million Metric Tons)
                                   Beginning                Production                 Imports          Total /2           Exports           Ending
2010/11                               Stocks                                                           Domestic                              Stocks

World 3/                                 95.17                  449.37                   32.71            445.91             34.75             98.63
United States                             1.18                    7.59                    0.58              4.36              3.49              1.51
Total Foreign                            93.99                  441.77                   32.13            441.55             31.27             97.12
  Major Exporters 4/                     29.17                  147.61                    0.73            122.15             23.81             31.56
     India                               20.50                   95.98                    0.00             90.21              2.77             23.50
     Pakistan                             1.10                    5.00                    0.03              2.25              3.39              0.50
     Thailand                             6.10                   20.26                    0.20             10.30             10.65              5.62
     Vietnam                              1.47                   26.37                    0.50             19.40              7.00              1.94
  Major Importers 5/                     13.34                   62.09                   14.28             75.79              1.78             12.14
     Brazil                               0.55                    9.30                    0.63              8.20              1.48              0.80
     EU-27 6/                             1.12                    2.05                    1.39              3.24              0.26              1.06
     Indonesia                            6.58                   35.50                    3.10             39.00              0.00              6.18
     Nigeria                              0.49                    2.62                    2.40              5.03              0.00              0.47
     Philippines                          3.52                   10.54                    1.30             12.90              0.00              2.46
     Sel. Mideast 7/                      1.01                    1.62                    4.23              5.72              0.02              1.13
  Selected Other                                                                                                                                0.00
    Burma                                 0.86                   10.53                    0.00             10.10              0.78              0.51
    C. Amer & Carib 8/                    0.37                    1.64                    1.51              3.13              0.00              0.39
    China                                40.53                  137.00                    0.54            135.00              0.50             42.57
    Egypt                                 0.50                    3.10                    0.02              3.30              0.20              0.12
    Japan                                 2.69                    7.72                    0.68              8.20              0.20              2.69
    Mexico                                0.14                    0.15                    0.71              0.78              0.00              0.21
    South Korea                           1.51                    4.30                    0.41              5.18              0.00              1.03


2011/12 Est.                                 Beginning
                                                Stocks              Production               Imports
                                                                                                                Total /2
                                                                                                               Domestic          Exports
                                                                                                                                                   Ending
                                                                                                                                                   Stocks


World 3/                                 98.63                  463.94                   33.53            458.38             35.27            104.19
United States                             1.51                    5.87                    0.64              3.72              3.21              1.10
Total Foreign                            97.12                  458.07                   32.89            454.66             32.07            103.09
  Major Exporters 4/                     31.56                  157.10                    0.65            126.55             25.25             37.50
     India                               23.50                  103.40                    0.00             93.90              8.00             25.00
     Pakistan                             0.50                    6.50                    0.05              2.50              3.75              0.80
     Thailand                             5.62                   20.46                    0.20             10.40              6.50              9.38
     Vietnam                              1.94                   26.74                    0.40             19.75              7.00              2.33
  Major Importers 5/                     12.14                   61.58                   13.12             76.39              1.13              9.32
     Brazil                               0.80                    7.86                    0.70              8.13              0.85              0.38
     EU-27 6/                             1.06                    1.95                    1.55              3.30              0.25              1.01
     Indonesia                            6.18                   36.30                    1.25             39.30              0.00              4.43
     Nigeria                              0.47                    2.71                    2.50              5.20              0.00              0.48
     Philippines                          2.46                   10.64                    1.50             12.80              0.00              1.80
     Sel. Mideast 7/                      1.13                    1.67                    4.25              5.87              0.02              1.16
  Selected Other                                                                                                                                0.00
    Burma                                 0.51                   10.82                    0.00             10.14              0.60              0.58
    C. Amer & Carib 8/                    0.39                    1.71                    1.46              3.17              0.00              0.38
    China                                42.57                  140.70                    1.50            139.50              0.50             44.77
    Egypt                                 0.12                    4.25                    0.80              4.07              0.60              0.50
    Japan                                 2.69                    7.65                    0.70              8.05              0.20              2.79
    Mexico                                0.21                    0.12                    0.75              0.89              0.00              0.19
    South Korea                           1.03                    4.22                    0.60              4.98              0.00              0.88


1/ Aggregate of local marketing years. 2/ Total foreign and world use adjusted to reflect the differences in world imports and exports. Total
domestic includes both domestic use and unreported disappearance. 3/ World imports and exports may not balance due to differences in some
countries. 4/ India, Pakistan, Thailand, and Vietnam. 5/ Brazil, Indonesia, Hong Kong, Cote d'Ivoire, Nigeria, Philippines, selected Middle
East, and the EU-27. 6/ Trade excludes intra-trade. 7/ Selected Middle East includes Iran, Iraq, and Saudi Arabia. 8/ Central American and
Caribbean countries.
July 2012
                                                                 WASDE - 508 - 25


                                      World Rice Supply and Use (Milled Basis) 1/ (Cont'd.)
                                                     (Million Metric Tons)
                                     Beginning           Production        Imports         Total /2        Exports          Ending
2012/13 Proj.                           Stocks                                            Domestic                          Stocks

World 3/                    Jun           104.39             466.51          32.81           466.74          36.06           104.16
                            Jul           104.19             465.08          33.42           466.79          36.18           102.47
United States               Jun             0.94filler
                                                               5.83
                                                                  filler
                                                                              0.70
                                                                                 filler
                                                                                               3.88
                                                                                                  filler
                                                                                                              2.77
                                                                                                                 filler
                                                                                                                               0.81
                                                                                                                                  filler


                            Jul             1.10               6.09           0.68             4.01           2.93             0.92
Total Foreign               Jun           103.46filler
                                                             460.68
                                                                  filler
                                                                             32.11
                                                                                 filler
                                                                                             462.86
                                                                                                  filler
                                                                                                             33.29
                                                                                                                 filler
                                                                                                                             103.35
                                                                                                                                  filler


                            Jul           103.09             458.99          32.74           462.78          33.25           101.55
  Major Exporters 4/        Jun            37.42             156.85           0.70           129.30          26.00            39.67
                            Jul            37.50             154.73           0.70           129.30          26.00            37.63
     India                  Jun            25.00             102.50           0.00            96.00           7.00            24.50
                            Jul            25.00filler
                                                             100.00
                                                                  filler
                                                                              0.00
                                                                                 filler
                                                                                              96.00
                                                                                                  filler
                                                                                                              7.00
                                                                                                                 filler
                                                                                                                              22.00
                                                                                                                                  filler


     Pakistan               Jun             0.80               6.80           0.00             2.60           4.00             1.00
                            Jul             0.80               6.80           0.00             2.60           4.00             1.00
     Thailand               Jun             9.38              21.05           0.30            10.60           8.00            12.13
                            Jul             9.38              21.05           0.30            10.60           8.00            12.13
     Vietnam                Jun             2.24              26.50           0.40            20.10           7.00             2.04
                            Jul             2.33              26.88           0.40            20.10           7.00             2.50
  Major Importers 5/        Jun             9.77              63.34          13.11            77.25           1.19             7.79
                            Jul             9.32              63.34          13.11            76.95           1.19             7.64
     Brazil                 Jun             0.38filler
                                                               8.67
                                                                  filler
                                                                              0.61
                                                                                 filler
                                                                                               8.10
                                                                                                  filler
                                                                                                              0.90
                                                                                                                 filler
                                                                                                                               0.66
                                                                                                                                  filler


                            Jul             0.38               8.67           0.61             8.10           0.90             0.66
     EU-27 6/               Jun             1.01               1.89           1.55             3.30           0.24             0.91
                            Jul             1.01               1.89           1.55             3.30           0.24             0.91
     Indonesia              Jun             4.88              36.90           1.45            40.00           0.00             3.23
                            Jul             4.43              36.90           1.45            39.70           0.00             3.08
     Nigeria                Jun             0.48               2.85           2.30             5.15           0.00             0.48
                            Jul             0.48               2.85           2.30             5.15           0.00             0.48
     Philippines            Jun             1.80              10.80           1.50            12.85           0.00             1.25
                            Jul             1.80              10.80           1.50            12.85           0.00             1.25
     Sel. Mideast 7/        Jun             1.16               1.67           4.33             5.99           0.02             1.14
                            Jul             1.16               1.67           4.33             5.99           0.02             1.14
  Selected Other
     Burma              Jun                 0.58              11.00           0.00            10.63           0.75             0.20
                        Jul                 0.58              11.00           0.00            10.63           0.75             0.20
     C. Amer & Carib 8/ Jun                 0.38               1.69           1.48             3.14           0.00             0.40
                        Jul                 0.38               1.69           1.48             3.14           0.00             0.41
     China              Jun                44.77             141.00           1.00           141.00           0.60            45.17
                        Jul                44.77             141.00           1.50           141.50           0.60            45.17
     Egypt              Jun                 0.50               3.80           0.75             4.00           0.60             0.45
                        Jul                 0.50               4.50           0.75             4.30           0.60             0.85
     Japan              Jun                 2.79               7.36           0.70             7.97           0.20             2.67
                        Jul                 2.79               7.36           0.70             7.97           0.20             2.67
     Mexico             Jun                 0.19               0.13           0.80             0.91           0.00             0.20
                        Jul                 0.19               0.13           0.80             0.91           0.00             0.20
     South Korea        Jun                 0.88               4.20           0.40             4.80           0.00             0.68
                        Jul                 0.88               4.20           0.40             4.80           0.00             0.68


1/ Aggregate of local marketing years. 2/ Total foreign and world use adjusted to reflect the differences in world imports
and exports. Total domestic includes both domestic use and unreported disappearance. 3/ World imports and exports may
not balance due to differences in some countries. 4/ India, Pakistan, Thailand, and Vietnam. 5/ Brazil, Indonesia, Hong
Kong, Cote d'Ivoire, Nigeria, Philippines, selected Middle East, and the EU-27. 6/ Trade excludes intra-trade. 7/ Selected
Middle East includes Iran, Iraq, and Saudi Arabia. 8/ Central American and Caribbean countries.
July 2012
                                                                            WASDE - 508 - 26

                                                             World Cotton Supply and Use 1/
                                                               (Million 480-Pound Bales)
                                Beginning              Production           Imports         Domestic         Exports        Loss         Ending
2010/11                            Stocks                                                       Use                           /2         Stocks


World                                 47.82               116.40              35.92           114.65          36.66         -0.69         49.52
United States                          2.95                18.10               0.01             3.90          14.38          0.18          2.60
Total Foreign                         44.87                98.29              35.91           110.75          22.29         -0.88         46.92
 Major Exporters 4/                   19.32                52.25               1.93            30.37          18.70         -0.99         25.42
    Central Asia 5/                    2.16                 6.83               0.01             1.95           4.62          0.03          2.40
    Afr. Fr. Zone 6/                   0.59                 2.28                 3/             0.19           2.13          0.00          0.56
    S. Hemis 7/                        6.72                15.46               0.90             5.64           5.50         -0.28         12.21
       Australia                       0.75                 4.20                 3/             0.04           2.51         -0.15          2.55
       Brazil                          4.35                 9.00               0.70             4.30           2.00         -0.15          7.91
    India                              9.37                26.40               0.45            21.05           6.00         -0.75          9.92
 Major Importers 8/                   24.01                43.24              31.43            76.34           2.49          0.11         19.76
    Mexico                             0.63                 0.73               1.20             1.65           0.35          0.03          0.54
    China                             15.25                30.50              11.98            46.00           0.12          0.00         11.60
    EU-27 9/                           0.52                 1.15               1.07             1.07           1.05          0.05          0.56
    Turkey                             1.93                 2.11               3.35             5.60           0.15         -0.08          1.72
    Pakistan                           3.04                 8.64               1.70            10.00           0.63          0.03          2.73
    Indonesia                          0.44                 0.03               2.10             2.05           0.02          0.05          0.44
    Thailand                           0.29                   3/               1.75             1.70           0.00          0.03          0.32
    Bangladesh                         0.79                 0.06               3.70             3.70           0.00          0.01          0.84
    Vietnam                            0.38                 0.02               1.63             1.65           0.00          0.00          0.38


2011/12 Est.                               Beginning
                                              Stocks           Production         Imports
                                                                                                  Domestic
                                                                                                      Use         Exports
                                                                                                                                Loss
                                                                                                                                  /2
                                                                                                                                              Ending
                                                                                                                                              Stocks


World                                 49.52               122.71              43.55          106.59           43.40         -0.89         66.68
United States                          2.60                15.57               0.02            3.30           11.60         -0.01          3.30
Total Foreign                         46.92               107.14              43.53          103.29           31.80         -0.88         63.38
 Major Exporters 4/                   25.42                53.63               1.14           29.45           26.80         -0.99         24.93
    Central Asia 5/                    2.40                 6.84               0.02            2.10            4.15          0.03          3.00
    Afr. Fr. Zone 6/                   0.56                 3.05                 3/            0.19            2.24          0.00          1.18
    S. Hemis 7/                       12.21                15.59               0.22            5.32            9.99         -0.28         13.00
       Australia                       2.55                 4.90                 3/            0.04            4.20         -0.15          3.36
       Brazil                          7.91                 8.70               0.04            4.00            4.80         -0.15          8.00
    India                              9.92                26.50               0.60           20.50           10.00         -0.75          7.27
 Major Importers 8/                   19.76                50.33              39.68           69.99            3.23          0.11         36.44
    Mexico                             0.54                 1.24               1.00            1.65            0.35          0.03          0.75
    China                             11.60                33.50              23.25           41.00            0.03          0.00         27.33
    EU-27 9/                           0.56                 1.61               0.90            0.93            1.36          0.05          0.74
    Turkey                             1.72                 3.25               2.30            5.30            0.30         -0.08          1.75
    Pakistan                           2.73                10.60               1.20           10.25            1.10          0.03          3.16
    Indonesia                          0.44                 0.03               1.98            1.90            0.02          0.05          0.48
    Thailand                           0.32                   3/               1.28            1.33            0.00          0.03          0.25
    Bangladesh                         0.84                 0.08               3.15            3.20            0.00          0.01          0.86
    Vietnam                            0.38                 0.02               1.65            1.60            0.00          0.00          0.45

1/ Marketing year beginning August 1. Totals may not add exactly and trade may not balance due to rounding and other factors.
2/ Generally reflects cotton lost or destroyed in the marketing channel; for Australia, Brazil, China, and the United States, reflects
the difference between implicit stocks based on supply less total use and indicated ending stocks. 3/ Less than 5,000 bales. 4/
Includes Egypt and Syria in addition to the countries and regions listed. 5/ Azerbaijan, Kazakhstan, Kyrgyzstan, Tajikistan,
Turkmenistan, and Uzbekistan. 6/ Benin, Burkino Faso, Cameroon, Central African Republic, Chad, Cote d'Ivoire, Mali, Niger,
Senegal, and Togo. 7/ Argentina, Australia, Brazil, Paraguay, South Africa, Tanzania, and Zimbabwe. 8/ In addition to the
countries and regions listed, includes Hong Kong, Japan, Russia, South Korea, and Taiwan. 9/ Includes intra-EU trade.
July 2012
                                                                          WASDE - 508 - 27

                                                           World Cotton Supply and Use 1/
                                                             (Million 480-Pound Bales)
                                      Beginning         Production           Imports        Domestic        Exports        Loss           Ending
2012/13 Proj.                            Stocks                                                 Use                          /2           Stocks

World                  Jun                 67.32           115.29              36.97          109.01         36.95         -0.88            74.51
                       Jul                 66.68           113.81              37.39          108.98         37.39         -0.88            72.39
United States          Jun                  3.20            17.00               0.01            3.50         11.80          0.01             4.90
                       Jul                  3.30            17.00               0.01            3.40         12.10          0.01             4.80
Total Foreign          Jun                 64.12            98.29              36.97          105.51         25.15         -0.88            69.61
                       Jul                 63.38            96.81              37.39          105.58         25.29         -0.88            67.59
                                               filler            filler            filler          filler         filler       filler           filler


 Major Exporters 4/ Jun                    25.66            49.32               1.48           30.63         20.76         -0.99            26.06
                    Jul                    24.93            48.27               1.80           30.83         20.92         -0.99            24.23
  Central Asia 5/ Jun                       3.05             6.74               0.01            2.25          4.32          0.03             3.20
                    Jul                     3.00             6.74               0.01            2.25          4.57          0.03             2.90
  Afr. Fr. Zone 6/ Jun                      1.15             3.12                 3/            0.19          2.68          0.00             1.40
                    Jul                     1.18             3.12                 3/            0.19          2.78          0.00             1.32
  S. Hemis 7/       Jun                    13.20            13.21               0.27            5.60          9.36         -0.28            12.00
                    Jul                    13.00            13.21               0.27            5.54          9.49         -0.28            11.72
     Australia      Jun                     3.16             4.25                 3/            0.04          4.30         -0.15             3.22
                    Jul                     3.36             4.25                 3/            0.04          4.50         -0.15             3.22
     Brazil         Jun                     8.30             7.00               0.05            4.25          4.10         -0.15             7.15
                    Jul                     8.00             7.00               0.05            4.25          4.00         -0.15             6.95
  India             Jun                     7.77            25.00               0.70           21.25          4.00         -0.75             8.97
                    Jul                     7.27            24.00               1.00           21.50          3.70         -0.75             7.82
                                               filler            filler            filler          filler         filler       filler           filler


 Major Importers 8/ Jun                    36.38            45.87              32.76           71.00           2.59         0.11            41.31
                    Jul                    36.44            45.57              32.84           70.90           2.64         0.11            41.20
  Mexico            Jun                     0.75             1.03               1.20            1.75           0.40         0.03             0.80
                    Jul                     0.75             1.03               1.20            1.75           0.40         0.03             0.80
  China             Jun                    27.33            30.50              13.50           40.00           0.03         0.00            31.30
                    Jul                    27.33            30.50              13.50           39.50           0.03         0.00            31.80
  EU-27 9/          Jun                     0.74             1.45               0.90            0.91           1.39         0.05             0.73
                    Jul                     0.74             1.45               0.90            0.91           1.44         0.05             0.68
  Turkey            Jun                     1.75             2.75               3.00            5.60           0.20        -0.08             1.78
                    Jul                     1.75             2.75               3.00            5.60           0.20        -0.08             1.78
  Pakistan          Jun                     3.16            10.00               2.20           11.00           0.50         0.03             3.83
                    Jul                     3.16             9.70               2.20           11.25           0.50         0.03             3.28
  Indonesia         Jun                     0.48             0.03               2.10            2.05           0.02         0.05             0.49
                    Jul                     0.48             0.03               2.10            2.05           0.02         0.05             0.49
  Thailand          Jun                     0.25               3/               1.65            1.55           0.00         0.03             0.32
                    Jul                     0.25               3/               1.68            1.60           0.00         0.03             0.30
  Bangladesh        Jun                     0.86             0.09               3.60            3.60           0.00         0.01             0.94
                    Jul                     0.86             0.09               3.60            3.60           0.00         0.01             0.94
  Vietnam           Jun                     0.40             0.02               1.65            1.65           0.00         0.00             0.42
                    Jul                     0.45             0.02               1.70            1.75           0.00         0.00             0.42


1/ Marketing year beginning August 1. Totals may not add exactly and trade may not balance due to rounding and other factors.           2/
Generally reflects cotton lost or destroyed in the marketing channel; for Australia, Brazil, China, and the United States, reflects the
difference between implicit stocks based on supply less total use and indicated ending stocks. 3/ Less than 5,000 bales. 4/ Includes
Egypt and Syria in addition to the countries and regions listed. 5/ Azerbaijan, Kazakhstan, Kyrgyzstan, Tajikistan, Turkmenistan, and
Uzbekistan. 6/ Benin, Burkino Faso, Cameroon, Central African Republic, Chad, Cote d'Ivoire, Mali, Niger, Senegal, and Togo. 7/
Argentina, Australia, Brazil, Paraguay, South Africa, Tanzania, and Zimbabwe. 8/ In addition to the countries and regions listed,
includes Hong Kong, Japan, Russia, South Korea, and Taiwan. 9/ Includes intra-EU trade.
July 2012
                                                                                 WASDE - 508 - 28

                                                                     World Soybean Supply and Use 1/
                                                                          (Million Metric Tons)
                                    Beginning              Production     Imports    Domestic    Domestic                      Exports         Ending
2010/11                                Stocks                                            Crush       Total                                     Stocks

World 2/                                  60.57                264.69            88.81         221.15          251.31            92.65           70.13
United States                              4.11                 90.61             0.39          44.85           48.39            40.86            5.85
Total Foreign                             56.47                174.09            88.42         176.30          202.91            51.79           64.27
  Major Exporters 3/                      38.90                132.87             0.07          75.00           79.75            45.86           46.24
     Argentina                            22.28                 49.00             0.01          37.61           39.21             9.21           22.87
     Brazil                               16.29                 75.50             0.04          35.93           38.93            29.95           22.94
  Major Importers 4/                      14.27                 17.62            76.86          75.89           92.70             0.27           15.78
     China                                13.26                 15.10            52.34          55.00           65.95             0.19           14.56
     EU-27                                 0.54                  1.04            12.48          12.27           13.46             0.06            0.56
     Japan                                 0.24                  0.22             2.92           2.15            3.21             0.00            0.17
     Mexico                                0.05                  0.17             3.50           3.63            3.66             0.00            0.05


2011/12 Est.                                  Beginning
                                                 Stocks             Production       Imports
                                                                                                    Domestic
                                                                                                      Crush
                                                                                                                    Domestic
                                                                                                                       Total         Exports
                                                                                                                                                     Ending
                                                                                                                                                     Stocks


World 2/                                  70.13                235.88            90.11         223.87          253.42            90.18           52.51
United States                              5.85                 83.17             0.41          45.59           48.35            36.47            4.62
Total Foreign                             64.27                152.70            89.70         178.28          205.08            53.71           47.89
  Major Exporters 3/                      46.24                110.50             0.26          74.30           79.08            47.60           30.31
     Argentina                            22.87                 41.00             0.00          36.50           38.10             7.80           17.97
     Brazil                               22.94                 65.50             0.24          36.55           39.65            36.70           12.33
  Major Importers 4/                      15.78                 16.16            80.13          79.28           95.98             0.31           15.77
     China                                14.56                 13.50            57.50          59.30           70.30             0.25           15.01
     EU-27                                 0.56                  1.12            11.00          11.30           12.31             0.03            0.33
     Japan                                 0.17                  0.22             2.70           1.90            2.95             0.00            0.14
     Mexico                                0.05                  0.20             3.40           3.55            3.59             0.00            0.07

                                               Beginning            Production       Imports        Domestic        Domestic         Exports         Ending
                                                  Stocks                                              Crush            Total                         Stocks


2012/13 Proj.

World 2/               Jun                53.36                271.03            95.82         234.05          264.95            96.71           58.54
                       Jul                52.51                267.16            94.96         232.39          263.15            95.82           55.66
United States          Jun                 4.77                 87.23             0.41          44.77           48.18            40.42            3.80
                       Jul                 4.62                 83.01             0.41          43.82           47.21            37.29            3.54
Total Foreign          Jun                48.59                183.80            95.41         189.28          216.77            56.30           54.73
                       Jul                47.89                184.15            94.55         188.58          215.93            58.54           52.12
  Major Exporters 3/   Jun                31.16                140.80             0.07          79.10           84.08            49.40           38.55
                       Jul                30.31                140.80             0.28          79.10           84.08            51.30           36.01
    Argentina          Jun                18.47                 55.00             0.01          39.80           41.45            10.10           21.93
                       Jul                17.97                 55.00             0.01          39.80           41.45            11.10           20.43
    Brazil             Jun                12.68                 78.00             0.04          36.80           40.00            34.20           16.52
                       Jul                12.33                 78.00             0.25          36.80           40.00            35.10           15.48
  Major Importers 4/   Jun                15.61                 15.39            84.50          83.63          100.68             0.26           14.56
                       Jul                15.77                 15.39            84.25          83.53          100.54             0.31           14.56
    China              Jun                14.76                 12.60            61.00          63.40           74.52             0.20           13.64
                       Jul                15.01                 12.60            61.00          63.40           74.52             0.25           13.84
    EU-27              Jun                 0.33                  1.20            11.00          11.18           12.18             0.03            0.32
                       Jul                 0.33                  1.20            11.00          11.18           12.18             0.03            0.32
    Japan              Jun                 0.14                  0.22             2.80           1.90            2.96             0.00            0.20
                       Jul                 0.14                  0.22             2.80           1.90            2.96             0.00            0.20
    Mexico             Jun                 0.07                  0.20             3.50           3.67            3.70             0.00            0.07
                       Jul                 0.07                  0.20             3.40           3.62            3.65             0.00            0.02

1/ Data based on local marketing years except Argentina and Brazil which are adjusted to an October-September year. 2/ World imports and
exports may not balance due to differences in local marketing years and to time lags between reported exports and imports. Therefore, world
supply may not equal world use. 3/ Argentina, Brazil and Paraguay. 4/ China, EU-27, Japan, Mexico, and Southeast Asia (includes Indonesia,
Malaysia, Philippines, Vietnam, and Thailand).
July 2012
                                                                                     WASDE - 508 - 29

                                                               World Soybean Meal Supply and Use 1/
                                                                       (Million Metric Tons)
                                       Beginning              Production               Imports          Domestic          Exports           Ending
2010/11                                   Stocks                                                           Total                            Stocks


World 2/                                     6.42                174.54                  56.40            170.20           58.79               8.38
United States                                0.27                 35.61                   0.16             27.47            8.26               0.32
Total Foreign                                6.15                138.93                  56.24            142.73           50.53               8.06
  Major Exporters 3/                         4.10                 64.82                   0.07             17.22           46.30               5.46
     Argentina                               1.79                 29.31                   0.00              0.72           27.62               2.76
     Brazil                                  2.07                 27.85                   0.06             13.50           13.99               2.49
     India                                   0.25                  7.66                   0.01              3.00            4.70               0.22
  Major Importers 4/                         1.16                 13.57                  34.85             47.23            0.65               1.70
     EU-27                                   0.50                  9.68                  21.71             30.72            0.61               0.55
     Southeast Asia 5/                       0.39                  2.24                  10.93             12.66            0.04               0.86

2011/12 Est.                                     Beginning
                                                    Stocks             Production            Imports
                                                                                                               Domestic
                                                                                                                  Total         Exports
                                                                                                                                                  Ending
                                                                                                                                                  Stocks


World 2/                                     8.38                177.37                  57.60            175.76           59.78               7.80
United States                                0.32                 36.74                   0.18             28.53            8.44               0.27
Total Foreign                                8.06                140.63                  57.42            147.23           51.34               7.53
  Major Exporters 3/                         5.46                 64.58                   0.06             18.05           47.13               4.92
     Argentina                               2.76                 28.43                   0.00              0.73           28.28               2.18
     Brazil                                  2.49                 28.33                   0.05             13.94           14.35               2.58
     India                                   0.22                  7.82                   0.01              3.38            4.50               0.16
  Major Importers 4/                         1.70                 12.90                  35.00             47.39            0.60               1.62
     EU-27                                   0.55                  8.90                  21.80             30.35            0.56               0.34
     Southeast Asia 5/                       0.86                  2.54                  10.95             13.24            0.04               1.08
                                                  Beginning             Production            Imports          Domestic         Exports           Ending
                                                     Stocks                                                       Total                           Stocks


2012/13 Proj.

World 2/                  Jun                 7.47               184.80                  58.51            182.04           60.43               8.31
                          Jul                 7.80               183.50                  58.29            180.83           60.16               8.59
United States             Jun                 0.27                35.50                   0.15             28.03            7.62               0.27
                          Jul                 0.27                34.78                   0.15             27.58            7.35               0.27
Total Foreign             Jun                 7.20               149.30                  58.36            154.01           52.81               8.04
                          Jul                 7.53               148.72                  58.14            153.25           52.81               8.32
  Major Exporters 3/      Jun                 4.54                67.55                   0.06             18.97           47.86               5.31
                          Jul                 4.92                67.55                   0.06             18.97           47.86               5.69
    Argentina             Jun                 2.18                31.05                   0.00              0.77           29.78               2.68
                          Jul                 2.18                31.05                   0.00              0.77           29.78               2.68
    Brazil                Jun                 2.20                28.52                   0.05             14.40           13.86               2.51
                          Jul                 2.58                28.52                   0.05             14.40           13.86               2.89
    India                 Jun                 0.16                 7.98                   0.01              3.80            4.23               0.12
                          Jul                 0.16                 7.98                   0.01              3.80            4.23               0.12
  Major Importers 4/      Jun                 1.71                13.04                  35.64             48.11            0.49               1.79
                          Jul                 1.62                12.98                  35.54             48.02            0.49               1.63
    EU-27                 Jun                 0.40                 8.81                  21.90             30.26            0.45               0.40
                          Jul                 0.34                 8.81                  21.90             30.26            0.45               0.34
    Southeast Asia 5/     Jun                 1.11                 2.78                  11.49             14.17            0.04               1.16
                          Jul                 1.08                 2.72                  11.39             14.08            0.04               1.06


1/ Data based on local marketing years except for Argentina and Brazil which are adjusted to an October-September year. 2/ World
imports and exports may not balance due to differences in local marketing years and to time lags between reported exports and
imports. Therefore, world supply may not equal world use. 3/ Argentina, Brazil, and India. 4/ EU-27, Southeast Asia, and Japan. 5/
Indonesia, Malaysia, Philippines, Vietnam, and Thailand.
July 2012
                                                                                    WASDE - 508 - 30

                                                                   World Soybean Oil Supply and Use 1/
                                                                          (Million Metric Tons)
                                        Beginning              Production    Imports      Domestic     Exports                       Ending
2010/11                                    Stocks                                            Total                                   Stocks

World 2/                                       3.30                41.23                 9.25          40.79          9.57              3.43
United States                                  1.55                 8.57                 0.07           7.62          1.47              1.10
Total Foreign                                  1.76                32.67                 9.17          33.17          8.10              2.33
  Major Exporters 3/                           0.83                16.32                 0.91          10.50          6.69              0.87
     Argentina                                 0.20                 7.18                 0.00           2.51          4.56              0.31
     Brazil                                    0.31                 6.90                 0.00           5.26          1.67              0.29
     EU-27                                     0.32                 2.24                 0.91           2.74          0.46              0.27
  Major Importers 4/                           0.51                11.89                 3.98          15.43          0.16              0.80
     China                                     0.21                 9.84                 1.32          11.11          0.05              0.20
     India                                     0.26                 1.68                 0.95           2.60          0.00              0.29
     North Africa 5/                           0.04                 0.37                 1.72           1.72          0.11              0.31


2011/12 Est.                                       Beginning
                                                      Stocks           Production           Imports
                                                                                                           Domestic
                                                                                                              Total      Exports
                                                                                                                                           Ending
                                                                                                                                           Stocks


World 2/                                        3.43                41.91                7.77          41.82          8.30              2.98
United States                                   1.10                 8.82                0.08           8.21          0.59              1.21
Total Foreign                                   2.33                33.09                7.68          33.61          7.71              1.78
  Major Exporters 3/                            0.87                16.07                0.53          10.64          6.27              0.55
     Argentina                                  0.31                 6.99                0.00           2.95          4.15              0.20
     Brazil                                     0.29                 7.01                0.00           5.36          1.73              0.21
     EU-27                                      0.27                 2.07                0.53           2.33          0.40              0.14
  Major Importers 4/                            0.80                12.72                3.17          15.83          0.19              0.67
     China                                      0.20                10.62                1.23          11.71          0.06              0.28
     India                                      0.29                 1.72                0.90           2.75          0.00              0.16
     North Africa 5/                            0.31                 0.39                1.04           1.38          0.12              0.23

                                                   Beginning           Production           Imports        Domestic      Exports           Ending
                                                      Stocks                                                  Total                        Stocks


2012/13 Proj.

World 2/                Jun                     2.74                43.62                7.84          43.55          8.41              2.24
                        Jul                     2.98                43.33                7.69          43.42          8.36              2.23
United States           Jun                     1.18                 8.53                0.09           8.26          0.57              0.97
                        Jul                     1.21                 8.35                0.09           8.17          0.57              0.91
Total Foreign           Jun                     1.56                35.09                7.75          35.29          7.84              1.27
                        Jul                     1.78                34.99                7.61          35.26          7.80              1.32
  Major Exporters 3/    Jun                     0.47                16.70                0.50          11.08          6.11              0.48
                        Jul                     0.55                16.71                0.50          11.16          6.06              0.54
    Argentina           Jun                     0.20                 7.60                0.00           3.51          4.09              0.21
                        Jul                     0.20                 7.60                0.00           3.56          4.04              0.21
    Brazil              Jun                     0.13                 7.06                0.00           5.41          1.68              0.11
                        Jul                     0.21                 7.07                0.00           5.44          1.68              0.17
    EU-27               Jun                     0.14                 2.04                0.50           2.17          0.35              0.16
                        Jul                     0.14                 2.04                0.50           2.17          0.35              0.16
  Major Importers 4/    Jun                     0.53                13.52                3.35          16.78          0.19              0.44
                        Jul                     0.67                13.52                3.20          16.77          0.18              0.44
    China               Jun                     0.25                11.35                1.30          12.51          0.06              0.32
                        Jul                     0.28                11.35                1.30          12.55          0.06              0.32
    India               Jun                     0.16                 1.77                0.77           2.65          0.00              0.05
                        Jul                     0.16                 1.77                0.77           2.65          0.00              0.05
    North Africa 5/     Jun                     0.13                 0.41                1.28           1.62          0.13              0.06
                        Jul                     0.23                 0.40                1.13           1.57          0.12              0.06


1/ Data based on local marketing years except for Argentina and Brazil which are adjusted to an October-September year. 2/ World
imports and exports may not balance due to differences in local marketing years and to time lags between reported exports and imports.
Therefore, world supply may not equal world use. 3/ Argentina, Brazil and EU-27. 4/ China, India, and North Africa. 5/ Algeria,
Egypt, Morocco, and Tunisia.
July 2012
                                                               WASDE - 508 - 31
                                             U.S. Quarterly Animal Product Production 1/

Year and Quarter                  Beef          Pork Red Meat         Broiler      Turkey           Total Red Meat              Egg          Milk
                                                           2/                                   Poultry 3/ & Poultry
                                                                      Million Pounds                                       Mil doz          Bil lbs
2011         III                  6,736         5,484     12,288       9,542       1,423           11,108     23,396        1,913             48.7
             IV                   6,490         6,186     12,745       8,860       1,495           10,480     23,225        1,944             48.7
             Annual             26,195       22,758       49,232       37,201           5,791      43,513     92,745           7,655         196.2

2012         I                    6,283         5,858     12,210        9,090           1,446      10,658     22,868           1,911          51.0
             II                   6,470         5,520     12,057        9,350           1,525      11,010     23,067           1,915          51.7
             III*                 6,475         5,620     12,160        9,300           1,460      10,895     23,055           1,920          49.6
             IV*                  5,950         6,300     12,317        9,150           1,550      10,825     23,142           1,950          49.3
             Annual
             Jun Proj.          25,088       23,368       48,727       36,890           6,006      43,413     92,140           7,686         202.2
             Jul Proj.          25,178       23,298       48,744       36,890           5,981      43,388     92,132           7,696         201.6

2013         I*                   6,010         5,900     11,978        9,100           1,450      10,670     22,648           1,880          50.2
             II*                  6,260         5,625     11,951        9,300           1,500      10,925     22,876           1,900          51.8
             Annual
             Jun Proj.          24,575       23,855       48,697       37,500           6,035      44,045     92,742           7,655         202.6
             Jul Proj.          24,560       23,680       48,507       37,100           5,935      43,545     92,052           7,615         201.7


* Projection.
1/ Commercial production for red meats; federally inspected for poultry meats. 2/ Beef, pork, veal and lamb & mutton. 3/ Broilers, turkeys
and mature chicken.
                                                U.S. Quarterly Prices for Animal Products
                                       Steers           Barrows            Broilers              Turkeys               Eggs                  Milk
Year and Quarter                           2/           and gilts                4/                   5/                 6/                    7/
                                                               3/
                                     Dol./cwt           Dol./cwt           Cents/lb.             Cents/lb.      Cents/doz.                Dol./cwt
2011         III                      114.05              71.06                78.8                106.4            117.7                   21.67
             IV                       121.99              64.66                76.8                111.6            131.2                   20.07
             Annual                    114.73              66.11                 79.0               102.0              115.3                20.14

2012         I                         125.29              61.68                 87.2               100.7              108.7                17.97
             II                        121.91              61.79                 85.9               106.9               99.7                16.37
             III*                    121-125               62-64                81-85             108-112         103-107              16.70-17.10
             IV*                     123-131               55-59                81-87             111-119         113-121              17.25-17.95
             Annual
             Jun Proj.               123-128               59-61                85-88             107-111         104-108              16.85-17.25
             Jul Proj.               123-126               60-62                84-86             107-110         106-109              17.05-17.35

2013         I*                      122-132               57-61                83-89              97-105         108-118              16.65-17.65
             II*                     124-134               60-66                84-92             100-108          96-104              16.55-17.55
             Annual
             Jun Proj.               124-135               57-61                82-89              99-108         100-108              17.25-18.25
             Jul Proj.               124-135               58-62                83-90             101-110         102-111              17.35-18.35


 *Projection. 1/ Simple average of months. 2/ 5-Area, Direct, Total all grades 3/ National Base, Live equiv 51-52% lean. 4/ Wholesale, 12-
city average. 5/ 8-16 lbs, hens National. 6/ Grade A large, New York, volume buyers. 7/ Prices received by farmers for all milk.
July 2012
                                                                  WASDE - 508 - 32


                                                       U.S. Meats Supply and Use
                                 Beginning Production                              Total                        Ending        Total Per Capita
Item
                                    stocks         1/              Imports        Supply         Exports        Stocks         Use       2/ 3/
                                                                                  Million Pounds /4
Beef          2011                      585         26,292           2,056        28,933        2,788              600        25,545             57.3
              2012 Proj. Jun            600         25,184           2,437        28,221           2,623           575        25,023             55.7
                         Jul            600         25,274           2,477        28,351           2,588           575        25,188             56.1
              2013 Proj. Jun            575         24,671           2,620        27,866           2,650           550        24,666             54.5
                         Jul            575Filler
                                                    24,656
                                                         Filler
                                                                     2,620
                                                                         Filler
                                                                                  27,851Filler
                                                                                                   2,650
                                                                                                       Filler
                                                                                                                   550
                                                                                                                     Filler
                                                                                                                              24,651
                                                                                                                                   Filler
                                                                                                                                                 54.5
                                                                                                                                                    Filler


Pork          2011                      541         22,775            803         24,119           5,193           542        18,384             45.7
              2012 Proj. Jun            542         23,385            812         24,739           5,384           625        18,730             46.2
                         Jul            542         23,315            812         24,669           5,404           650        18,615             46.0
              2013 Proj. Jun            625         23,872            810         25,307           5,450           625        19,232             47.1
                         Jul            650Filler
                                                    23,697
                                                         Filler
                                                                      810Filler
                                                                                  25,157Filler
                                                                                                   5,450
                                                                                                       Filler
                                                                                                                   650
                                                                                                                     Filler
                                                                                                                              19,057
                                                                                                                                   Filler
                                                                                                                                                 46.7
                                                                                                                                                    Filler


Total Red     2011                    1,145         49,358           3,022        53,525           8,000         1,162        44,363            104.2
Meat 5/       2012 Proj. Jun          1,162         48,853           3,396        53,411           8,020         1,223        44,168            103.1
                         Jul          1,162         48,870           3,436        53,468           8,005         1,248        44,215            103.2
              2013 Proj. Jun          1,223         48,824           3,595        53,642           8,117         1,198        44,327            102.9
                         Jul          1,248Filler
                                                    48,634
                                                         Filler
                                                                     3,595
                                                                         Filler
                                                                                  53,477Filler
                                                                                                   8,117
                                                                                                       Filler
                                                                                                                 1,223
                                                                                                                     Filler
                                                                                                                              44,137
                                                                                                                                   Filler
                                                                                                                                                102.4
                                                                                                                                                    Filler


Broiler       2011                      773         36,803            107         37,683           6,991           590        30,102             82.9
              2012 Proj. Jun            590         36,495            102         37,187           7,037           650        29,500             80.6
                         Jul            590         36,495            102         37,187           7,137           650        29,400             80.4
              2013 Proj. Jun            650         37,099            104         37,853           6,975           670        30,208             82.0
                         Jul            650Filler
                                                    36,703
                                                         Filler
                                                                      104Filler
                                                                                  37,457Filler
                                                                                                   7,125
                                                                                                       Filler
                                                                                                                   670
                                                                                                                     Filler
                                                                                                                              29,662
                                                                                                                                   Filler
                                                                                                                                                 80.5
                                                                                                                                                    Filler


Turkey        2011                      192          5,715             21          5,928            703            211         5,014             16.1
              2012 Proj. Jun            211          5,927             21          6,159            726            250         5,183             16.5
                         Jul            211          5,903             21          6,135            746            250         5,139             16.3
              2013 Proj. Jun            250          5,956             20          6,226            730            225         5,271             16.6
                         Jul            250Filler
                                                     5,857
                                                         Filler
                                                                       20Filler
                                                                                   6,127Filler
                                                                                                    730Filler
                                                                                                                   225
                                                                                                                     Filler
                                                                                                                               5,172
                                                                                                                                   Filler
                                                                                                                                                 16.3
                                                                                                                                                    Filler


Total         2011                      969         43,039            130         44,137           7,786           803        35,548            100.3
Poultry 6/    2012 Proj. Jun            803         42,939            125         43,867           7,843           903        35,121             98.5
                         Jul            803         42,914            125         43,842           7,963           903        34,976             98.1
              2013 Proj. Jun            903         43,564            126         44,593           7,795           899        35,899             99.9
                         Jul            903Filler
                                                    43,070
                                                         Filler
                                                                      126Filler
                                                                                  44,099Filler
                                                                                                   7,945
                                                                                                       Filler
                                                                                                                   899
                                                                                                                     Filler
                                                                                                                              35,255
                                                                                                                                   Filler
                                                                                                                                                 98.2
                                                                                                                                                    Filler


Red Meat &    2011                    2,114         92,397           3,151        97,662          15,786         1,965        79,911            204.6
Poultry       2012 Proj. Jun          1,965         91,792           3,521        97,278          15,863         2,126        79,289            201.6
                         Jul          1,965         91,785           3,561        97,311          15,968         2,151        79,192            201.3
              2013 Proj. Jun          2,126         92,388           3,721        98,235          15,912         2,097        80,226            202.8
                         Jul          2,151         91,703           3,721        97,575          16,062         2,122        79,391            200.6


1/ Total including farm production for red meats and, for poultry, federally inspected plus non-federally inspected, less
condemnations. 2/ Pounds, retail-weight basis. 3/ Population source: Dept. of Commerce, Census Bureau. 4/ Carcass weight for
red meats and certified ready-to-cook weight for poultry. 5/ Beef, pork, veal, lamb and mutton. 6/ Broilers, turkeys and mature
chicken.
July 2012
                                                                 WASDE - 508 - 33


                                                             U.S. Egg Supply and Use
                                                2010             2011       2012 Proj.          2012 Proj.   2013 Proj.         2013 Proj.
     Commodity
                                                                                   Jun                 Jul         Jun                 Jul
Eggs                                                                          Million Dozen
          Supply
            Beginning Stocks                     18.0             19.3            27.7               27.7          26.0              26.0
            Production                        7,630.0          7,655.0         7,686.0            7,696.0       7,655.0           7,615.0
            Imports                              11.8             20.9            21.1               21.1          24.0              24.0
               Total Supply                   7,659.8          7,695.2         7,734.8            7,744.8       7,705.0           7,665.0
          Use
            Exports                             258.4           275.3            262.9              262.9        266.0              266.0
            Hatching Use                        982.2           952.1            940.0              945.0        950.0              950.0
            Ending Stocks                        19.3            27.7             26.0               26.0         26.0               26.0
            Disappearance
               Total                          6,399.9          6,440.1         6,505.9            6,510.9       6,463.0           6,423.0
               Per Capita (number)              247.9            247.7           248.4              248.6         245.0             243.5
Total


                                                            U.S. Milk Supply and Use
                                                2010             2011       2012 Proj.          2012 Proj.   2013 Proj.         2013 Proj.
     Commodity
                                                                                   Jun                 Jul         Jun                 Jul
Milk                                                                           Billion Pounds
         Production                             192.8           196.2            202.2              201.6        202.6              201.7
           Farm Use                               1.0             1.0              1.0                1.0          1.0                1.0
Fat Basis Supply
         Beg. Commercial Stocks                  11.2            10.8             10.9               10.9         11.8               11.7
         Marketings                             191.9           195.3            201.2              200.6        201.6              200.7
         Imports                                  4.1             3.5              3.3                3.5          3.3                3.4
           Total Cml. Supply                    207.2           209.6            215.5              215.0        216.7              215.8
Fat Basis Use
         Commercial Exports                       8.5             9.5              8.9                9.3          9.1                9.2
         Ending Commercial Stks                  10.8            10.9             11.8               11.7         11.5               11.5
         CCC Net Removals 1/                      0.2             0.0              0.0                0.0          0.0                0.0
         Commercial Use 2/                      187.6           189.2            194.8              194.0        196.1              195.1
Skim-solid Basis Supply
         Beg. Commercial Stocks                  11.2            12.2             11.8               11.8         12.0               12.0
         Marketings                             191.9           195.3            201.2              200.6        201.6              200.7
         Imports                                  4.8             5.3              5.0                4.9          4.9                4.7
           Total Cml. Supply                    207.9           212.7            218.1              217.3        218.5              217.4
Skim-solid Basis Use
         Commercial Exports                      30.4            32.7             32.1               32.4         32.8               32.9
         Ending Commercial Stks                  12.2            11.8             12.0               12.0         12.0               12.0
         CCC Net Removals 1/                      0.0             0.0              0.0                0.0          0.0                0.0
         Commercial Use 2/                      165.7           168.2            174.0              172.9        173.8              172.4
Filler


                                                                               Million Pounds
CCC product net removals 1/
         Butter                                     8               0               0                   0            0                  0
         Cheese                                     0               0               0                   0            0                  0
         Nonfat Dry Milk                            0               0               0                   0            0                  0
         Dry Whole Milk                             0               0               0                   0            0                  0
Total


         Note: Totals may not add due to rounding. 1/ Includes products exported under the Dairy Export Incentive Program. 2/
         Domestic commercial use only. The years 2009 and 2010 are adjusted for the Barter Program.
July 2012
                                                                WASDE - 508 - 34

                                                                U.S. Dairy Prices
                                              2010              2011       2012 Proj.        2012 Proj.       2013 Proj.       2013 Proj.
     Commodity
                                                                                  Jun               Jul              Jun                 Jul
Product Prices 1/                                                         Dollars Per Pound
         Cheese                              1.5226           1.8246           1.565-            1.590-           1.600-           1.605-
                                                                                1.605             1.620            1.700            1.705
         Butter                              1.7020           1.9498           1.430-            1.470-           1.465-           1.465-
                                                                                1.500             1.530            1.595            1.595
         Nonfat Dry Milk                     1.1687           1.5058           1.210-            1.210-           1.320-           1.320-
                                                                                1.250             1.240            1.390            1.390
         Dry Whey                            0.3716           0.5325           0.540-            0.540-           0.555-           0.555-
                                                                                0.560             0.560            0.585            0.585
Filler


                                                                          Dollars Per Cwt
Milk Prices 2/
         Class III                            14.41            18.37           15.75-            16.00-           16.20-           16.25-
                                                                                16.15             16.30            17.20            17.25
         Class IV                             15.09            19.04           14.35-            14.55-           15.40-           15.40-
                                                                                14.85             14.95            16.50            16.50
         All Milk 3/                          16.26            20.14           16.85-            17.05-           17.25-           17.35-
                                                                                17.25             17.35            18.25            18.35


      1/ Simple average of monthly prices calculated by AMS from NASS weekly average dairy product prices for class price
     computations. 2/ Annual Class III and Class IV prices are the simple averages of monthly minimum Federal order milk prices
     paid by regulated plants for milk used in the respective classes. All milk price is the simple average of monthly prices received
     by farmers for milk at average test. 3/ Does not reflect any deductions from producers as authorized by legislation.
July 2012
                                                               WASDE - 508 - 35

Note: Tables on pages 35-37 present a record of the July projection and the final Estimate. Using world wheat production as an example, the "root mean
square error" means that chances are 2 out of 3 that the current forecast will not be above or below the final estimate by more than 3.0 percent.
Chances are 9 out of 10 (90% confidence level) that the difference will not exceed 5.0 percent. The average difference between the July projection and
the final estimate is 14.3 million tons, ranging from 1.0 million to 34.6 million tons. The July projection has been below the estimate 18 times and
above 13 times.
                                                        Reliability of July Projections 1/
                                                                                Differences between forecast and final estimate
                                                           90 percent                                                       Years
Commodity and                          Root mean           confidence                                               Below       Above
Region                                square error            interval       Average    Smallest     Largest         Final        Final
WHEAT                                            Percent                            Million Metric Tons
   Production
     World                                        3.0               5.0            14.3             1.0           34.6              18              13
     U.S.                                         3.7               6.3             1.7             0.2            6.2              13              18
     Foreign                                      3.2               5.5            13.9             0.3           34.7              19              12
   Exports
     World                                       6.0               10.2             5.9             0.2           18.7              19              12
     U.S.                                       11.5               19.5             2.8             0.2           10.0              19              12
     Foreign                                     7.3               12.4             5.4             0.1           21.3              20              11
   Domestic Use
     World                                        2.1               3.6             9.4             1.6           25.7              19              12
     U.S.                                         7.2              12.2             1.8             0.0            5.0              12              19
     Foreign                                      2.1               3.5             8.8             1.3           26.9              21              10
   Ending Stocks
    World                                       10.4               17.7            12.1             0.1           35.3              21              10
    U.S.                                        20.0               33.9             3.4             0.2           13.9              16              15
    Foreign                                     11.0               18.6            10.5             2.3           31.7              21              10
COARSE GRAINS 2/
   Production
     World                                       2.9                4.9            20.5             3.7           68.4              16              15
     U.S.                                       10.5               17.9            15.9             0.6           57.7              14              17
     Foreign                                     2.5                4.2            12.6             1.1           37.9              15              16
   Exports
     World                                       7.5               12.7             6.7             0.6           18.2              21              10
     U.S.                                       17.6               29.9             7.4             0.2           20.9              11              20
     Foreign                                    15.0               25.4             6.8             1.4           19.7              20              11
   Domestic Use
     World                                        1.6               2.8            11.9             0.0           26.7              16              15
     U.S.                                         4.8               8.2             7.2             0.3           22.2              20              11
     Foreign                                      1.8               3.1             9.2             1.0           30.5              17              14
   Ending Stocks
     World                                      18.7               31.8            19.2             1.6           60.2              19              12
     U.S.                                       40.9               69.3            13.8             0.5           50.5              12              19
     Foreign                                    14.9               25.2            11.1             0.2           29.2              22               9
RICE, milled
   Production
     World                                        2.6               4.4             7.4             0.4           24.0              20              11
     U.S.                                         4.8               8.1             0.2             0.0            0.6              16              13
     Foreign                                      2.6               4.5             7.4             0.5           24.3              20              11
   Exports
     World                                       9.6               16.3             1.5             0.0             6.7             22               9
     U.S.                                       10.9               18.4             0.2             0.0             1.0             15              12
     Foreign                                    10.5               17.8             1.5             0.0             6.5             22               9
   Domestic Use
     World                                        2.2               3.7             5.1             0.2           22.9              20              11
     U.S.                                         8.8              14.9             0.2             0.0            0.5              12              19
     Foreign                                      2.2               3.7             5.1             0.2           22.9              20              11
   Ending Stocks
      World                                     14.3               24.2             5.0             0.1           15.6              23               8
      U.S.                                      30.3               51.4             0.3             0.0            1.0              18              12
      Foreign                                   15.8               26.8             5.1             0.2           16.5              24               7
1/ Footnotes at end of table.                                                                                                       CONTINUED
July 2012
                                                  WASDE - 508 - 36

                                     Reliability of July Projections (Continued)
                                                                  Differences between forecast and final estimate
                                              90 percent                                                       Years
Commodity and                   Root mean     confidence                                              Below            Above
Region                         square error      interval     Average     Smallest     Largest         Final            Final
SOYBEANS                              Percent                              Million Metric Tons
 Production
    World                              5.4            9.2          7.2          0.7        26.9           14              17
    U.S.                               7.4           12.6          3.5          0.2        11.7           15              16
    Foreign                            8.1           13.8          6.7          1.0        25.8           16              15
 Exports
    World                              8.3           14.2          3.2          0.0        10.7           18              13
    U.S.                              13.7           23.2          2.7          0.1         6.8           18              13
    Foreign                           21.8           36.9          2.6          0.0        10.5           16              15
 Domestic Use
    World                              4.1             6.9         5.3          0.7        16.1           19              12
    U.S.                               5.7             9.6         1.8          0.0         4.9           19              12
    Foreign                            4.4             7.5         4.4          0.6        11.2           18              13
 Ending Stocks
    World                             15.4           26.1          3.5          0.0      13.6             19              12
    U.S.                              53.0           90.0          2.7          0.0       8.2             10              21
    Foreign                           19.9           33.7          3.8          0.0      15.4             20              11
COTTON                                                                Million 480-Pound Bales
   Production
      World                              5.6            9.6           3.6         0.0       14.9          18              13
      U.S.                              10.3          17.5            1.4         0.1        5.3          18              13
      Foreign                            5.8            9.8           2.9         0.0       12.1          16              14
   Exports
      World                             10.6          17.9            2.2         0.1       11.6          16              15
      U.S.                              29.5          50.1            1.3         0.1        3.6          19              12
      Foreign                           14.1          23.9            1.7         0.0        9.8          13              18
   Domestic Use
      World                              4.5            7.6           3.2         0.1       15.4          14              17
      U.S.                               9.9          16.7            0.6         0.0        1.4          16              14
      Foreign                            4.6            7.8           3.1         0.2       14.6          14              17
   Ending Stocks
      World                             17.6          29.8            6.0         0.2       16.3          21              10
      U.S.                              42.3          71.8            1.6         0.1        4.9          15              16
      Foreign                           17.1          29.0            5.0         0.5       16.1          22               9
1/ Marketing years 1981/82 through 2011/12 for grains, soybeans, and cotton. Final for grains, soybeans, and cotton is
defined as the first November estimate following the marketing year for 1981/82 through 2010/11, and for 2011/12 last
month's estimate. 2/ Includes corn, sorghum, barley, oats, rye, millet, and mixed grain.
July 2012
                                                   WASDE - 508 - 37

                                    Reliability of United States July Projections 1/
                                                                  Differences between forecast and final estimate
                                               90 percent                                                       Years
                                Root mean      confidence                                              Below         Above
                               square error       interval     Average     Smallest      Largest        Final         Final
CORN                                   Percent                       Million Bushels
  Production                           11.7           19.8          572           12       2,034           17           14
  Exports                              18.1           30.7          266            0         775           11           18
  Domestic Use                          5.3            8.9          281           10         770           20           11
  Ending Stocks                        50.9           86.3          495           11       1,840           13           18
SORGHUM
 Production                            18.5           31.3           74            3         213           16           15
 Exports                               36.8           62.5           42            0         118           14           16
 Domestic Use                          17.5           29.7           50            3         139           13           18
 Ending Stocks                         62.8          106.6           53            0         174           11           19
BARLEY
 Production                             8.5           14.3           24            0          87           10           20
 Exports                               61.8          104.9           16            0          92           18           12
 Domestic Use                          10.9           18.4           28            0          87           13           17
 Ending Stocks                         24.3           41.3           31            1         114           12           19
OATS
  Production                           12.8           21.7          23           0           144            5           25
  Exports                             100.5          170.6           1           0             8            8           10
  Domestic Use                          6.6           11.1          18           0            67            9           20
  Ending Stocks                        18.2           30.8          15           2            68           14           17
SOYBEAN MEAL                                                       Thousand Short Tons
  Production                            5.7            9.6        1,325         118        4,432           21           10
  Exports                              16.2           27.4          888          81        2,450           17           14
  Domestic Use                          6.1           10.4          971          76        4,470           15           16
  Ending Stocks                        44.5           75.5           59           0          413           10           16
SOYBEAN OIL                                                           Million Pounds
  Production                            5.3            9.0          630          81        2,130           21           10
  Exports                              36.5           61.9          433           0        1,575           17           13
  Domestic Use                          4.5            7.7          466           0        2,300           17           13
  Ending Stocks                        42.5           72.2          512         106        1,568           17           14
ANIMAL PROD. 3/                                                       Million Pounds
  Beef                                  4.5            7.8          898         83         2,677           13            5
  Pork                                  2.9            5.0          383         39         1,372           10            8
  Broilers                              2.4            4.2          686        184         1,338            7           11
  Turkeys                               3.7            6.5          156          2           444            9            9
                                                                      Million Dozen
  Eggs                                  1.2            2.1           67            4         184           12               6
                                                                      Billion Pounds
  Milk                                  1.8            3.1          2.5          0.2          7.0          11               7
1/ See pages 35 and 36 for record of reliability for U.S. wheat, rice, soybeans, and cotton. Marketing years 1981/82
through 2011/12 for grains, soybeans, and cotton. Final for grains, soybeans, and cotton is defined as the first November
estimate following the marketing year for 1981/82 through 2010/11, and for 2011/12 last month's estimate. Calendar
years 1995 through 2012 for meats, eggs, and milk. Final for animal products is defined as latest annual production
estimate published by NASS for 1995-2011, and for 2012 last month's estimate.
WASDE-508-38

                                  Related USDA Reports

The WASDE report incorporates information from a number of statistical reports published by USDA and
other government agencies. In turn, the WASDE report provides a framework for more detailed reports
issued by USDA’s Economic Research Service and Foreign Agricultural Service. For more information on
how the WASDE report is prepared, go to: http://www.usda.gov/oce/commodity/wasde.


                             Supply and Demand Database

The Foreign Agricultural Service publishes Production, Supply, and Demand Online, a comprehensive
database of supply and demand balances by commodity for 190 countries and regions at
http://www.fas.usda.gov/psd/online. Data for grains, oilseeds, and cotton are updated monthly and data for
other commodities are updated less frequently.


                          Foreign Production Assessments

Preliminary foreign production assessments and satellite imagery analysis used to prepare the WASDE
report are provided by the Production Estimates and Crop Assessment Division (PECAD) of the Foreign
Agricultural Service. PECAD is located at www.pecad.fas.usda.gov/.


                               Metric Conversion Factors

                                        1 Hectare = 2.4710 Acres
                                      1 Kilogram = 2.20462 Pounds
              Metric-Ton Equivalent      = Domestic Unit            Factor
              Wheat & Soybeans           bushels                    .027216
              Rice                       cwt                        .045359
              Corn, Sorghum, & Rye       bushels                    .025401
              Barley                     bushels                    .021772
              Oats                       bushels                    .014515
              Sugar                      short tons                 .907185
              Cotton                     480-lb bales               .217720
UNITED STATES DEPARTMENT OF AGRICULTURE                                                 FIRST-CLASS MAIL
  WORLD AGRICULTURAL OUTLOOK BOARD                                                     POSTAGE & FEES PAID
       WASHINGTON, D.C. 20250-3812                                                            USDA
          ___________________                                                            PERMIT NO. G-289
            OFFICIAL BUSINESS
         Penalty for Private Use, $300


                 World Agricultural Supply and Demand Estimates
                                     WASDE-508 – July 11, 2012


Electronic Subscriptions: Download the WASDE report at http://usda.mannlib.cornell.edu/.
Get a free e-mail subscription to the WASDE and other USDA crop reports at
http://usda.mannlib.cornell.edu. Select the “Reports by E-Mail” bar to sign up.


Print Subscriptions: For print subscriptions, call the National Technical Information Service
(NTIS) at 1-800-999-6779 or 703-605-6220.


     The U.S. Department of Agriculture (USDA) prohibits discrimination in all its programs and
     activities on the basis of race, color, national origin, gender, religion, age, disability, political
     beliefs, sexual orientation, and marital or family status. (Not all prohibited bases apply to all
     programs.) Persons with disabilities who require alternative means for communication of program
     information (Braille, large print, audiotape, etc.) should contact USDA’s TARGET Center at 202-
     720-2600 (voice and TDD).

     To file a complaint of discrimination, write USDA, Director, Office of Civil Rights, Room 326-W,
     Whitten Building, 1400 Independence Avenue, SW, Washington, D.C. 20250-9410 or call (202)
     720-5964 (voice or TDD). USDA is an equal opportunity provider and employer.

Usda report july 2012

  • 1.
    World Agricultural Supply ISSN:1554-9089 and Demand Estimates United States Department of Agriculture Office of the Agricultural Marketing Service Economic Research Service Chief Economist Farm Service Agency Foreign Agricultural Service WASDE - 508 Approved by the World Agricultural Outlook Board July 11, 2012 Note: This report adopts U.S. area, yield, and production forecasts for winter wheat, durum, other spring wheat, barley, and oats released today by the National Agricultural Statistics Service (NASS). For rice, corn, sorghum, soybeans, and cotton, area estimates reflect the June 29 NASS Acreage report, and methods used to project production are noted on each table. Non-survey based yields for some crops have been adjusted to reflect weather conditions to date. The first survey-based 2012 production forecasts for those crops will be reported by NASS on August 10. WHEAT: Projected U.S. wheat supplies for 2012/13 are raised 5 million bushels with higher estimated beginning stocks more than offsetting lower forecast production. Beginning stocks were reported in the June 29 Grain Stocks report 15 million bushels above last month’s projection. Feed and residual disappearance, seed use, and exports are all lowered slightly for 2011/12. Production for 2012/13 is reduced 10 million bushels as a 14-million-bushel reduction in winter wheat is only partly offset by higher forecast spring wheat. Among the Hard Red Winter wheat states, lower production for Texas, Colorado, Oklahoma, and Montana is only partly offset by increases for Kansas and Nebraska. For the Soft Red Winter (SRW) wheat states, increases for Ohio, Illinois, and Indiana are mostly offset by reductions in the southern SRW-producing states. Total U.S. wheat use for 2012/13 is projected 35 million bushels higher. Domestic U.S. food use for 2012/13 is raised 5 million bushels on expectations of lower flour extraction rates for this year’s crop. Projected feed and residual use is lowered 20 million bushels, with higher prices and stronger export demand. Exports are projected 50 million bushels higher with reduced competition from Black Sea exporters. Ending stocks for 2012/13 are projected 30 million bushels lower. The projected range for the 2012/13 season average farm price is raised 60 cents on both ends to $6.20 to $7.40 per bushel, supported by sharply higher corn and soybean prices. This compares with the record $7.24 per bushel reported for 2011/12. Global wheat supplies for 2012/13 are reduced 5.1 million tons with lower world production more than offsetting a 1.6-million-ton increase in beginning stocks. World production is lowered 6.7 million tons with reductions for Russia, Kazakhstan, and China accounting for most of the reduction. Russia production is lowered 4.0 million tons with lower expected yields for winter wheat and lower area and yield prospects for spring wheat. Kazakhstan production is lowered 2.0 million tons as persistent June heat and dryness have also reduced production prospects. China production is reduced 2.0 million tons reflecting government indications of lower yields. Canada production is also lowered slightly, down 0.4 million tons, based on lower reported plantings in the latest official survey by Statistics Canada. EU-27 production is raised 2.1 million tons with increases for France, Germany, and Hungary more than offsetting a reduction for Poland. Global wheat consumption for 2012/13 is lowered 1.8 million tons mostly reflecting lower expected wheat feeding in Kazakhstan, Australia, and the United States. Partly offsetting are small increases in wheat feed and residual use for EU-27 and South Korea. Global wheat trade is lowered slightly with imports lowered for China, Indonesia, and Uzbekistan. Partly offsetting is an increase in imports for Iran. Exports are reduced 4.0 million tons for Russia and 1.5 million
  • 2.
    WASDE-508-2 tons for Kazakhstan.Exports, however, are raised 2.0 million tons for India, 1.5 million tons for EU-27, and 1.4 million tons for the United States. World ending stocks for 2012/13 are projected 3.3 million tons lower at 182.4 million. COARSE GRAINS: U.S. feed grain supplies for 2012/13 are projected sharply lower with corn production prospects reduced 1.8 billion bushels from last month. The projected U.S. corn yield is lowered 20 bushels per acre to 146 bushels reflecting the rapid decline in crop conditions since early June and the latest weather data. Persistent and extreme June dryness across the central and eastern Corn Belt and extreme late June and early July heat from the central Plains to the Ohio River Valley have substantially lowered yield prospects across most of the major growing regions. Harvested area is also reduced slightly based on the June 29 Acreage report. Reduced supplies and higher prices are expected to sharply lower 2012/13 corn usage with the biggest reduction for feed and residual disappearance, projected down 650 million bushels. Food, seed, and industrial use is also projected lower, down 105 million bushels, mostly reflecting a 100-million-bushel reduction in corn used to produce ethanol. Exports are projected 300 million bushels lower as tight supplies, higher prices, and strong competition from South American exporters limit U.S. shipments. A 52-million-bushel increase in beginning stocks and a 15- million-bushel increase in imports offset only a small portion of the expected reduction in this year’s crop. Ending stocks for 2012/13 are projected at 1.2 billion bushels, down 698 million from last month’s projection. The season average 2012/13 farm price for corn is projected at $5.40 to $6.40 per bushel, up sharply from $4.20 to $5.00 per bushel in June. Trade changes to the 2011/12 corn balance sheet boost projected 2011/12 ending stocks. Imports are raised 2 million bushels based on the latest trade data. Exports are projected 50 million bushels lower reflecting the slowing pace of old-crop sales and shipments. The season average 2011/12 farm price for corn is projected at $6.10 to $6.30 per bushel, up from $5.95 to $6.25 per bushel last month, as cash and futures prices have soared since early June on intensifying drought and heat across the Midwest. Global coarse grain supplies for 2012/13 are lowered 47.6 million tons mostly reflecting the 46.2- million-ton projected reduction in the U.S. corn crop. Partly offsetting is a 1.3-million-ton increase in EU-27 corn production, mostly reflecting higher reported area, and a 0.4-million-ton increase in Canada corn, also on higher reported area. Other important 2012/13 coarse grain production changes include a 1.5-million-ton reduction for Ukraine barley, a 1.0-million-ton reduction for Russia barley, a 0.5-million-ton reduction for Canada barley, and a 0.3-million-ton reduction for Canada oats. Brazil 2011/12 corn production is raised again this month, up 1.0 million tons, based on the latest reports from national and state statistical agencies. Global 2012/13 coarse grain trade is projected lower this month mostly reflecting lower corn exports from the United States. Corn imports are lowered 2.0 million tons each for China and EU-27, 0.5 million tons each for Japan and South Korea, and 0.3 million tons for Mexico. Global barley trade is also lowered with Ukraine exports down 0.5 million tons and Russia and Canada exports each down 0.2 million tons. Barley exports for Australia and Argentina are raised 0.3 million tons and 0.2 million tons, respectively. Global corn consumption drops 22.9 million tons with most of the decline in the United States. Corn consumption is also lowered 0.8 million tons for India and 0.5 million tons each for Japan and South Korea. Global corn ending stocks are projected 21.7 million tons lower with the United States accounting for 17.7 million tons of the decline. Stocks are also lowered for China, Brazil, EU-27, and Mexico. RICE: U.S. rice supplies in 2012/13 are raised 12.5 million cwt or 5 percent to 247.0 million cwt as beginning stocks and production are increased 5.0 million and 8.0 million, respectively. Conversely, the import forecast is reduced 0.5 million cwt to 21.5 million because of the availability of larger domestic supplies. Beginning stocks for 2012/13 (ending stocks for 2011/12)
  • 3.
    WASDE-508-3 are raised 5.0million cwt as 2011/12 domestic and residual use is lowered based on the Rice Stocks report released on June 29. The higher-than-expected stocks reported by USDA as of June 1 implied lower 2011/12 usage than previously estimated during the March through May period and a reduction in the annual estimate as well. Rice production in 2012/13 is raised 4 percent to 191.0 million cwt this month due mostly to an increase in harvested area as indicated by the Acreage report released on June 29. Harvested area for 2012/13 is raised 107,000 acres to 2.64 million, but is still the lowest since 1987/88. Total use for 2012/13 is raised 9.0 million cwt to 218.0 million as domestic and residual use and exports are increased 5.0 million and 4 million, respectively. Ending stocks for 2011/12 are projected at 29.0 million cwt, up 3.5 million, or 14 percent from a month ago. The 2012/13 long-grain rice U.S. season average farm price (SAFP) is projected at $13.00 to $14.00 per cwt, down $1.50 cents per cwt on each end of the range from last month compared to $13.40 per cwt for 2011/12. The combined medium- and short-grain SAFP is projected at $15.50 to $16.50 per cwt, down $1.75 per cwt on both ends from a month ago, compared to $15.70 per cwt for 2011/12. The 2012/13 all rice SAFP is projected at $13.80 to $14.80 per cwt, down $1.50 per cwt on each end of the range compared to $14.10 per cwt for 2011/12. Rice price projections for 2012/13 are lowered due mostly to an increase in supplies for both long-grain and combined medium- and short-grain rice. Global 2012/13 rice production and ending stocks are reduced from last month, and consumption and trade are raised slightly. Global production is projected at 465.1 million tons, still a record despite decreases totaling 1.4 million mostly due to reductions for India and Ecuador. These reductions are partially offset by increases for Egypt, Vietnam, and the United States. India’s crop is projected at 100.0 million tons, down 2.5 million from last month, but still the second largest harvest on record. The delayed and slow progress of 2012 monsoon rains has reduced production prospects in India. Egypt’s rice crop is raised 0.7 million tons to 4.5 million due to an increase in area as reported by the Agricultural Counselor in Cairo. Ecuador’s crop is reduced 250 thousand tons because of pest and disease problems. Global exports in 2011/12 are raised slightly due mostly to an expected increase in U.S. exports, which is partially offset by a decrease for Ecuador. Global imports are raised for China and several African countries. Global consumption for 2012/13 is raised slightly to a record 466.8 million tons. World ending stocks for 2012/13 are projected at 102.5 million tons, down 1.7 million from last month, and 1.7 million below the previous year. The decrease in ending stocks is due mostly to a decline for India. OILSEEDS: U.S. oilseed production for 2012/13 is projected at 92.7 million tons, down 4.2 million from last month, with lower soybean production accounting for most of the change. Soybean production is projected at 3.050 billion bushels, down 155 million as increased harvested area is more than offset by reduced yields. Harvested area, estimated at 75.3 million acres in the June 29 Acreage report, is 2.3 million above the June projection. The soybean yield is projected at 40.5 bushels per acre, down 3.4 bushels from last month. The drop reflects sharply declining crop conditions resulting from limited rainfall since early April coupled with excessive heat across much of the producing area in late June and early July. Soybean supplies are 160 million bushels below last month’s forecast due to lower beginning stocks and reduced production. Soybean crush is projected at 1.61 billion bushels, down 35 million reflecting the impact of higher soybean meal prices on meal exports and domestic disappearance. Soybean exports for 2012/13 are reduced 115 million bushels to 1.37 billion reflecting lower U.S. supplies. Increased exports from South America and Canada partly offset reduced U.S. exports. Soybean ending stocks are projected at 130 million bushels, down 10 million. U.S. soybean crush for 2011/12 is raised 15 million bushels to 1.675 billion reflecting stronger- than-expected domestic soybean meal use. Soybean exports for 2011/12 are projected at 1.34 billion bushels, up 5 million, reflecting strong late-season sales and increased imports for China. Seed use is raised and residual is reduced based on indications from the June 29 Acreage and
  • 4.
    WASDE-508-4 Grain Stocks reports,respectively. Soybean ending stocks for 2011/12 are projected at 170 million bushels, down 5 million. Prices for soybeans and soybean meal for 2012/13 are raised this month. The U.S. season average soybean price is projected at $13.00 to $15.00 per bushel, up $1.00 on both ends of the range. Soybean meal prices are projected at $365 to $395 per short ton, up $30 on both ends of the range. The soybean oil price projection is unchanged at 52.5 to 56.5 cents per pound. Global oilseed production for 2012/13 is projected at 465.7 million tons, down 5.1 million from last month. Lower soybean, cottonseed, and sunflowerseed production estimates are only partly offset by increases for peanuts and rapeseed. Global soybean production is projected at 267.2 million tons, down 3.9 million mostly due to lower production in the United States. Higher soybean production for Canada resulting from increased area partly offsets the U.S. reduction. Rapeseed production is raised for Canada due to increased harvested area reflecting record plantings reported by Statistics Canada. Sunflowerseed production is reduced for Russia based on indications from planting progress data reported by Russia’s Ministry of Agriculture. Other changes include reduced rapeseed production for Russia and increased peanut, canola, and sunflowerseed production for the United States. Global oilseed ending stocks for 2012/13 are projected at 63.1 million tons, down 2.7 million as reduced supplies are only partly offset by lower crush. Lower soybean stocks in the United States and South America account for most of the change. SUGAR: Projected U.S. sugar supply for fiscal year 2012/13 is increased 186,000 short tons, raw value, compared with last month. Carry-in stocks are lowered due to reduced CAFTA-DR imports in 2011/12, which lower that year’s ending stocks. Higher 2012/13 U.S. beet and cane sugar production reflects higher-than-expected harvest area reported in the June Acreage report. Imports from Mexico are increased due to higher carry-in supplies. Total use is unchanged. LIVESTOCK, POULTRY, AND DAIRY: The forecasts for 2012 and 2013 red meat and poultry production are reduced from last month as higher feed prices are expected to slow the pace of pork and poultry expansion and temper growth in weights. Beef production is forecast higher for 2012 as deteriorating pasture conditions are expected to increase placements in feedlots. USDA’s Cattle report, to be released on July 20 will provide an indication of the 2012 calf crop and producers’ intentions regarding heifer retention. Beef production is reduced slightly for 2013 as the earlier placement of calves in 2012 results in a small adjustment to early 2013 marketings. Cattle carcass weights are raised for the first part of 2012, but placement of lighter-weight cattle in feedlots and the higher forecast cost of feed are expected to dampen weight growth in 2012 and 2013. Egg production is raised slightly for 2012 as higher prices support slightly faster growth, but the forecast for 2013 is reduced as higher feed prices pressure producer returns. Beef imports are raised for 2012 as demand for processing beef remains strong and a strengthening of the U.S. dollar has helped support imports from Oceania. Beef exports are reduced from last month as exports have slowed. Strong pork exports in April support an increase in the 2012 forecast. Pork imports are unchanged. Broiler and turkey exports for 2012 are raised based on current export demand. Beef, pork, and turkey trade forecasts for 2013 are unchanged from last month but the forecast of broiler exports is raised on expectations of continued strong demand. Cattle, broiler, and turkey price forecasts 2012 are lowered from last month, but hog prices are raised. Egg prices are raised as current prices have been stronger than expected and supplies are expected to be tighter in the later part of the year. For 2013, the cattle price is unchanged, but hog, broiler, and turkey prices are raised from last month on tighter supplies. The egg price forecast is raised as the production forecast is reduced.
  • 5.
    WASDE-508-5 The milk productionforecasts for 2012 and 2013 are reduced from last month as higher forecast feed prices are expected to pressure producer returns and encourage a more rapid decline in the cow herd. Milk per cow is also reduced due to higher forecast feed prices this year and next. In addition, milk yields in the short term may be affected by recent high temperatures. Imports are raised on a fat basis, reflecting stronger imports of cheese. Exports are raised on stronger sales of cheese, whey, and nonfat dry milk (NDM). Cheese prices are forecast higher for 2012 and into early 2013 as stronger exports support prices. Butter prices are forecast higher in 2012 but weaker domestic demand is expected to offset lower production in 2013 and the price forecast is unchanged. Weaker expected domestic demand will also limit price movements for NDM and whey. The NDM price is reduced slightly from last month, but the forecast for 2013 is unchanged. The whey price forecasts for both 2012 and 2013 are unchanged from last month. The Class III price forecasts for 2012 and 2013 are raised from last month due to the higher forecast cheese price and the Class IV price for 2012 is raised on the higher butter price. The 2012 all milk price is forecast at $17.05 to $17.35 per cwt and the all milk price for 2013 is raised to $17.35 to $18.35 per cwt. COTTON: This month’s 2012/13 U.S. cotton estimates show slight revisions in supply and offtake, resulting in marginally lower ending stocks. Beginning stocks are raised 100,000 bales to 3.3 million, reflecting a decrease for domestic mill use in 2011/12. Production for 2012/13 is unchanged at 17.0 million bales, despite a 4-percent reduction in planted area in the June Acreage report, as abandonment and yield have been adjusted based on current conditions. Forecast domestic mill use is reduced 100,000 bales based on recent activity levels. Exports are raised due to higher projected global imports and slightly reduced foreign competition. Ending stocks are now projected at 4.8 million bales. The projected range for the season average farm price is unchanged at 60 to 80 cents per pound. Lower beginning stocks and production trim this month’s 2012/13 world stocks projection by 3 percent. World production is reduced 1.5 million bales due to decreases for India, Pakistan, and others. A reduction in India’s crop of 1.0 million bales reflects lower-than-expected planted area and slightly lower yield prospects due to the monsoon delay. Total world consumption is virtually unchanged as reductions for China and the United States are offset by increases for India, Pakistan, and Vietnam. Approved by the Secretary of Agriculture and the Chairperson of the World Agricultural Outlook Board, Gerald A. Bange, (202) 720-6030. This report was prepared by the Interagency Commodity Estimates Committees. APPROVED BY: JOSEPH W. GLAUBER ACTING SECRETARY OF AGRICULTURE
  • 6.
    WASDE-508-6 INTERAGENCY COMMODITY ESTIMATES COMMITTEES Note: The World Agricultural Outlook Board reviews and approves the World Agricultural Supply and Demand Estimates (WASDE) report. The Board’s analysts chair the Interagency Commodity Estimates Committees (ICECs) that prepare the monthly report. Wheat: Jerry Norton, ICEC Chair, WAOB, E-mail: jnorton@oce.usda.gov Gary Vocke, ERS; Teresa McKeivier, FAS; William Chambers, FSA. Rice: Andrew C. Aaronson, ICEC Chair, WAOB, E-mail: aaaronson@oce.usda.gov Nathan Childs, ERS; Debbie Rubas, FAS; Mark Simone, FSA. Feed Grains: Jerry Norton, ICEC Chair, WAOB, E-mail: jnorton@oce.usda.gov Thomas Capehart, ERS; Richard O’Meara, FAS; Pete Riley, FSA. Oilseeds: Keith Menzie, ICEC Chair, WAOB, E-mail: kmenzie@oce.usda.gov Mark Ash, ERS; Bill George, FAS; Dale Leuck, FSA. Cotton: Carol Skelly, ICEC Chair, WAOB, E-mail: cskelly@oce.usda.gov Darryl Earnest, AMS; Leslie Meyer, ERS; James Johnson, FAS; Eugene Rosera, FSA. Sugar: John Love, ICEC Chair, WAOB, E-mail: jlove@oce.usda.gov Stephen Haley, ERS; Ron Lord, FAS; Barbara Fecso, FSA. Meat Animals: Shayle Shagam, ICEC Chair, WAOB, E-mail: sshagam@oce.usda.gov Sherry Wise, AMS; Kenneth Mathews, ERS; Claire Mezoughem, FAS; Dale Leuck, FSA. Poultry: Shayle Shagam, ICEC Chair, WAOB, E-mail: sshagam@oce.usda.gov Larry Haller, AMS; David Harvey, ERS; Lazaro Sandoval, FAS; Milton Madison, FSA. Dairy: Shayle Shagam, ICEC Chair, WAOB, E-mail: sshagam@oce.usda.gov Jerry Cessna, AMS; Roger Hoskin, ERS; Paul Kiendl, FAS; Milton Madison, FSA. In 2012, the WASDE report will be released on Aug. 10, Sep. 12, Oct. 11, Nov. 9, Dec. 11.
  • 7.
    WASDE-508-7 T A B L E OF C O N T E N T S Page Highlights ............................................................................................................... 1 Interagency Commodity Estimates Committees ..................................................... 6 World & U.S. Supply & Use for Grains ................................................................... 8 World & U.S. Supply & Use for Cotton ................................................................... 9 World & U.S. Supply & Use for Oilseeds .............................................................. 10 U.S. Wheat Supply & Use .................................................................................... 11 U.S. Wheat Supply & Use by Class ..................................................................... 11 U.S. Feed Grain & Corn Supply & Use ................................................................ 12 U.S. Sorghum, Barley & Oats Supply & Use ........................................................ 13 U.S. Rice Supply & Use ....................................................................................... 14 U.S. Soybeans & Products Supply & Use ............................................................ 15 U.S. Sugar Supply & Use ..................................................................................... 16 Mexico Sugar Supply and Use ............................................................................. 16 U.S. Cotton Supply & Use .................................................................................... 17 World Wheat Supply & Use.................................................................................. 18 World Coarse Grains Supply & Use ..................................................................... 20 World Corn Supply & Use .................................................................................... 22 World Rice Supply & Use ..................................................................................... 24 World Cotton Supply & Use ................................................................................. 26 World Soybean Supply & Use .............................................................................. 28 World Soybean Meal Supply & Use ..................................................................... 29 World Soybean Oil Supply & Use......................................................................... 30 U.S. Quarterly Animal Product Production ........................................................... 31 U.S. Quarterly Prices for Animal Products ........................................................... 31 U.S. Meats Supply and Use ................................................................................. 32 U.S. Egg Supply & Use ........................................................................................ 33 U.S. Milk Supply and Use .................................................................................... 33 U.S. Dairy Prices ................................................................................................. 34 Reliability Tables ................................................................................................. 35 Related USDA Reports ........................................................................................ 38 Metric Conversion Factors ................................................................................... 38 Electronic Access and Subscriptions ....................................................................... 40
  • 8.
    July 2012 WASDE - 508 - 8 World and U.S Supply and Use for Grains 1/ Million Metric Tons Total Total Ending World Output Supply Trade 2/ Use 3/ Stocks Total Grains 4/ 2010/11 2197.12 2688.42 283.62 2230.22 458.20 2011/12 (Est.) 2304.31 2762.50 311.01 2298.37 464.13 filler filler filler filler filler 2012/13 (Proj.) Jun 2370.17 2832.49 303.90 2354.84 477.66 2012/13 (Proj.) Jul 2314.04 2778.17 295.78 2327.76 450.41 filler filler filler filler filler Wheat 2010/11 651.14 851.69 132.43 654.46 197.23 2011/12 (Est.) 694.69 891.92 150.40 694.74 197.18 filler filler filler filler filler 2012/13 (Proj.) Jun 672.06 867.62 135.42 681.87 185.76 2012/13 (Proj.) Jul 665.33 862.50 134.71 680.06 182.44 filler filler filler filler filler Coarse Grains 5/ 2010/11 1096.61 1292.19 116.43 1129.86 162.33 2011/12 (Est.) 1145.68 1308.01 125.34 1145.25 162.76 filler filler filler filler filler 2012/13 (Proj.) Jun 1231.60 1393.97 132.41 1206.23 187.74 2012/13 (Proj.) Jul 1183.63 1346.39 124.89 1180.91 165.49 filler filler filler filler filler Rice, milled 2010/11 449.37 544.54 34.75 445.91 98.63 2011/12 (Est.) 463.94 562.57 35.27 458.38 104.19 filler filler filler filler filler 2012/13 (Proj.) Jun 466.51 570.90 36.06 466.74 104.16 2012/13 (Proj.) Jul 465.08 569.27 36.18 466.79 102.47 filler filler filler filler filler United States Total Total Ending Output Trade 2/ Supply Use 3/ Stocks Total Grains 4/ 2010/11 397.89 479.50 89.19 333.04 57.27 2011/12 (Est.) 383.98 447.67 73.85 326.78 47.05 filler filler filler filler filler 2012/13 (Proj.) Jun 456.45 507.96 86.16 350.92 70.88 2012/13 (Proj.) Jul 410.56 464.43 80.06 332.00 52.38 filler filler filler filler filler Wheat 2010/11 60.06 89.25 35.08 30.71 23.47 2011/12 (Est.) 54.41 81.01 28.53 32.27 20.21 filler filler filler filler filler 2012/13 (Proj.) Jun 60.80 83.88 31.30 33.69 18.89 2012/13 (Proj.) Jul 60.53 84.01 32.66 33.29 18.07 filler filler filler filler filler Coarse Grains 5/ 2010/11 330.24 380.89 50.63 297.97 32.29 2011/12 (Est.) 323.70 358.64 42.11 290.79 25.74 filler filler filler filler filler 2012/13 (Proj.) Jun 389.82 416.61 52.09 313.35 51.18 2012/13 (Proj.) Jul 343.95 372.55 44.47 294.70 33.39 filler filler filler filler filler Rice, milled 2010/11 7.59 9.36 3.49 4.36 1.51 2011/12 (Est.) 5.87 8.02 3.21 3.72 1.10 filler filler filler filler filler 2012/13 (Proj.) Jun 5.83 7.47 2.77 3.88 0.81 2012/13 (Proj.) Jul 6.09 7.86 2.93 4.01 0.92 filler filler filler filler filler 1/ Aggregate of local marketing years. 2/ Based on export estimate. See individual commodity tables for treatment of export/import imbalances. 3/ Total use for the United States is equal to domestic consumption only (excludes exports). 4/ Wheat, coarse grains and milled rice. 5/ Corn, sorghum, barley, oats, rye, millet and mixed grains (for U.S. excludes millet and mixed grains).
  • 9.
    July 2012 WASDE - 508 - 9 World and U.S. Supply and Use for Grains, Continued 1/ Million Metric Tons Total Total Ending Foreign 3/ Output Supply Trade 2/ Use Stocks Total Grains 4/ 2010/11 1,799.23 2,208.92 194.43 1,897.19 400.93 2011/12 (Est.) 1,920.32 2,314.83 237.16 1,971.60 417.08 filler filler filler filler filler 2012/13 (Proj.) Jun 1,913.72 2,324.54 217.74 2,003.91 406.78 2012/13 (Proj.) Jul 1,903.48 2,313.74 215.73 1,995.76 398.03 filler filler filler filler filler Wheat 2010/11 591.08 762.44 97.36 623.75 173.77 2011/12 (Est.) 640.27 810.91 121.87 662.48 176.97 filler filler filler filler filler 2012/13 (Proj.) Jun 611.26 783.74 104.13 648.18 166.86 2012/13 (Proj.) Jul 604.80 778.50 102.05 646.78 164.38 filler filler filler filler filler Coarse Grains 5/ 2010/11 766.38 911.30 65.80 831.89 130.04 2011/12 (Est.) 821.98 949.37 83.23 854.46 137.02 filler filler filler filler filler 2012/13 (Proj.) Jun 841.78 977.36 80.33 892.88 136.57 2012/13 (Proj.) Jul 839.69 973.84 80.43 886.20 132.10 filler filler filler filler filler Rice, milled 2010/11 441.77 535.18 31.27 441.55 97.12 2011/12 (Est.) 458.07 554.55 32.07 454.66 103.09 filler filler filler filler filler 2012/13 (Proj.) Jun 460.68 563.43 33.29 462.86 103.35 2012/13 (Proj.) Jul 458.99 561.40 33.25 462.78 101.55 filler filler filler filler filler 1/ Aggregate of local marketing years. 2/ Based on export estimate. See individual commodity tables for treatment of export/import imbalances. 3/ Total foreign is equal to world minus United States. 4/ Wheat, coarse grains and milled rice. 5/ Corn, sorghum, barley, oats, rye, millet and mixed grains. World and U.S. Supply and Use for Cotton 1/ Million 480-lb. Bales Total Total Ending Output Supply Trade 2/ Use 3/ Stocks World 2010/11 116.40 164.22 36.66 114.65 49.52 2011/12 (Est.) 122.71 172.23 43.40 106.59 66.68 2012/13 (Proj.) Jun 115.29 182.62 36.95 109.01 74.51 2012/13 (Proj.) Jul 113.81 180.49 37.39 108.98 72.39 United States 2010/11 18.10 21.06 14.38 3.90 2.60 2011/12 (Est.) 15.57 18.19 11.60 3.30 3.30 2012/13 (Proj.) Jun 17.00 20.21 11.80 3.50 4.90 2012/13 (Proj.) Jul 17.00 20.31 12.10 3.40 4.80 Foreign 4/ 2010/11 98.29 143.16 22.29 110.75 46.92 2011/12 (Est.) 107.14 154.04 31.80 103.29 63.38 2012/13 (Proj.) Jun 98.29 162.41 25.15 105.51 69.61 2012/13 (Proj.) Jul 96.81 160.19 25.29 105.58 67.59 1/ Marketing year beginning August 1. 2/ Based on export estimate. 3/ Includes U.S. domestic mill use only. 4/ Total Foreign is equal to world minus United States. See global cotton tables for treatment of export/import imbalances.
  • 10.
    July 2012 WASDE - 508 - 10 World and U.S. Supply and Use for Oilseeds 1/ (Million Metric Tons) Total Total Ending World Output Supply Trade Use 2/ Stocks Oilseeds 2010/11 456.48 529.89 109.22 377.50 81.45 2011/12 (Est.) 436.41 517.86 108.35 388.25 61.92 2012/13 (Proj.) Jun 470.82 533.69 114.90 399.43 65.78 2012/13 (Proj.) Jul 465.75 527.67 113.85 397.01 63.09 Oilmeals 2010/11 257.09 265.18 77.41 251.31 10.09 2011/12 (Est.) 263.80 273.88 79.68 260.77 9.87 2012/13 (Proj.) Jun 271.53 281.01 80.40 268.08 10.15 2012/13 (Proj.) Jul 270.01 279.88 80.14 266.72 10.41 Vegetable Oils 2010/11 147.51 161.33 59.98 144.73 13.67 2011/12 (Est.) 153.17 166.84 62.88 150.71 13.36 2012/13 (Proj.) Jun 157.74 171.23 65.00 155.87 12.66 2012/13 (Proj.) Jul 156.77 170.12 64.71 155.64 11.69 United States Output Total Supply Trade Total /Use 2 Ending Stocks Oilseeds 2010/11 100.38 106.87 41.83 49.34 7.31 2011/12 (Est.) 91.32 99.92 37.07 49.65 5.55 2012/13 (Proj.) Jun 96.97 103.88 41.17 49.37 5.00 2012/13 (Proj.) Jul 92.75 99.46 38.09 48.43 4.78 Oilmeals 2010/11 38.08 40.66 8.51 31.77 0.38 2011/12 (Est.) 39.08 42.68 8.67 33.67 0.34 2012/13 (Proj.) Jun 38.07 41.55 7.86 33.35 0.34 2012/13 (Proj.) Jul 37.35 40.93 7.60 33.00 0.34 Vegetable Oils 2010/11 9.80 15.40 1.86 11.93 1.61 2011/12 (Est.) 9.96 15.56 1.09 12.88 1.60 2012/13 (Proj.) Jun 9.84 15.47 0.97 13.14 1.35 2012/13 (Proj.) Jul 9.66 15.39 0.97 13.07 1.34 filler filler filler filler filler Foreign 3/ Output Total Supply Trade Total /Use 2 Ending Stocks Oilseeds 2010/11 356.10 423.03 67.39 328.16 74.14 2011/12 (Est.) 345.09 417.94 71.28 338.60 56.37 2012/13 (Proj.) Jun 373.85 429.82 73.73 350.06 60.79 2012/13 (Proj.) Jul 373.00 428.21 75.76 348.59 58.32 Oilmeals 2010/11 219.02 224.53 68.90 219.54 9.71 2011/12 (Est.) 224.71 231.21 71.01 227.11 9.53 2012/13 (Proj.) Jun 233.46 239.46 72.54 234.73 9.82 2012/13 (Proj.) Jul 232.66 238.94 72.55 233.72 10.07 Vegetable Oils 2010/11 137.72 145.93 58.12 132.80 12.06 2011/12 (Est.) 143.21 151.28 61.79 137.83 11.76 2012/13 (Proj.) Jun 147.90 155.76 64.03 142.73 11.30 2012/13 (Proj.) Jul 147.10 154.74 63.74 142.56 10.35 1/ Aggregate of local marketing years with Brazil and Argentina on an Oct.-Sept. year. 2/ Crush only for oilseeds. 3/ Total foreign is equal to world minus United States.
  • 11.
    July 2012 WASDE - 508 - 11 U.S. Wheat Supply and Use 1/ 2010/11 2011/12 Est. 2012/13 Proj. 2012/13 Proj. Jun Jul Million Acres Area Planted 53.6 54.4 55.9 * 56.0 Area Harvested 47.6 45.7 49.2 * 48.8 Bushels Yield per Harvested Acre 46.3 43.7 45.4 * 45.6 Million Bushels Beginning Stocks 976 862 728 743 Production 2,207 1,999 2,234 2,224 Imports 97 115 120 120 Supply, Total 3,279 2,977 3,082 3,087 Food 926 940 945 950 Seed 71 77 73 73 Feed and Residual 132 169 220 200 Domestic, Total 1,128 1,186 1,238 1,223 Exports 1,289 1,048 1,150 1,200 Use, Total 2,417 2,234 2,388 2,423 Ending Stocks 862 743 694 664 CCC Inventory 0 0 Free Stocks 862 743 Outstanding Loans 15 10 Avg. Farm Price ($/bu) 2/ 5.70 7.24 5.60 - 6.80 6.20 - 7.40 U.S. Wheat by Class: Supply and Use Hard Hard Soft Year beginning June 1 Winter Spring Red White Durum Total Million Bushels 2011/12 (Est.) Beginning Stocks 386 185 171 85 35 862 Production 780 398 458 314 50 1,999 Supply, Total 3/ 1,167 619 662 407 123 2,977 Domestic Use 452 223 313 127 71 1,186 Exports 398 245 163 216 26 1,048 Use, Total 850 468 477 343 97 2,234 Ending Stocks, Total 317 151 185 64 26 743 2012/13 (Proj.) Beginning Stocks 317 151 185 64 26 743 Production 1,010 435 429 268 82 2,224 Supply, Total 3/ 1,328 626 644 341 148 3,087 Domestic Use 462 246 311 121 83 1,223 Exports 600 225 190 160 25 1,200 Use, Total 1,062 471 501 281 108 2,423 Ending Stocks, Total Jul 266 155 143 60 40 664 Ending Stocks, Total Jun NA NA NA NA NA NA Note: Totals may not add due to rounding. 1/ Marketing year beginning June 1. 2/ Marketing-year weighted average price received by farmers. 3/ Includes imports. * For June, planted acres reported in the March 30, 2012, "Prospective Plantings." Winter wheat harvested acres and yield reported in the June 12, 2012,"Crop Production." Harvested acres and yield for other spring wheat and durum are projected using 10-year harvested-to-planted ratios by state and 1985-2011 yield trends by state (except for Arizona, California, and Idaho durum). For July, area planted, area harvested, yield, and production as reported in the July 11, 2012,"Crop Production."
  • 12.
    July 2012 WASDE - 508 - 12 U.S. Feed Grain and Corn Supply and Use 1/ 2010/11 2011/12 Est. 2012/13 Proj. 2012/13 Proj. FEED GRAINS Jun Jul Million Acres Area Planted 99.6 102.5 108.0 * 109.0 * Area Harvested 90.0 91.1 98.3 * 98.4 * Metric Tons Yield per Harvested Acre 3.67 3.55 3.96 3.49 Million Metric Tons Beginning Stocks 48.1 32.3 24.2 25.7 Production 330.0 323.5 389.6 343.8 Imports 2.4 2.5 2.4 2.7 Supply, Total 380.5 358.3 416.3 372.2 Feed and Residual 127.7 119.6 143.0 127.0 Food Seed & Industrial 170.0 170.8 170.1 167.4 Domestic, Total 297.6 290.5 313.0 294.4 Exports 50.6 42.1 52.1 44.5 Use, Total 348.3 332.6 365.1 338.8 Ending Stocks 32.3 25.7 51.2 33.4 CCC Inventory 0.0 0.0 Free Stocks 32.3 25.7 Outstanding Loans 1.3 2.6 11/2010 .Est 12/2011 .Proj 13/2012 .Proj 13/2012 CORN June July Million Acres Area Planted 88.2 91.9 95.9 * 96.4 * Area Harvested 81.4 84.0 89.1 * 88.9 * Bushels Yield per Harvested Acre 152.8 147.2 166.0 * 146.0 * Million Bushels Beginning Stocks 1,708 1,128 851 903 Production 12,447 12,358 14,790 12,970 Imports 28 22 15 30 Supply, Total 14,182 13,508 15,656 13,903 Feed and Residual 4,793 4,550 5,450 4,800 Food, Seed & Industrial 2/ 6,428 6,455 6,425 6,320 Ethanol & by-products 3/ 5,021 5,050 5,000 4,900 Domestic, Total 11,220 11,005 11,875 11,120 Exports 1,835 1,600 1,900 1,600 Use, Total 13,055 12,605 13,775 12,720 Ending Stocks 1,128 903 1,881 1,183 CCC Inventory 0 0 Free Stocks 1,128 903 Outstanding Loans 48 100 Avg. Farm Price ($/bu) 4/ 5.18 6.10 - 6.30 4.20 - 5.00 5.40 - 6.40 Note: Totals may not add due to rounding. 1/ Marketing year beginning September 1 for corn and sorghum; June 1 for barley and oats. 2/ For a breakout of FSI corn uses, see Feed Outlook table 5 or access the data on the Web through the Feed Grains Database at www.ers.usda.gov/data/feedgrains. 3/ Corn processed in ethanol plants to produce ethanol and by-products including distillers' grains, corn gluten feed, corn gluten meal, and corn oil. 4/ Marketing-year weighted average price received by farmers. * For June, planted acres reported in the March 30, 2012, "Prospective Plantings." For corn, harvested acres projected based on historical abandonment and derived demand for silage. Projected corn yield based on the simple linear trend of the national average yield for 1990-2010 adjusted for 2012 planting progress. For July, corn planted and harvested area as reported in the June 29, 2012, "Acreage." Projected corn yield lowered to reflect expected impacts of persistent and extreme June and early July dryness and heat across the central and eastern Corn Belt.
  • 13.
    July 2012 WASDE - 508 - 13 U.S. Sorghum, Barley, and Oats Supply and Use 1/ 2010/11 2011/12 Est. 2012/13 Proj. 2012/13 Proj. SORGHUM Jun Jul Bushels Million Filler Filler Filler Filler Filler Area Planted (mil. acres) 5.4 5.5 6.0 * 6.2 * Area Harvested (mil. acres) 4.8 3.9 5.2 * 5.2 * Yield (bushels/acre) 71.8 54.6 65.0 * 64.9 * Beginning Stocks 41 27 27 27 Production 346 214 335 340 Imports 0 0 0 0 Supply, Total 387 242 362 367 Feed and Residual 124 75 90 100 Food, Seed & Industrial 85 90 90 90 Total Domestic 209 165 180 190 Exports 150 50 140 140 Use, Total 359 215 320 330 Ending Stocks 27 27 42 37 Avg. Farm Price ($/bu) 2/ 5.02 6.00 - 6.20 3.85 - 4.65 5.00 - 6.00 Filler Filler Filler Filler Filler 11/2010 .Est 12/2011 .Proj 13/2012 .Proj 13/2012 BARLEY June July Filler Filler Filler Filler Filler Area Planted (mil. acres) 2.9 2.6 3.3 * 3.7 * Area Harvested (mil. acres) 2.5 2.2 2.9 * 3.3 * Yield (bushels/acre) 73.1 69.6 69.0 * 66.3 * Beginning Stocks 115 89 52 60 Production 180 156 200 217 Imports 9 14 15 15 Supply, Total 305 259 267 292 Feed and Residual 50 32 30 50 Food, Seed & Industrial 159 160 160 160 Total Domestic 208 192 190 210 Exports 8 7 10 10 Use, Total 216 199 200 220 Ending Stocks 89 60 67 72 Avg. Farm Price ($/bu) 2/ 3.86 5.35 5.10 - 6.10 5.30 - 6.30 Filler Filler Filler Filler Filler 11/2010 .Est 12/2011 .Proj 13/2012 .Proj 13/2012 OATS June July Filler Filler Filler Filler Filler Area Planted (mil. acres) 3.1 2.5 2.9 * 2.7 * Area Harvested (mil. acres) 1.3 0.9 1.2 * 1.1 * Yield (bushels/acre) 64.3 57.1 65.2 * 59.8 * Beginning Stocks 80 68 52 55 Production 81 54 75 65 Imports 85 95 100 95 Supply, Total 247 216 227 215 Feed and Residual 102 82 90 80 Food, Seed & Industrial 74 76 76 76 Total Domestic 176 158 166 156 Exports 3 3 3 3 Use, Total 179 161 169 159 Ending Stocks 68 55 58 56 Avg. Farm Price ($/bu) 2/ 2.52 3.49 2.40 - 3.00 3.10 - 3.90 Filler Filler Filler Filler Filler Note: Totals may not add due to rounding. 1/ Marketing year beginning September 1 for sorghum; June 1 for barley and oats. 2/ Marketing-year weighted average price received by farmers. * For June--Planted acres reported in the March 30, 2012, "Prospective Plantings." Harvested area - For sorghum, harvested acres are based on the 5-year Olympic average harvested-to-planted ratio, 2007- 2011. For barley and oats, harvested acres are based on the 5-year average harvested-to-planted ratios, 2007-2011. Yield - For sorghum the projected yield is based on the 3-year average, 2009-2011, adjusted for rounding in production. For barley and oats, projected yields are based on the 1990-2011 trends adjusted for rounding in production. For July--Sorghum planted and harvested area as reported in the June 29, 2012, "Acreage." Sorghum projected yield is based on the 3-year average, 2009-2011, adjusted for rounding in production. Barley and oats area planted, area harvested, yield, and production as reported in the July 11, 2012, "Crop Production."
  • 14.
    July 2012 WASDE - 508 - 14 U.S. Rice Supply and Use 1/ (Rough Equivalent of Rough and Milled Rice) 2010/11 2011/12 Est. 2012/13 Proj. 2012/13 Proj. TOTAL RICE Jun Jul Million Acres Area Planted 3.64 2.69 2.56 * 2.66 * Area Harvested Filler 3.62 2.62 2.53 * 2.64 * Pounds Yield per Harvested Acre 6,725 7,067 7,225 * 7,235 * Million Hundredweight Beginning Stocks 2/ 36.5 48.5 29.5 34.5 Production 243.1 185.0 183.0 191.0 Imports 18.3 20.0 22.0 21.5 Supply, Total 297.9 253.5 234.5 247.0 Domestic & Residual 3/ 137.8 118.0 122.0 126.0 Exports, Total 4/ 111.6 101.0 87.0 92.0 Rough 34.9 33.0 32.0 32.0 Milled (rough equiv.) 76.8 68.0 55.0 60.0 Use, Total 249.5 219.0 209.0 218.0 Ending Stocks 48.5 34.5 25.5 29.0 Avg. Milling Yield (%) 5/ 68.86 70.00 70.25 70.25 Avg. Farm Price ($/cwt) 6/ 12.70 14.10 15.30 - 16.30 13.80 - 14.80 Total 11/2010 .Est 12/2011 .Proj 13/2012 .Proj 13/2012 LONG-GRAIN RICE June July Harvested Acres (mil.) 2.83 1.74 Filler Filler Filler Filler Filler Yield (pounds/acre) 6,486 6,691 Beginning Stocks 23.0 35.6 16.1 18.6 Production 183.3 116.4 127.5 133.5 Supply, Total 7/ 222.2 169.6 162.6 171.1 Domestic & Residual 3/ 108.5 85.0 90.0 94.0 Exports 8/ 78.0 66.0 57.0 60.0 Use, Total 186.5 151.0 147.0 154.0 Ending Stocks 35.6 18.6 15.6 17.1 Avg. Farm Price ($/cwt) 6/ 11.00 13.40 14.50 - 15.50 13.00 - 14.00 Filler Filler Filler Filler Filler 11/2010 .Est 12/2011 .Proj 13/2012 .Proj 13/2012 MEDIUM & SHORT-GRAIN RICE June July Harvested Acres (mil.) 0.79 0.88 Filler Filler Filler Filler Filler Yield (pounds/acre) 7,580 7,812 Beginning Stocks 12.0 10.1 10.7 13.2 Production 59.8 68.6 55.5 57.5 Supply, Total 7/ 73.1 81.2 69.2 73.2 Domestic & Residual 3/ 29.4 33.0 32.0 32.0 Exports 8/ 33.6 35.0 30.0 32.0 Use, Total 63.0 68.0 62.0 64.0 Ending Stocks 10.1 13.2 7.2 9.2 Avg. Farm Price ($/cwt) 6/ 18.80 15.70 17.25 - 18.25 15.50 - 16.50 Filler Filler Filler Filler Filler Note: Totals may not add due to rounding. 1/ Marketing year beginning August 1. 2/ Includes the following quantities of broken kernel rice (type undetermined) not included in estimates of beginning stocks by type (in mil. cwt): 2010/11-1.5; 2011/12-2.7; 2012/13-2.7. 3/ Residual includes unreported use, processing losses, and estimating errors. Use by type may not add to total rice use because of the difference in brokens between beginning and ending stocks. 4/ Includes rough rice and milled rice exports. Milled rice exports are converted to an equivalent rough basis. 5/ Expressed as a percent, i.e., the total quantity of whole kernel and broken rice produced divided by the quantity of rough rice milled. Data supplied by the USA Rice Federation. The 2012/13 milling yield is calculated using the previous five- year average-- 2007/08-2011/12. 6/ Marketing-year weighted average price received by farmers. 7/ Includes imports. 8/ Exports by type of rice are estimated. * For June-- Planted acres reported in March 30, 2012 "Prospective Plantings". Harvested acres are estimated using the average harvested-to-planted ratios by rice class, 2007-2011. For July-- Planted and harvested area reported in June 29, 2012 "Acreage" report. For June and July: projected yield is based on linear trend analysis by rice class for the period 1990/91 to 2011/12.
  • 15.
    July 2012 WASDE - 508 - 15 U.S. Soybeans and Products Supply and Use (Domestic Measure) 1/ 2010/11 2011/12 Est. 2012/13 Proj. 2012/13 Proj. SOYBEANS Jun Jul Filler Filler Filler Filler Filler Million Acres Area Planted 77.4 75.0 73.9 * 76.1 ** Area Harvested 76.6 73.6 73.0 * 75.3 ** Filler Bushels Yield per Harvested Acre 43.5 41.5 43.9 * 40.5 ** Million Bushels Beginning Stocks 151 215 175 170 Production 3,329 3,056 3,205 3,050 Imports 14 15 15 15 Supply, Total 3,495 3,286 3,395 3,235 Crushings 1,648 1,675 1,645 1,610 Exports 1,501 1,340 1,485 1,370 Seed 87 88 89 89 Residual 43 13 36 35 Use, Total 3,280 3,116 3,255 3,105 Ending Stocks 215 170 140 130 Avg. Farm Price ($/bu) 2/ 11.30 12.40 12.00 - 14.00 13.00 - 15.00 Total 11/2010 .Est 12/2011 .Proj 13/2012 .Proj 13/2012 SOYBEAN OIL June July Filler Filler Filler Filler Filler Million Pounds Beginning Stocks 3,406 2,425 2,590 2,660 Production 3/ 18,888 19,450 18,800 18,400 Imports 159 185 195 195 Supply, Total 22,453 22,060 21,585 21,255 Domestic Disappearance 16,795 18,100 18,200 18,000 Exports 3,233 1,300 1,250 1,250 Use, Total 20,028 19,400 19,450 19,250 Ending stocks 2,425 2,660 2,135 2,005 Avg. Farm Price (c/lb) 2/ 53.20 51.75 52.50 - 56.50 52.50 - 56.50 Total 11/2010 .Est 12/2011 .Proj 13/2012 .Proj 13/2012 SOYBEAN MEAL June July Filler 1 2 3 4 Thousand Short Tons Beginning Stocks 302 350 300 300 Production 3/ 39,251 40,500 39,135 38,335 Imports 179 200 165 165 Supply, Total 39,731 41,050 39,600 38,800 Domestic Disappearance 30,277 31,450 30,900 30,400 Exports 9,104 9,300 8,400 8,100 Use, Total 39,381 40,750 39,300 38,500 Ending Stocks 350 300 300 300 Avg. Farm Price ($/s.t.) 2/ 345.52 365.00 335.00 - 365.00 365.00 - 395.00 Total Note: Reliability calculations at end of report. 1/ Marketing year beginning September 1 for soybeans; October 1 for soybean oil and soybean meal. 2/ Prices: soybeans, marketing year weighted average price received by farmers; oil, simple average of crude soybean oil, Decatur; meal, simple average of 48 percent, Decatur. 3/ Current month projection for 2011/12 based on October year crush of 1,690 million bushels. * Planted acres are reported in the March 30 Prospective Plantings. Harvested acres based on 5-year average planted-to-harvested ratio. Projected yields based on 1989-2010 trend analysis. **Planted and harvested acres from the June 29 Acreage report. Projected yield based on 1989 - 2010 trend analysis adjusted for weather and crop conditions through early July.
  • 16.
    July 2012 WASDE - 508 - 16 U.S. Sugar Supply and Use 1/ 2010/11 2011/12 Est. 2012/13 Proj. 2012/13 Proj. Jun Jul Filler Filler Filler Filler Filler 1,000 Short Tons,Raw Value Beginning Stocks 1,498 1,472 1,825 1,809 Production 2/ 7,831 8,298 8,575 8,750 Beet Sugar 4,659 4,750 5,045 5,105 Cane Sugar 3,172 3,548 3,530 3,645 Florida 1,433 1,828 1,800 1,890 Hawaii 182 170 180 180 Louisiana 1,411 1,400 1,400 1,425 Texas 146 150 150 150 Imports 3,738 3,799 3,047 3,074 TRQ 3/ 1,721 2,100 1,283 1,283 Other Program 4/ 291 550 450 450 Other 5/ 1,726 1,149 1,314 1,341 Mexico 1,708 1,139 1,304 1,331 Total Supply 13,067 13,569 13,446 13,633 Exports 248 250 250 250 Deliveries 11,347 11,510 11,635 11,635 Food 6/ 11,118 11,300 11,425 11,425 Other 7/ 229 210 210 210 Miscellaneous 0 0 0 0 Total Use 11,595 11,760 11,885 11,885 Ending Stocks 1,472 1,809 1,561 1,748 Stocks to Use Ratio 12.7 15.4 13.1 14.7 Total 1/ Fiscal years beginning Oct 1. Historical data are from FSA "Sweetener Market Data" except imports (U.S. Customs Service, Census Bureau). 2/ Production projections for 2012/13 are based on June Acreage report and trend yields. 3/ For 2012/13, includes only U.S. commitments under current trade agreements, minus shortfall. The Secretary will establish the actual level of the TRQ at a later date. For 2011/12, shortfall (72). For 2012/13, shortfall (165). 4/ Includes sugar under the re-export and polyhydric alcohol programs. 5/ For 2010/11, other high-tier (18) and other (0). For 2011/12, other high-tier (10) and other (0). For 2012/13, other high-tier (10) and other (0). 6/Combines SMD deliveries for domestic human food use and SMD miscellaneous uses. 7/ Transfers to sugar-containing products for reexport, and for nonedible alcohol and feed. Mexico Sugar Supply and Use and High Fructose Corn Syrup Imports 1/ Beginning Ending Stocks Production Imports Domestic 2/ Exports Stocks Sugar 1,000 Metric Tons, Actual Weight 2011/12 Est. Jun 760 5,025 382 4,383 984 800 2011/12 Est. Jul 760 5,048 382 4,383 984 823 2012/13 Proj. Jun 800 5,300 181 4,360 1,126 795 2012/13 Proj. Jul 823 5,300 181 4,360 1,149 795 1/ HFCS imports by Mexico (metric tons, dry basis): Oct-Sep 2010/11 = 1,192,057; Oct-May 2010/11 = 756,958; Oct-May 2011/12 = 831,902. Footnote source: Comite Nacional para el Desarollo Sustentable de la Cana de Azucar. 2/Includes domestic consumption, Mexico's products export program (IMMEX), and any residual statistical discrepancies.
  • 17.
    July 2012 WASDE - 508 - 17 U.S. Cotton Supply and Use 1/ 2010/011 2011/012 Est. 2012/013 Proj. 2012/013 Proj. Jun Jul Filler Filler Filler Filler Filler Area Million Acres Planted 10.97 14.74 13.16 * 12.64 ** Harvested 10.70 9.46 10.50 * 10.40 ** Filler Pounds Yield per Harvested Acre 812 790 777 * 785 ** Million 480 Pound Bales Beginning Stocks 2/ 2.95 2.60 3.20 3.30 Production 18.10 15.57 17.00 17.00 Imports 0.01 0.02 0.01 0.01 Supply, Total 21.06 18.19 20.21 20.31 Domestic Use 3.90 3.30 3.50 3.40 Exports, Total 14.38 11.60 11.80 12.10 Use, Total 18.28 14.90 15.30 15.50 Unaccounted 3/ 0.18 -0.01 0.01 0.01 Ending Stocks 2.60 3.30 4.90 4.80 Avg. Farm Price 4/ 81.5 91.0 60.0 - 80.0 60.0 - 80.0 Total Note: Reliability calculations at end of report. 1/ Upland and extra-long staple; marketing year beginning August 1. Totals may not add due to rounding. 2/ Based on Bureau of Census data for 2010/11; estimated thereafter. 3/ Reflects the difference between the previous season's supply less total use and ending stocks. 4/ Cents per pound for upland cotton. *Planted area as reported in March 30 "Prospective Plantings." Projected harvested area based on 2009/10 through 2011/12 average abandonment, weighted by region and adjusted to reflect drought on the Texas High Plains. Projected yield/harvested acres based on 2009/10 through 2011/12 average yield, weighted by region. **Planted area as reported in June 29 "Acreage." Projected harvested area and yield based on 2009/10 through 2011/12 averages, weighted by region. Harvested area is further adjusted to include estimated abandonment of 30 percent in the Southwest.
  • 18.
    July 2012 WASDE - 508 - 18 World Wheat Supply and Use 1/ (Million Metric Tons) Beginning Domestic Domestic Ending 2010/11 Stocks Production Imports Feed Total 2/ Exports Stocks World 3/ 200.55 651.14 131.65 116.33 654.46 132.43 197.23 United States 26.55 60.06 2.64 3.59 30.71 35.08 23.47 Total Foreign 174.00 591.08 129.01 112.74 623.75 97.36 173.77 Major Exporters 4/ 31.92 202.86 5.31 58.44 141.76 67.63 30.68 Argentina 2.34 16.10 0.01 0.10 5.95 9.49 3.01 Australia 5.59 27.89 0.12 3.00 6.13 18.66 8.82 Canada 7.83 23.17 0.44 2.84 7.69 16.58 7.18 EU-27 5/ 16.16 135.70 4.73 52.50 122.00 22.91 11.68 Major Importers 6/ 85.21 184.80 70.70 22.36 243.79 8.14 88.79 Brazil 2.60 5.90 6.70 0.20 10.80 2.54 1.86 China 54.43 115.18 0.93 13.00 110.50 0.94 59.09 Sel. Mideast 7/ 8.74 19.64 13.57 2.52 33.00 1.29 7.66 N. Africa 8/ 10.95 15.93 24.18 2.38 39.23 0.36 11.47 Pakistan 3.56 23.90 0.20 0.40 23.00 1.35 3.31 Southeast Asia 9/ 3.12 0.00 15.80 2.82 14.42 0.55 3.95 Selected Other 0.00 India 16.12 80.80 0.27 2.90 81.76 0.07 15.36 FSU-12 25.84 81.06 5.66 23.73 75.04 13.88 23.64 Russia 14.72 41.51 0.09 16.00 38.60 3.98 13.74 Kazakhstan 4.30 9.64 0.01 1.90 6.20 4.86 2.88 Ukraine 2.36 16.84 0.04 2.80 11.60 4.30 3.34 Beginning Domestic Domestic Ending 2011/12 Est. Stocks Production Imports Feed /Total 2 Exports Stocks World 3/ 197.23 694.69 144.78 147.16 694.74 150.40 197.18 United States 23.47 54.41 3.13 4.59 32.27 28.53 20.21 Total Foreign 173.77 640.27 141.65 142.57 662.48 121.87 176.97 Major Exporters 4/ 30.68 206.64 8.01 66.60 149.83 67.30 28.21 Argentina 3.01 14.50 0.01 0.10 5.95 10.80 0.76 Australia 8.82 29.50 0.10 3.50 6.73 23.00 8.70 Canada 7.18 25.26 0.40 5.50 10.40 17.30 5.14 EU-27 5/ 11.68 137.38 7.50 57.50 126.75 16.20 13.61 Major Importers 6/ 88.79 188.41 78.10 36.71 260.58 7.21 87.51 Brazil 1.86 5.80 7.30 0.50 11.20 2.00 1.76 China 59.09 117.92 3.20 22.00 120.50 1.00 58.71 Sel. Mideast 7/ 7.66 17.62 15.60 3.67 33.67 1.11 6.10 N. Africa 8/ 11.47 18.43 23.80 3.30 41.30 0.40 12.00 Pakistan 3.31 24.20 0.20 0.40 23.10 1.15 3.46 Southeast Asia 9/ 3.95 0.00 16.50 4.29 16.26 0.55 3.64 Selected Other 0.00 India 15.36 86.87 0.03 3.10 81.56 0.75 19.95 FSU-12 23.64 114.42 7.44 29.43 81.71 38.11 25.68 Russia 13.74 56.23 0.10 16.00 38.50 21.30 10.27 Kazakhstan 2.88 22.73 0.01 4.00 9.00 11.00 5.63 Ukraine 3.34 22.12 0.10 6.10 14.95 5.00 5.61 1/ Aggregate of local marketing years. 2/ Total foreign and world use adjusted to reflect the differences in world imports and exports. 3/ World imports and exports may not balance due to differences in marketing years, grain in transit, and reporting discrepancies in some countries. 4/ Argentina, Australia, Canada, and the EU-27. 5/ Trade excludes intra-trade. 6/ Brazil, China, Japan, Mexico, N. Africa, Pakistan, selected Middle East, and Southeast Asia. 7/ Lebanon, Iraq, Iran, Israel, Jordan, Kuwait, Saudi Arabia, Yemen, United Arab Emirates, and Oman. 8/ Algeria, Egypt, Libya, Morocco, and Tunisia. 9/ Indonesia, Malaysia, Philippines, Thailand, and Vietnam.
  • 19.
    July 2012 WASDE - 508 - 19 World Wheat Supply and Use 1/ (Cont'd.) (Million Metric Tons) Beginning Domestic Domestic Ending 2012/13 Proj. Stocks Production Imports Feed Total 2/ Exports Stocks World 3/ Jun 195.56 672.06 135.29 131.67 681.87 135.42 185.76 Jul 197.18 665.33 134.72 130.33 680.06 134.71 182.44 United States Jun 19.82 60.80 3.27 5.99 33.69 31.30 18.89 Jul 20.21 60.53 3.27 5.44 33.29 32.66 18.07 Total Foreign Jun 175.75 611.26 132.03 125.69 648.18 104.13 166.86 Jul 176.97 604.80 131.45 124.89 646.78 102.05 164.38 Major Exporters 4/ Jun 28.31 196.01 6.01 60.30 144.40 59.70 26.22 Jul 28.21 197.74 6.01 60.30 144.34 61.20 26.42 Argentina Jun 1.46 12.00 0.01 0.10 6.00 6.20 1.27 Jul 0.76 12.00 0.01 0.10 6.00 6.20 0.57 Australia Jun 8.10 26.00 0.10 4.00 7.30 20.50 6.40 Jul 8.70 26.00 0.10 3.50 6.74 20.50 7.56 Canada Jun 5.14 27.00 0.40 2.70 7.85 18.50 6.19 Jul 5.14 26.60 0.40 2.70 7.85 18.50 5.79 EU-27 5/ Jun 13.61 131.01 5.50 53.50 123.25 14.50 12.36 Jul 13.61 133.14 5.50 54.00 123.75 16.00 12.50 Major Importers 6/ Jun 86.51 186.42 73.00 31.01 257.69 4.20 84.04 Jul 87.51 184.42 73.00 31.06 257.84 4.12 82.96 Brazil Jun 1.76 5.00 6.70 0.20 11.00 0.50 1.96 Jul 1.76 5.00 6.70 0.20 11.00 0.50 1.96 China Jun 57.99 120.00 2.50 22.00 122.00 1.00 57.49 Jul 58.71 118.00 2.00 22.00 122.00 1.00 55.71 Sel. Mideast 7/ Jun 6.05 17.59 15.20 1.92 31.73 0.52 6.60 Jul 6.10 17.59 15.80 1.92 31.93 0.52 7.05 N. Africa 8/ Jun 11.77 16.78 23.00 2.40 40.90 0.40 10.25 Jul 12.00 16.78 23.10 2.45 41.05 0.33 10.50 Pakistan Jun 3.46 23.00 0.20 0.40 23.20 0.30 3.16 Jul 3.46 23.00 0.20 0.40 23.20 0.30 3.16 Southeast Asia 9/ Jun 3.64 0.00 15.40 2.99 15.57 0.58 2.90 Jul 3.64 0.00 15.20 2.99 15.37 0.58 2.90 Selected Other India Jun 19.95 91.00 0.00 3.60 85.45 2.50 23.00 Jul 19.95 91.00 0.00 3.60 85.45 4.50 21.00 FSU-12 Jun 25.78 94.76 6.61 25.18 77.76 29.11 20.29 Jul 25.68 88.56 6.16 24.13 76.26 23.61 20.54 Russia Jun 10.67 53.00 0.20 15.50 37.90 16.00 9.97 Jul 10.27 49.00 0.20 15.50 37.90 12.00 9.57 Kazakhstan Jun 5.63 15.00 0.01 3.50 8.50 8.50 3.64 Jul 5.63 13.00 0.01 2.50 7.50 7.00 4.14 Ukraine Jun 5.61 13.00 0.10 2.80 11.70 4.00 3.01 Jul 5.61 13.00 0.10 2.80 11.70 4.00 3.01 1/ Aggregate of local marketing years. 2/ Total foreign and world use adjusted to reflect the differences in world imports and exports. 3/ World imports and exports may not balance due to differences in marketing years, grain in transit, and reporting discrepancies in some countries. 4/ Argentina, Australia, Canada, and the EU-27. 5/ Trade excludes intra-trade. 6/ Brazil, China, Japan, Mexico, N. Africa, Pakistan, selected Middle East, and Southeast Asia. 7/ Lebanon, Iraq, Iran, Israel, Jordan, Kuwait, Saudi Arabia, Yemen, United Arab Emirates, and Oman. 8/ Algeria, Egypt, Libya, Morocco, and Tunisia. 9/ Indonesia, Malaysia, Philippines, Thailand, and Vietnam.
  • 20.
    July 2012 WASDE - 508 - 20 World Coarse Grain Supply and Use 1/ (Million Metric Tons) Beginning Domestic Domestic Ending 2010/11 Stocks Production Imports Feed Total 2/ Exports Stocks World 3/ 195.58 1,096.61 115.98 655.06 1,129.86 116.43 162.33 United States 48.13 330.24 2.52 127.78 297.97 50.63 32.29 Total Foreign 147.44 766.38 113.46 527.28 831.89 65.80 130.04 Major Exporters 4/ 15.17 77.00 1.61 32.61 50.49 32.40 10.90 Argentina 1.42 31.66 0.01 8.09 11.38 19.67 2.03 Australia 2.73 11.76 0.00 5.31 6.98 5.77 1.74 Canada 5.65 22.26 1.02 14.21 20.91 4.48 3.54 Major Importers 5/ 48.66 222.18 87.15 235.68 313.45 6.71 37.83 EU-27 5/ 25.85 140.59 8.48 114.29 152.00 6.17 16.75 Japan 1.31 0.17 18.59 14.06 18.88 0.00 1.19 Mexico 1.94 29.26 10.74 22.79 39.34 0.09 2.52 N. Afr & Mideast 7/ 12.11 28.44 21.55 43.33 51.31 0.15 10.65 Saudi Arabia 2.45 0.46 7.44 8.43 8.70 0.00 1.65 Southeast Asia 8/ 2.82 23.07 7.83 22.46 30.36 0.31 3.05 South Korea 1.67 0.16 8.17 6.11 8.36 0.00 1.64 Selected Other 0.00 Brazil 10.29 60.38 1.12 45.06 52.73 8.42 10.64 China 52.40 183.40 2.70 128.75 188.18 0.19 50.13 FSU-12 7.37 47.57 1.20 28.52 41.92 8.72 5.51 Russia 3.22 16.42 0.67 10.46 18.13 0.31 1.88 Ukraine 2.21 21.44 0.08 10.23 13.74 7.84 2.14 2011/12 Est. Beginning Stocks Production Imports Domestic Feed Domestic /Total 2 Exports Ending Stocks World 3/ 162.33 1,145.68 118.97 658.41 1,145.25 125.34 162.76 United States 32.29 323.70 2.66 119.71 290.79 42.11 25.74 Total Foreign 130.04 821.98 116.31 538.69 854.46 83.23 137.02 Major Exporters 4/ 10.90 76.48 1.09 31.45 49.60 28.74 10.13 Argentina 2.03 29.41 0.02 8.10 11.52 18.01 1.93 Australia 1.74 13.23 0.00 5.27 6.94 5.88 2.15 Canada 3.54 21.87 0.97 13.09 19.94 3.34 3.10 Major Importers 5/ 37.83 225.89 86.09 230.53 308.79 6.86 34.16 EU-27 5/ 16.75 145.96 6.91 111.55 150.01 6.31 13.30 Japan 1.19 0.17 17.84 13.25 18.07 0.00 1.13 Mexico 2.52 25.80 11.78 21.60 38.34 0.01 1.75 N. Afr & Mideast 7/ 10.65 28.01 22.25 43.52 50.83 0.21 9.86 Saudi Arabia 1.65 0.45 9.51 8.73 9.00 0.00 2.60 Southeast Asia 8/ 3.05 25.24 6.41 22.65 30.76 0.34 3.61 South Korea 1.64 0.21 7.06 5.14 7.39 0.00 1.52 Selected Other 0.00 Brazil 10.64 72.83 1.16 48.55 57.25 14.01 13.37 China 50.13 199.66 7.06 131.85 196.56 0.19 60.11 FSU-12 5.51 78.96 0.83 39.10 55.18 23.91 6.21 Russia 1.88 32.80 0.40 17.88 27.58 5.86 1.64 Ukraine 2.14 33.34 0.08 12.00 15.85 16.81 2.90 1/ Aggregate of local marketing years. Coarse grains include corn, sorghum, barley, oats, rye, millet, and mixed grains (for U.S. excludes millet and mixed grains). 2/ Total foreign and world use adjusted to reflect the differences in world imports and exports. 3/ World imports and exports may not balance due to differences in marketing years, grain in transit, and reporting discrepancies in some countries. 4/ Argentina, Australia, Canada, and South Africa. 5/ The EU-27, Mexico, Japan, selected North Africa and Middle East, South Korea, Southeast Asia, and Taiwan. 6/ Trade excludes intra-trade. 7/ Algeria, Egypt, Iran, Israel, Jordan, Libya, Morocco, Syria, Tunisia, and Turkey. 8/ Indonesia, Malaysia, Philippines, Thailand, and Vietnam.
  • 21.
    July 2012 WASDE - 508 - 21 World Coarse Grain Supply and Use 1/ (Cont'd.) (Million Metric Tons) Beginning Domestic Domestic Ending 2012/13 Proj. Stocks Production Imports Feed Total 2/ Exports Stocks World 3/ Jun 162.37 1,231.60 125.89 708.25 1,206.23 132.41 187.74 Jul 162.76 1,183.64 120.98 688.87 1,180.91 124.89 165.49 United States Jun 24.22 389.82 2.57 143.03 313.35 52.09 51.18 Jul 25.74 343.95 2.87 127.06 294.70 44.46 33.39 Total Foreign Jun 138.15 841.78 123.32 565.22 892.88 80.33 136.57 Jul 137.02 839.69 118.12 561.82 886.20 80.43 132.10 Major Exporters 4/ Jun 10.11 87.03 0.69 34.66 54.00 33.20 10.63 Jul 10.13 86.66 0.69 34.36 53.59 33.70 10.20 Argentina Jun 1.93 35.65 0.01 8.54 12.75 22.41 2.43 Jul 1.93 35.65 0.01 8.54 12.75 22.61 2.23 Australia Jun 2.10 12.58 0.00 5.99 7.66 5.13 1.89 Jul 2.15 12.58 0.00 5.69 7.36 5.43 1.94 Canada Jun 3.10 25.35 0.57 14.99 21.99 3.65 3.38 Jul 3.10 24.98 0.57 14.98 21.87 3.65 3.13 Major Importers 5/ Jun 34.26 230.46 90.71 239.98 318.57 5.05 31.82 Jul 34.16 231.78 87.21 238.78 317.37 5.05 30.74 EU-27 5/ Jun 13.40 148.24 7.56 114.18 152.89 4.58 11.73 Jul 13.30 149.56 5.56 114.18 152.89 4.58 10.95 Japan Jun 1.13 0.18 18.91 14.30 19.12 0.00 1.11 Jul 1.13 0.18 18.41 13.80 18.62 0.00 1.11 Mexico Jun 1.75 28.48 12.53 23.17 40.14 0.03 2.58 Jul 1.75 28.48 12.23 23.17 40.14 0.03 2.28 N. Afr & Mideast 7/ Jun 9.86 27.20 22.54 43.62 50.79 0.21 8.60 Jul 9.86 27.20 22.34 43.42 50.59 0.21 8.60 Saudi Arabia Jun 2.60 0.45 9.11 9.33 9.60 0.00 2.55 Jul 2.60 0.45 9.11 9.33 9.60 0.00 2.55 Southeast Asia 8/ Jun 3.61 25.65 7.07 24.66 32.76 0.24 3.33 Jul 3.61 25.65 7.07 24.66 32.76 0.24 3.33 South Korea Jun 1.52 0.21 8.56 6.54 8.79 0.00 1.50 Jul 1.52 0.21 8.06 6.04 8.29 0.00 1.50 Selected Other Brazil Jun 14.37 70.43 1.16 50.46 59.69 12.01 14.27 Jul 13.37 70.43 1.16 50.46 59.69 12.01 13.27 China Jun 60.01 202.01 9.26 139.85 210.06 0.29 60.94 Jul 60.11 202.01 7.26 139.85 210.06 0.29 59.04 FSU-12 Jun 6.26 78.18 0.70 40.47 56.89 21.31 6.94 Jul 6.21 75.33 0.90 38.87 55.14 20.61 6.69 Russia Jun 1.69 32.90 0.25 19.20 28.90 3.81 2.13 Jul 1.64 31.75 0.45 18.60 28.15 3.61 2.08 Ukraine Jun 2.90 32.80 0.08 12.00 16.20 16.51 3.07 Jul 2.90 31.30 0.08 11.20 15.40 16.01 2.87 1/ Aggregate of local marketing years. Coarse grains include corn, sorghum, barley, oats, rye, millet, and mixed grains (for U.S. excludes millet and mixed grains). 2/ Total foreign and world use adjusted to reflect the differences in world imports and exports. 3/ World imports and exports may not balance due to differences in marketing years, grain in transit, and reporting discrepancies in some countries. 4/ Argentina, Australia, Canada, and South Africa. 5/ The EU-27, Mexico, Japan, selected North Africa and Middle East, South Korea, Southeast Asia, and Taiwan. 6/ Trade excludes intra-trade. 7/ Algeria, Egypt, Iran, Israel, Jordan, Libya, Morocco, Syria, Tunisia, and Turkey. 8/ Indonesia, Malaysia, Philippines, Thailand, and Vietnam.
  • 22.
    July 2012 WASDE - 508 - 22 World Corn Supply and Use 1/ (Million Metric Tons) Beginning Domestic Domestic Ending 2010/11 Stocks Production Imports Feed Total 2/ Exports Stocks World 3/ 144.07 829.12 92.62 501.05 848.87 91.46 124.31 United States 43.38 316.17 0.70 121.74 285.01 46.60 28.64 Total Foreign 100.69 512.95 91.91 379.31 563.87 44.87 95.67 Major Exporters 4/ 6.04 34.52 0.43 10.25 17.95 18.80 4.25 Argentina 0.87 23.60 0.01 5.30 7.30 16.35 0.83 South Africa 5.17 10.92 0.42 4.95 10.65 2.45 3.42 Major Importers 5/ 13.70 106.56 57.17 114.57 162.54 1.48 13.41 Egypt 1.49 6.50 5.80 10.10 12.50 0.01 1.28 EU-27 6/ 5.21 55.93 7.36 47.50 62.50 1.08 4.92 Japan 0.68 0.00 15.65 11.20 15.70 0.00 0.63 Mexico 1.39 21.01 8.26 13.20 29.00 0.09 1.57 Southeast Asia 7/ 2.82 23.01 7.81 22.40 30.30 0.30 3.05 South Korea 1.62 0.07 8.11 6.07 8.21 0.00 1.58 Selected Other 0.00 Brazil 9.99 57.40 0.79 42.50 49.50 8.40 10.28 Canada 1.76 11.71 0.95 6.67 11.43 1.71 1.28 China 51.30 177.25 0.98 128.00 180.00 0.11 49.42 FSU-12 1.54 18.49 0.33 11.37 13.26 5.21 1.89 Ukraine 0.67 11.92 0.04 5.40 6.50 5.01 1.12 2011/12 Est. Beginning Stocks Production Imports Domestic Feed Domestic /Total 2 Exports Ending Stocks World 3/ 124.31 873.70 94.03 507.78 868.64 98.84 129.37 United States 28.64 313.92 0.56 115.58 279.54 40.64 22.94 Total Foreign 95.67 559.79 93.47 392.20 589.10 58.20 106.44 Major Exporters 4/ 4.25 32.50 0.04 10.55 18.40 14.50 3.88 Argentina 0.83 21.00 0.01 5.60 7.70 13.00 1.14 South Africa 3.42 11.50 0.03 4.95 10.70 1.50 2.74 Major Importers 5/ 13.41 114.44 54.40 116.90 165.13 3.45 13.67 Egypt 1.28 5.50 5.00 9.00 10.80 0.01 0.97 EU-27 6/ 4.92 64.64 6.30 52.00 67.50 3.10 5.26 Japan 0.63 0.00 15.00 10.50 15.00 0.00 0.63 Mexico 1.57 19.00 10.50 13.70 29.70 0.01 1.36 Southeast Asia 7/ 3.05 25.19 6.40 22.60 30.70 0.33 3.60 South Korea 1.58 0.08 7.00 5.10 7.20 0.00 1.46 Selected Other 0.00 Brazil 10.28 70.00 0.80 46.00 54.00 14.00 13.08 Canada 1.28 10.70 0.90 5.80 10.80 0.40 1.68 China 49.42 192.78 5.00 131.00 188.00 0.10 59.10 FSU-12 1.89 33.69 0.26 14.79 17.26 16.54 2.03 Ukraine 1.12 22.84 0.05 7.50 8.80 14.00 1.21 1/ Aggregate of local marketing years. 2/ Total foreign and world use adjusted to reflect the differences in world imports and exports. 3/ World imports and exports may not balance due to differences in marketing years, grain in transit, and reporting discrepancies in some countries. 4/ Argentina and South Africa. 5/ Egypt, the EU-27, Mexico, Japan, South Korea, Taiwan, and Southeast Asia. 6/ Trade excludes intra- trade. 7/ Indonesia, Malaysia, Philippines, Thailand, and Vietnam.
  • 23.
    July 2012 WASDE - 508 - 23 World Corn Supply and Use 1/ (Cont'd.) (Million Metric Tons) Beginning Domestic Domestic Ending 2012/13 Proj. Stocks Production Imports Feed Total 2/ Exports Stocks World 3/ Jun 129.19 949.93 100.32 553.31 923.39 105.32 155.74 Jul 129.37 905.23 95.75 535.95 900.51 98.30 134.09 United States Jun 21.62 375.68 0.38 138.44 301.64 48.26 47.78 Jul 22.94 329.45 0.76 121.93 282.46 40.64 30.05 Total Foreign Jun 107.57 574.25 99.94 414.88 621.75 57.06 107.96 Jul 106.44 575.77 94.99 414.03 618.05 57.66 104.04 Major Exporters 4/ Jun 3.91 38.00 0.04 10.90 19.70 18.00 4.24 Jul 3.88 38.00 0.04 10.90 19.70 18.00 4.22 Argentina Jun 1.14 25.00 0.01 5.80 8.60 16.00 1.55 Jul 1.14 25.00 0.01 5.80 8.60 16.00 1.55 South Africa Jun 2.77 13.00 0.03 5.10 11.10 2.00 2.69 Jul 2.74 13.00 0.03 5.10 11.10 2.00 2.67 Major Importers 5/ Jun 13.77 116.68 57.35 122.70 171.83 2.27 13.71 Jul 13.67 118.00 54.05 121.70 170.83 2.27 12.63 Egypt Jun 0.97 5.80 5.20 9.00 11.00 0.01 0.96 Jul 0.97 5.80 5.20 9.00 11.00 0.01 0.96 filler filler filler filler filler filler filler EU-27 6/ Jun 5.36 64.15 7.00 53.50 69.50 2.00 5.01 Jul 5.26 65.47 5.00 53.50 69.50 2.00 4.23 Japan Jun 0.63 0.00 16.00 11.50 16.00 0.00 0.63 Jul 0.63 0.00 15.50 11.00 15.50 0.00 0.63 Mexico Jun 1.36 21.00 9.30 13.50 29.70 0.03 1.93 Jul 1.36 21.00 9.00 13.50 29.70 0.03 1.63 Southeast Asia 7/ Jun 3.60 25.60 7.05 24.60 32.70 0.23 3.32 Jul 3.60 25.60 7.05 24.60 32.70 0.23 3.32 South Korea Jun 1.46 0.08 8.50 6.50 8.60 0.00 1.44 Jul 1.46 0.08 8.00 6.00 8.10 0.00 1.44 Selected Other Brazil Jun 14.08 67.00 0.80 47.50 56.00 12.00 13.88 Jul 13.08 67.00 0.80 47.50 56.00 12.00 12.88 Canada Jun 1.68 12.60 0.50 7.40 12.60 0.50 1.68 Jul 1.68 13.00 0.50 7.60 12.80 0.80 1.58 China Jun 59.00 195.00 7.00 139.00 201.00 0.20 59.80 Jul 59.10 195.00 5.00 139.00 201.00 0.20 57.90 FSU-12 Jun 2.03 36.26 0.24 16.39 19.56 15.94 3.03 Jul 2.03 36.26 0.24 16.39 19.56 15.94 3.03 Ukraine Jun 1.21 24.00 0.05 7.50 9.30 14.00 1.96 Jul 1.21 24.00 0.05 7.50 9.30 14.00 1.96 1/ Aggregate of local marketing years. 2/ Total foreign and world use adjusted to reflect the differences in world imports and exports. 3/ World imports and exports may not balance due to differences in marketing years, grain in transit, and reporting discrepancies in some countries. 4/ Argentina and South Africa. 5/ Egypt, the EU-27, Mexico, Japan, South Korea, Taiwan, and Southeast Asia. 6/ Trade excludes intra-trade. 7/ Indonesia, Malaysia, Philippines, Thailand, and Vietnam.
  • 24.
    July 2012 WASDE - 508 - 24 World Rice Supply and Use (Milled Basis) 1/ (Million Metric Tons) Beginning Production Imports Total /2 Exports Ending 2010/11 Stocks Domestic Stocks World 3/ 95.17 449.37 32.71 445.91 34.75 98.63 United States 1.18 7.59 0.58 4.36 3.49 1.51 Total Foreign 93.99 441.77 32.13 441.55 31.27 97.12 Major Exporters 4/ 29.17 147.61 0.73 122.15 23.81 31.56 India 20.50 95.98 0.00 90.21 2.77 23.50 Pakistan 1.10 5.00 0.03 2.25 3.39 0.50 Thailand 6.10 20.26 0.20 10.30 10.65 5.62 Vietnam 1.47 26.37 0.50 19.40 7.00 1.94 Major Importers 5/ 13.34 62.09 14.28 75.79 1.78 12.14 Brazil 0.55 9.30 0.63 8.20 1.48 0.80 EU-27 6/ 1.12 2.05 1.39 3.24 0.26 1.06 Indonesia 6.58 35.50 3.10 39.00 0.00 6.18 Nigeria 0.49 2.62 2.40 5.03 0.00 0.47 Philippines 3.52 10.54 1.30 12.90 0.00 2.46 Sel. Mideast 7/ 1.01 1.62 4.23 5.72 0.02 1.13 Selected Other 0.00 Burma 0.86 10.53 0.00 10.10 0.78 0.51 C. Amer & Carib 8/ 0.37 1.64 1.51 3.13 0.00 0.39 China 40.53 137.00 0.54 135.00 0.50 42.57 Egypt 0.50 3.10 0.02 3.30 0.20 0.12 Japan 2.69 7.72 0.68 8.20 0.20 2.69 Mexico 0.14 0.15 0.71 0.78 0.00 0.21 South Korea 1.51 4.30 0.41 5.18 0.00 1.03 2011/12 Est. Beginning Stocks Production Imports Total /2 Domestic Exports Ending Stocks World 3/ 98.63 463.94 33.53 458.38 35.27 104.19 United States 1.51 5.87 0.64 3.72 3.21 1.10 Total Foreign 97.12 458.07 32.89 454.66 32.07 103.09 Major Exporters 4/ 31.56 157.10 0.65 126.55 25.25 37.50 India 23.50 103.40 0.00 93.90 8.00 25.00 Pakistan 0.50 6.50 0.05 2.50 3.75 0.80 Thailand 5.62 20.46 0.20 10.40 6.50 9.38 Vietnam 1.94 26.74 0.40 19.75 7.00 2.33 Major Importers 5/ 12.14 61.58 13.12 76.39 1.13 9.32 Brazil 0.80 7.86 0.70 8.13 0.85 0.38 EU-27 6/ 1.06 1.95 1.55 3.30 0.25 1.01 Indonesia 6.18 36.30 1.25 39.30 0.00 4.43 Nigeria 0.47 2.71 2.50 5.20 0.00 0.48 Philippines 2.46 10.64 1.50 12.80 0.00 1.80 Sel. Mideast 7/ 1.13 1.67 4.25 5.87 0.02 1.16 Selected Other 0.00 Burma 0.51 10.82 0.00 10.14 0.60 0.58 C. Amer & Carib 8/ 0.39 1.71 1.46 3.17 0.00 0.38 China 42.57 140.70 1.50 139.50 0.50 44.77 Egypt 0.12 4.25 0.80 4.07 0.60 0.50 Japan 2.69 7.65 0.70 8.05 0.20 2.79 Mexico 0.21 0.12 0.75 0.89 0.00 0.19 South Korea 1.03 4.22 0.60 4.98 0.00 0.88 1/ Aggregate of local marketing years. 2/ Total foreign and world use adjusted to reflect the differences in world imports and exports. Total domestic includes both domestic use and unreported disappearance. 3/ World imports and exports may not balance due to differences in some countries. 4/ India, Pakistan, Thailand, and Vietnam. 5/ Brazil, Indonesia, Hong Kong, Cote d'Ivoire, Nigeria, Philippines, selected Middle East, and the EU-27. 6/ Trade excludes intra-trade. 7/ Selected Middle East includes Iran, Iraq, and Saudi Arabia. 8/ Central American and Caribbean countries.
  • 25.
    July 2012 WASDE - 508 - 25 World Rice Supply and Use (Milled Basis) 1/ (Cont'd.) (Million Metric Tons) Beginning Production Imports Total /2 Exports Ending 2012/13 Proj. Stocks Domestic Stocks World 3/ Jun 104.39 466.51 32.81 466.74 36.06 104.16 Jul 104.19 465.08 33.42 466.79 36.18 102.47 United States Jun 0.94filler 5.83 filler 0.70 filler 3.88 filler 2.77 filler 0.81 filler Jul 1.10 6.09 0.68 4.01 2.93 0.92 Total Foreign Jun 103.46filler 460.68 filler 32.11 filler 462.86 filler 33.29 filler 103.35 filler Jul 103.09 458.99 32.74 462.78 33.25 101.55 Major Exporters 4/ Jun 37.42 156.85 0.70 129.30 26.00 39.67 Jul 37.50 154.73 0.70 129.30 26.00 37.63 India Jun 25.00 102.50 0.00 96.00 7.00 24.50 Jul 25.00filler 100.00 filler 0.00 filler 96.00 filler 7.00 filler 22.00 filler Pakistan Jun 0.80 6.80 0.00 2.60 4.00 1.00 Jul 0.80 6.80 0.00 2.60 4.00 1.00 Thailand Jun 9.38 21.05 0.30 10.60 8.00 12.13 Jul 9.38 21.05 0.30 10.60 8.00 12.13 Vietnam Jun 2.24 26.50 0.40 20.10 7.00 2.04 Jul 2.33 26.88 0.40 20.10 7.00 2.50 Major Importers 5/ Jun 9.77 63.34 13.11 77.25 1.19 7.79 Jul 9.32 63.34 13.11 76.95 1.19 7.64 Brazil Jun 0.38filler 8.67 filler 0.61 filler 8.10 filler 0.90 filler 0.66 filler Jul 0.38 8.67 0.61 8.10 0.90 0.66 EU-27 6/ Jun 1.01 1.89 1.55 3.30 0.24 0.91 Jul 1.01 1.89 1.55 3.30 0.24 0.91 Indonesia Jun 4.88 36.90 1.45 40.00 0.00 3.23 Jul 4.43 36.90 1.45 39.70 0.00 3.08 Nigeria Jun 0.48 2.85 2.30 5.15 0.00 0.48 Jul 0.48 2.85 2.30 5.15 0.00 0.48 Philippines Jun 1.80 10.80 1.50 12.85 0.00 1.25 Jul 1.80 10.80 1.50 12.85 0.00 1.25 Sel. Mideast 7/ Jun 1.16 1.67 4.33 5.99 0.02 1.14 Jul 1.16 1.67 4.33 5.99 0.02 1.14 Selected Other Burma Jun 0.58 11.00 0.00 10.63 0.75 0.20 Jul 0.58 11.00 0.00 10.63 0.75 0.20 C. Amer & Carib 8/ Jun 0.38 1.69 1.48 3.14 0.00 0.40 Jul 0.38 1.69 1.48 3.14 0.00 0.41 China Jun 44.77 141.00 1.00 141.00 0.60 45.17 Jul 44.77 141.00 1.50 141.50 0.60 45.17 Egypt Jun 0.50 3.80 0.75 4.00 0.60 0.45 Jul 0.50 4.50 0.75 4.30 0.60 0.85 Japan Jun 2.79 7.36 0.70 7.97 0.20 2.67 Jul 2.79 7.36 0.70 7.97 0.20 2.67 Mexico Jun 0.19 0.13 0.80 0.91 0.00 0.20 Jul 0.19 0.13 0.80 0.91 0.00 0.20 South Korea Jun 0.88 4.20 0.40 4.80 0.00 0.68 Jul 0.88 4.20 0.40 4.80 0.00 0.68 1/ Aggregate of local marketing years. 2/ Total foreign and world use adjusted to reflect the differences in world imports and exports. Total domestic includes both domestic use and unreported disappearance. 3/ World imports and exports may not balance due to differences in some countries. 4/ India, Pakistan, Thailand, and Vietnam. 5/ Brazil, Indonesia, Hong Kong, Cote d'Ivoire, Nigeria, Philippines, selected Middle East, and the EU-27. 6/ Trade excludes intra-trade. 7/ Selected Middle East includes Iran, Iraq, and Saudi Arabia. 8/ Central American and Caribbean countries.
  • 26.
    July 2012 WASDE - 508 - 26 World Cotton Supply and Use 1/ (Million 480-Pound Bales) Beginning Production Imports Domestic Exports Loss Ending 2010/11 Stocks Use /2 Stocks World 47.82 116.40 35.92 114.65 36.66 -0.69 49.52 United States 2.95 18.10 0.01 3.90 14.38 0.18 2.60 Total Foreign 44.87 98.29 35.91 110.75 22.29 -0.88 46.92 Major Exporters 4/ 19.32 52.25 1.93 30.37 18.70 -0.99 25.42 Central Asia 5/ 2.16 6.83 0.01 1.95 4.62 0.03 2.40 Afr. Fr. Zone 6/ 0.59 2.28 3/ 0.19 2.13 0.00 0.56 S. Hemis 7/ 6.72 15.46 0.90 5.64 5.50 -0.28 12.21 Australia 0.75 4.20 3/ 0.04 2.51 -0.15 2.55 Brazil 4.35 9.00 0.70 4.30 2.00 -0.15 7.91 India 9.37 26.40 0.45 21.05 6.00 -0.75 9.92 Major Importers 8/ 24.01 43.24 31.43 76.34 2.49 0.11 19.76 Mexico 0.63 0.73 1.20 1.65 0.35 0.03 0.54 China 15.25 30.50 11.98 46.00 0.12 0.00 11.60 EU-27 9/ 0.52 1.15 1.07 1.07 1.05 0.05 0.56 Turkey 1.93 2.11 3.35 5.60 0.15 -0.08 1.72 Pakistan 3.04 8.64 1.70 10.00 0.63 0.03 2.73 Indonesia 0.44 0.03 2.10 2.05 0.02 0.05 0.44 Thailand 0.29 3/ 1.75 1.70 0.00 0.03 0.32 Bangladesh 0.79 0.06 3.70 3.70 0.00 0.01 0.84 Vietnam 0.38 0.02 1.63 1.65 0.00 0.00 0.38 2011/12 Est. Beginning Stocks Production Imports Domestic Use Exports Loss /2 Ending Stocks World 49.52 122.71 43.55 106.59 43.40 -0.89 66.68 United States 2.60 15.57 0.02 3.30 11.60 -0.01 3.30 Total Foreign 46.92 107.14 43.53 103.29 31.80 -0.88 63.38 Major Exporters 4/ 25.42 53.63 1.14 29.45 26.80 -0.99 24.93 Central Asia 5/ 2.40 6.84 0.02 2.10 4.15 0.03 3.00 Afr. Fr. Zone 6/ 0.56 3.05 3/ 0.19 2.24 0.00 1.18 S. Hemis 7/ 12.21 15.59 0.22 5.32 9.99 -0.28 13.00 Australia 2.55 4.90 3/ 0.04 4.20 -0.15 3.36 Brazil 7.91 8.70 0.04 4.00 4.80 -0.15 8.00 India 9.92 26.50 0.60 20.50 10.00 -0.75 7.27 Major Importers 8/ 19.76 50.33 39.68 69.99 3.23 0.11 36.44 Mexico 0.54 1.24 1.00 1.65 0.35 0.03 0.75 China 11.60 33.50 23.25 41.00 0.03 0.00 27.33 EU-27 9/ 0.56 1.61 0.90 0.93 1.36 0.05 0.74 Turkey 1.72 3.25 2.30 5.30 0.30 -0.08 1.75 Pakistan 2.73 10.60 1.20 10.25 1.10 0.03 3.16 Indonesia 0.44 0.03 1.98 1.90 0.02 0.05 0.48 Thailand 0.32 3/ 1.28 1.33 0.00 0.03 0.25 Bangladesh 0.84 0.08 3.15 3.20 0.00 0.01 0.86 Vietnam 0.38 0.02 1.65 1.60 0.00 0.00 0.45 1/ Marketing year beginning August 1. Totals may not add exactly and trade may not balance due to rounding and other factors. 2/ Generally reflects cotton lost or destroyed in the marketing channel; for Australia, Brazil, China, and the United States, reflects the difference between implicit stocks based on supply less total use and indicated ending stocks. 3/ Less than 5,000 bales. 4/ Includes Egypt and Syria in addition to the countries and regions listed. 5/ Azerbaijan, Kazakhstan, Kyrgyzstan, Tajikistan, Turkmenistan, and Uzbekistan. 6/ Benin, Burkino Faso, Cameroon, Central African Republic, Chad, Cote d'Ivoire, Mali, Niger, Senegal, and Togo. 7/ Argentina, Australia, Brazil, Paraguay, South Africa, Tanzania, and Zimbabwe. 8/ In addition to the countries and regions listed, includes Hong Kong, Japan, Russia, South Korea, and Taiwan. 9/ Includes intra-EU trade.
  • 27.
    July 2012 WASDE - 508 - 27 World Cotton Supply and Use 1/ (Million 480-Pound Bales) Beginning Production Imports Domestic Exports Loss Ending 2012/13 Proj. Stocks Use /2 Stocks World Jun 67.32 115.29 36.97 109.01 36.95 -0.88 74.51 Jul 66.68 113.81 37.39 108.98 37.39 -0.88 72.39 United States Jun 3.20 17.00 0.01 3.50 11.80 0.01 4.90 Jul 3.30 17.00 0.01 3.40 12.10 0.01 4.80 Total Foreign Jun 64.12 98.29 36.97 105.51 25.15 -0.88 69.61 Jul 63.38 96.81 37.39 105.58 25.29 -0.88 67.59 filler filler filler filler filler filler filler Major Exporters 4/ Jun 25.66 49.32 1.48 30.63 20.76 -0.99 26.06 Jul 24.93 48.27 1.80 30.83 20.92 -0.99 24.23 Central Asia 5/ Jun 3.05 6.74 0.01 2.25 4.32 0.03 3.20 Jul 3.00 6.74 0.01 2.25 4.57 0.03 2.90 Afr. Fr. Zone 6/ Jun 1.15 3.12 3/ 0.19 2.68 0.00 1.40 Jul 1.18 3.12 3/ 0.19 2.78 0.00 1.32 S. Hemis 7/ Jun 13.20 13.21 0.27 5.60 9.36 -0.28 12.00 Jul 13.00 13.21 0.27 5.54 9.49 -0.28 11.72 Australia Jun 3.16 4.25 3/ 0.04 4.30 -0.15 3.22 Jul 3.36 4.25 3/ 0.04 4.50 -0.15 3.22 Brazil Jun 8.30 7.00 0.05 4.25 4.10 -0.15 7.15 Jul 8.00 7.00 0.05 4.25 4.00 -0.15 6.95 India Jun 7.77 25.00 0.70 21.25 4.00 -0.75 8.97 Jul 7.27 24.00 1.00 21.50 3.70 -0.75 7.82 filler filler filler filler filler filler filler Major Importers 8/ Jun 36.38 45.87 32.76 71.00 2.59 0.11 41.31 Jul 36.44 45.57 32.84 70.90 2.64 0.11 41.20 Mexico Jun 0.75 1.03 1.20 1.75 0.40 0.03 0.80 Jul 0.75 1.03 1.20 1.75 0.40 0.03 0.80 China Jun 27.33 30.50 13.50 40.00 0.03 0.00 31.30 Jul 27.33 30.50 13.50 39.50 0.03 0.00 31.80 EU-27 9/ Jun 0.74 1.45 0.90 0.91 1.39 0.05 0.73 Jul 0.74 1.45 0.90 0.91 1.44 0.05 0.68 Turkey Jun 1.75 2.75 3.00 5.60 0.20 -0.08 1.78 Jul 1.75 2.75 3.00 5.60 0.20 -0.08 1.78 Pakistan Jun 3.16 10.00 2.20 11.00 0.50 0.03 3.83 Jul 3.16 9.70 2.20 11.25 0.50 0.03 3.28 Indonesia Jun 0.48 0.03 2.10 2.05 0.02 0.05 0.49 Jul 0.48 0.03 2.10 2.05 0.02 0.05 0.49 Thailand Jun 0.25 3/ 1.65 1.55 0.00 0.03 0.32 Jul 0.25 3/ 1.68 1.60 0.00 0.03 0.30 Bangladesh Jun 0.86 0.09 3.60 3.60 0.00 0.01 0.94 Jul 0.86 0.09 3.60 3.60 0.00 0.01 0.94 Vietnam Jun 0.40 0.02 1.65 1.65 0.00 0.00 0.42 Jul 0.45 0.02 1.70 1.75 0.00 0.00 0.42 1/ Marketing year beginning August 1. Totals may not add exactly and trade may not balance due to rounding and other factors. 2/ Generally reflects cotton lost or destroyed in the marketing channel; for Australia, Brazil, China, and the United States, reflects the difference between implicit stocks based on supply less total use and indicated ending stocks. 3/ Less than 5,000 bales. 4/ Includes Egypt and Syria in addition to the countries and regions listed. 5/ Azerbaijan, Kazakhstan, Kyrgyzstan, Tajikistan, Turkmenistan, and Uzbekistan. 6/ Benin, Burkino Faso, Cameroon, Central African Republic, Chad, Cote d'Ivoire, Mali, Niger, Senegal, and Togo. 7/ Argentina, Australia, Brazil, Paraguay, South Africa, Tanzania, and Zimbabwe. 8/ In addition to the countries and regions listed, includes Hong Kong, Japan, Russia, South Korea, and Taiwan. 9/ Includes intra-EU trade.
  • 28.
    July 2012 WASDE - 508 - 28 World Soybean Supply and Use 1/ (Million Metric Tons) Beginning Production Imports Domestic Domestic Exports Ending 2010/11 Stocks Crush Total Stocks World 2/ 60.57 264.69 88.81 221.15 251.31 92.65 70.13 United States 4.11 90.61 0.39 44.85 48.39 40.86 5.85 Total Foreign 56.47 174.09 88.42 176.30 202.91 51.79 64.27 Major Exporters 3/ 38.90 132.87 0.07 75.00 79.75 45.86 46.24 Argentina 22.28 49.00 0.01 37.61 39.21 9.21 22.87 Brazil 16.29 75.50 0.04 35.93 38.93 29.95 22.94 Major Importers 4/ 14.27 17.62 76.86 75.89 92.70 0.27 15.78 China 13.26 15.10 52.34 55.00 65.95 0.19 14.56 EU-27 0.54 1.04 12.48 12.27 13.46 0.06 0.56 Japan 0.24 0.22 2.92 2.15 3.21 0.00 0.17 Mexico 0.05 0.17 3.50 3.63 3.66 0.00 0.05 2011/12 Est. Beginning Stocks Production Imports Domestic Crush Domestic Total Exports Ending Stocks World 2/ 70.13 235.88 90.11 223.87 253.42 90.18 52.51 United States 5.85 83.17 0.41 45.59 48.35 36.47 4.62 Total Foreign 64.27 152.70 89.70 178.28 205.08 53.71 47.89 Major Exporters 3/ 46.24 110.50 0.26 74.30 79.08 47.60 30.31 Argentina 22.87 41.00 0.00 36.50 38.10 7.80 17.97 Brazil 22.94 65.50 0.24 36.55 39.65 36.70 12.33 Major Importers 4/ 15.78 16.16 80.13 79.28 95.98 0.31 15.77 China 14.56 13.50 57.50 59.30 70.30 0.25 15.01 EU-27 0.56 1.12 11.00 11.30 12.31 0.03 0.33 Japan 0.17 0.22 2.70 1.90 2.95 0.00 0.14 Mexico 0.05 0.20 3.40 3.55 3.59 0.00 0.07 Beginning Production Imports Domestic Domestic Exports Ending Stocks Crush Total Stocks 2012/13 Proj. World 2/ Jun 53.36 271.03 95.82 234.05 264.95 96.71 58.54 Jul 52.51 267.16 94.96 232.39 263.15 95.82 55.66 United States Jun 4.77 87.23 0.41 44.77 48.18 40.42 3.80 Jul 4.62 83.01 0.41 43.82 47.21 37.29 3.54 Total Foreign Jun 48.59 183.80 95.41 189.28 216.77 56.30 54.73 Jul 47.89 184.15 94.55 188.58 215.93 58.54 52.12 Major Exporters 3/ Jun 31.16 140.80 0.07 79.10 84.08 49.40 38.55 Jul 30.31 140.80 0.28 79.10 84.08 51.30 36.01 Argentina Jun 18.47 55.00 0.01 39.80 41.45 10.10 21.93 Jul 17.97 55.00 0.01 39.80 41.45 11.10 20.43 Brazil Jun 12.68 78.00 0.04 36.80 40.00 34.20 16.52 Jul 12.33 78.00 0.25 36.80 40.00 35.10 15.48 Major Importers 4/ Jun 15.61 15.39 84.50 83.63 100.68 0.26 14.56 Jul 15.77 15.39 84.25 83.53 100.54 0.31 14.56 China Jun 14.76 12.60 61.00 63.40 74.52 0.20 13.64 Jul 15.01 12.60 61.00 63.40 74.52 0.25 13.84 EU-27 Jun 0.33 1.20 11.00 11.18 12.18 0.03 0.32 Jul 0.33 1.20 11.00 11.18 12.18 0.03 0.32 Japan Jun 0.14 0.22 2.80 1.90 2.96 0.00 0.20 Jul 0.14 0.22 2.80 1.90 2.96 0.00 0.20 Mexico Jun 0.07 0.20 3.50 3.67 3.70 0.00 0.07 Jul 0.07 0.20 3.40 3.62 3.65 0.00 0.02 1/ Data based on local marketing years except Argentina and Brazil which are adjusted to an October-September year. 2/ World imports and exports may not balance due to differences in local marketing years and to time lags between reported exports and imports. Therefore, world supply may not equal world use. 3/ Argentina, Brazil and Paraguay. 4/ China, EU-27, Japan, Mexico, and Southeast Asia (includes Indonesia, Malaysia, Philippines, Vietnam, and Thailand).
  • 29.
    July 2012 WASDE - 508 - 29 World Soybean Meal Supply and Use 1/ (Million Metric Tons) Beginning Production Imports Domestic Exports Ending 2010/11 Stocks Total Stocks World 2/ 6.42 174.54 56.40 170.20 58.79 8.38 United States 0.27 35.61 0.16 27.47 8.26 0.32 Total Foreign 6.15 138.93 56.24 142.73 50.53 8.06 Major Exporters 3/ 4.10 64.82 0.07 17.22 46.30 5.46 Argentina 1.79 29.31 0.00 0.72 27.62 2.76 Brazil 2.07 27.85 0.06 13.50 13.99 2.49 India 0.25 7.66 0.01 3.00 4.70 0.22 Major Importers 4/ 1.16 13.57 34.85 47.23 0.65 1.70 EU-27 0.50 9.68 21.71 30.72 0.61 0.55 Southeast Asia 5/ 0.39 2.24 10.93 12.66 0.04 0.86 2011/12 Est. Beginning Stocks Production Imports Domestic Total Exports Ending Stocks World 2/ 8.38 177.37 57.60 175.76 59.78 7.80 United States 0.32 36.74 0.18 28.53 8.44 0.27 Total Foreign 8.06 140.63 57.42 147.23 51.34 7.53 Major Exporters 3/ 5.46 64.58 0.06 18.05 47.13 4.92 Argentina 2.76 28.43 0.00 0.73 28.28 2.18 Brazil 2.49 28.33 0.05 13.94 14.35 2.58 India 0.22 7.82 0.01 3.38 4.50 0.16 Major Importers 4/ 1.70 12.90 35.00 47.39 0.60 1.62 EU-27 0.55 8.90 21.80 30.35 0.56 0.34 Southeast Asia 5/ 0.86 2.54 10.95 13.24 0.04 1.08 Beginning Production Imports Domestic Exports Ending Stocks Total Stocks 2012/13 Proj. World 2/ Jun 7.47 184.80 58.51 182.04 60.43 8.31 Jul 7.80 183.50 58.29 180.83 60.16 8.59 United States Jun 0.27 35.50 0.15 28.03 7.62 0.27 Jul 0.27 34.78 0.15 27.58 7.35 0.27 Total Foreign Jun 7.20 149.30 58.36 154.01 52.81 8.04 Jul 7.53 148.72 58.14 153.25 52.81 8.32 Major Exporters 3/ Jun 4.54 67.55 0.06 18.97 47.86 5.31 Jul 4.92 67.55 0.06 18.97 47.86 5.69 Argentina Jun 2.18 31.05 0.00 0.77 29.78 2.68 Jul 2.18 31.05 0.00 0.77 29.78 2.68 Brazil Jun 2.20 28.52 0.05 14.40 13.86 2.51 Jul 2.58 28.52 0.05 14.40 13.86 2.89 India Jun 0.16 7.98 0.01 3.80 4.23 0.12 Jul 0.16 7.98 0.01 3.80 4.23 0.12 Major Importers 4/ Jun 1.71 13.04 35.64 48.11 0.49 1.79 Jul 1.62 12.98 35.54 48.02 0.49 1.63 EU-27 Jun 0.40 8.81 21.90 30.26 0.45 0.40 Jul 0.34 8.81 21.90 30.26 0.45 0.34 Southeast Asia 5/ Jun 1.11 2.78 11.49 14.17 0.04 1.16 Jul 1.08 2.72 11.39 14.08 0.04 1.06 1/ Data based on local marketing years except for Argentina and Brazil which are adjusted to an October-September year. 2/ World imports and exports may not balance due to differences in local marketing years and to time lags between reported exports and imports. Therefore, world supply may not equal world use. 3/ Argentina, Brazil, and India. 4/ EU-27, Southeast Asia, and Japan. 5/ Indonesia, Malaysia, Philippines, Vietnam, and Thailand.
  • 30.
    July 2012 WASDE - 508 - 30 World Soybean Oil Supply and Use 1/ (Million Metric Tons) Beginning Production Imports Domestic Exports Ending 2010/11 Stocks Total Stocks World 2/ 3.30 41.23 9.25 40.79 9.57 3.43 United States 1.55 8.57 0.07 7.62 1.47 1.10 Total Foreign 1.76 32.67 9.17 33.17 8.10 2.33 Major Exporters 3/ 0.83 16.32 0.91 10.50 6.69 0.87 Argentina 0.20 7.18 0.00 2.51 4.56 0.31 Brazil 0.31 6.90 0.00 5.26 1.67 0.29 EU-27 0.32 2.24 0.91 2.74 0.46 0.27 Major Importers 4/ 0.51 11.89 3.98 15.43 0.16 0.80 China 0.21 9.84 1.32 11.11 0.05 0.20 India 0.26 1.68 0.95 2.60 0.00 0.29 North Africa 5/ 0.04 0.37 1.72 1.72 0.11 0.31 2011/12 Est. Beginning Stocks Production Imports Domestic Total Exports Ending Stocks World 2/ 3.43 41.91 7.77 41.82 8.30 2.98 United States 1.10 8.82 0.08 8.21 0.59 1.21 Total Foreign 2.33 33.09 7.68 33.61 7.71 1.78 Major Exporters 3/ 0.87 16.07 0.53 10.64 6.27 0.55 Argentina 0.31 6.99 0.00 2.95 4.15 0.20 Brazil 0.29 7.01 0.00 5.36 1.73 0.21 EU-27 0.27 2.07 0.53 2.33 0.40 0.14 Major Importers 4/ 0.80 12.72 3.17 15.83 0.19 0.67 China 0.20 10.62 1.23 11.71 0.06 0.28 India 0.29 1.72 0.90 2.75 0.00 0.16 North Africa 5/ 0.31 0.39 1.04 1.38 0.12 0.23 Beginning Production Imports Domestic Exports Ending Stocks Total Stocks 2012/13 Proj. World 2/ Jun 2.74 43.62 7.84 43.55 8.41 2.24 Jul 2.98 43.33 7.69 43.42 8.36 2.23 United States Jun 1.18 8.53 0.09 8.26 0.57 0.97 Jul 1.21 8.35 0.09 8.17 0.57 0.91 Total Foreign Jun 1.56 35.09 7.75 35.29 7.84 1.27 Jul 1.78 34.99 7.61 35.26 7.80 1.32 Major Exporters 3/ Jun 0.47 16.70 0.50 11.08 6.11 0.48 Jul 0.55 16.71 0.50 11.16 6.06 0.54 Argentina Jun 0.20 7.60 0.00 3.51 4.09 0.21 Jul 0.20 7.60 0.00 3.56 4.04 0.21 Brazil Jun 0.13 7.06 0.00 5.41 1.68 0.11 Jul 0.21 7.07 0.00 5.44 1.68 0.17 EU-27 Jun 0.14 2.04 0.50 2.17 0.35 0.16 Jul 0.14 2.04 0.50 2.17 0.35 0.16 Major Importers 4/ Jun 0.53 13.52 3.35 16.78 0.19 0.44 Jul 0.67 13.52 3.20 16.77 0.18 0.44 China Jun 0.25 11.35 1.30 12.51 0.06 0.32 Jul 0.28 11.35 1.30 12.55 0.06 0.32 India Jun 0.16 1.77 0.77 2.65 0.00 0.05 Jul 0.16 1.77 0.77 2.65 0.00 0.05 North Africa 5/ Jun 0.13 0.41 1.28 1.62 0.13 0.06 Jul 0.23 0.40 1.13 1.57 0.12 0.06 1/ Data based on local marketing years except for Argentina and Brazil which are adjusted to an October-September year. 2/ World imports and exports may not balance due to differences in local marketing years and to time lags between reported exports and imports. Therefore, world supply may not equal world use. 3/ Argentina, Brazil and EU-27. 4/ China, India, and North Africa. 5/ Algeria, Egypt, Morocco, and Tunisia.
  • 31.
    July 2012 WASDE - 508 - 31 U.S. Quarterly Animal Product Production 1/ Year and Quarter Beef Pork Red Meat Broiler Turkey Total Red Meat Egg Milk 2/ Poultry 3/ & Poultry Million Pounds Mil doz Bil lbs 2011 III 6,736 5,484 12,288 9,542 1,423 11,108 23,396 1,913 48.7 IV 6,490 6,186 12,745 8,860 1,495 10,480 23,225 1,944 48.7 Annual 26,195 22,758 49,232 37,201 5,791 43,513 92,745 7,655 196.2 2012 I 6,283 5,858 12,210 9,090 1,446 10,658 22,868 1,911 51.0 II 6,470 5,520 12,057 9,350 1,525 11,010 23,067 1,915 51.7 III* 6,475 5,620 12,160 9,300 1,460 10,895 23,055 1,920 49.6 IV* 5,950 6,300 12,317 9,150 1,550 10,825 23,142 1,950 49.3 Annual Jun Proj. 25,088 23,368 48,727 36,890 6,006 43,413 92,140 7,686 202.2 Jul Proj. 25,178 23,298 48,744 36,890 5,981 43,388 92,132 7,696 201.6 2013 I* 6,010 5,900 11,978 9,100 1,450 10,670 22,648 1,880 50.2 II* 6,260 5,625 11,951 9,300 1,500 10,925 22,876 1,900 51.8 Annual Jun Proj. 24,575 23,855 48,697 37,500 6,035 44,045 92,742 7,655 202.6 Jul Proj. 24,560 23,680 48,507 37,100 5,935 43,545 92,052 7,615 201.7 * Projection. 1/ Commercial production for red meats; federally inspected for poultry meats. 2/ Beef, pork, veal and lamb & mutton. 3/ Broilers, turkeys and mature chicken. U.S. Quarterly Prices for Animal Products Steers Barrows Broilers Turkeys Eggs Milk Year and Quarter 2/ and gilts 4/ 5/ 6/ 7/ 3/ Dol./cwt Dol./cwt Cents/lb. Cents/lb. Cents/doz. Dol./cwt 2011 III 114.05 71.06 78.8 106.4 117.7 21.67 IV 121.99 64.66 76.8 111.6 131.2 20.07 Annual 114.73 66.11 79.0 102.0 115.3 20.14 2012 I 125.29 61.68 87.2 100.7 108.7 17.97 II 121.91 61.79 85.9 106.9 99.7 16.37 III* 121-125 62-64 81-85 108-112 103-107 16.70-17.10 IV* 123-131 55-59 81-87 111-119 113-121 17.25-17.95 Annual Jun Proj. 123-128 59-61 85-88 107-111 104-108 16.85-17.25 Jul Proj. 123-126 60-62 84-86 107-110 106-109 17.05-17.35 2013 I* 122-132 57-61 83-89 97-105 108-118 16.65-17.65 II* 124-134 60-66 84-92 100-108 96-104 16.55-17.55 Annual Jun Proj. 124-135 57-61 82-89 99-108 100-108 17.25-18.25 Jul Proj. 124-135 58-62 83-90 101-110 102-111 17.35-18.35 *Projection. 1/ Simple average of months. 2/ 5-Area, Direct, Total all grades 3/ National Base, Live equiv 51-52% lean. 4/ Wholesale, 12- city average. 5/ 8-16 lbs, hens National. 6/ Grade A large, New York, volume buyers. 7/ Prices received by farmers for all milk.
  • 32.
    July 2012 WASDE - 508 - 32 U.S. Meats Supply and Use Beginning Production Total Ending Total Per Capita Item stocks 1/ Imports Supply Exports Stocks Use 2/ 3/ Million Pounds /4 Beef 2011 585 26,292 2,056 28,933 2,788 600 25,545 57.3 2012 Proj. Jun 600 25,184 2,437 28,221 2,623 575 25,023 55.7 Jul 600 25,274 2,477 28,351 2,588 575 25,188 56.1 2013 Proj. Jun 575 24,671 2,620 27,866 2,650 550 24,666 54.5 Jul 575Filler 24,656 Filler 2,620 Filler 27,851Filler 2,650 Filler 550 Filler 24,651 Filler 54.5 Filler Pork 2011 541 22,775 803 24,119 5,193 542 18,384 45.7 2012 Proj. Jun 542 23,385 812 24,739 5,384 625 18,730 46.2 Jul 542 23,315 812 24,669 5,404 650 18,615 46.0 2013 Proj. Jun 625 23,872 810 25,307 5,450 625 19,232 47.1 Jul 650Filler 23,697 Filler 810Filler 25,157Filler 5,450 Filler 650 Filler 19,057 Filler 46.7 Filler Total Red 2011 1,145 49,358 3,022 53,525 8,000 1,162 44,363 104.2 Meat 5/ 2012 Proj. Jun 1,162 48,853 3,396 53,411 8,020 1,223 44,168 103.1 Jul 1,162 48,870 3,436 53,468 8,005 1,248 44,215 103.2 2013 Proj. Jun 1,223 48,824 3,595 53,642 8,117 1,198 44,327 102.9 Jul 1,248Filler 48,634 Filler 3,595 Filler 53,477Filler 8,117 Filler 1,223 Filler 44,137 Filler 102.4 Filler Broiler 2011 773 36,803 107 37,683 6,991 590 30,102 82.9 2012 Proj. Jun 590 36,495 102 37,187 7,037 650 29,500 80.6 Jul 590 36,495 102 37,187 7,137 650 29,400 80.4 2013 Proj. Jun 650 37,099 104 37,853 6,975 670 30,208 82.0 Jul 650Filler 36,703 Filler 104Filler 37,457Filler 7,125 Filler 670 Filler 29,662 Filler 80.5 Filler Turkey 2011 192 5,715 21 5,928 703 211 5,014 16.1 2012 Proj. Jun 211 5,927 21 6,159 726 250 5,183 16.5 Jul 211 5,903 21 6,135 746 250 5,139 16.3 2013 Proj. Jun 250 5,956 20 6,226 730 225 5,271 16.6 Jul 250Filler 5,857 Filler 20Filler 6,127Filler 730Filler 225 Filler 5,172 Filler 16.3 Filler Total 2011 969 43,039 130 44,137 7,786 803 35,548 100.3 Poultry 6/ 2012 Proj. Jun 803 42,939 125 43,867 7,843 903 35,121 98.5 Jul 803 42,914 125 43,842 7,963 903 34,976 98.1 2013 Proj. Jun 903 43,564 126 44,593 7,795 899 35,899 99.9 Jul 903Filler 43,070 Filler 126Filler 44,099Filler 7,945 Filler 899 Filler 35,255 Filler 98.2 Filler Red Meat & 2011 2,114 92,397 3,151 97,662 15,786 1,965 79,911 204.6 Poultry 2012 Proj. Jun 1,965 91,792 3,521 97,278 15,863 2,126 79,289 201.6 Jul 1,965 91,785 3,561 97,311 15,968 2,151 79,192 201.3 2013 Proj. Jun 2,126 92,388 3,721 98,235 15,912 2,097 80,226 202.8 Jul 2,151 91,703 3,721 97,575 16,062 2,122 79,391 200.6 1/ Total including farm production for red meats and, for poultry, federally inspected plus non-federally inspected, less condemnations. 2/ Pounds, retail-weight basis. 3/ Population source: Dept. of Commerce, Census Bureau. 4/ Carcass weight for red meats and certified ready-to-cook weight for poultry. 5/ Beef, pork, veal, lamb and mutton. 6/ Broilers, turkeys and mature chicken.
  • 33.
    July 2012 WASDE - 508 - 33 U.S. Egg Supply and Use 2010 2011 2012 Proj. 2012 Proj. 2013 Proj. 2013 Proj. Commodity Jun Jul Jun Jul Eggs Million Dozen Supply Beginning Stocks 18.0 19.3 27.7 27.7 26.0 26.0 Production 7,630.0 7,655.0 7,686.0 7,696.0 7,655.0 7,615.0 Imports 11.8 20.9 21.1 21.1 24.0 24.0 Total Supply 7,659.8 7,695.2 7,734.8 7,744.8 7,705.0 7,665.0 Use Exports 258.4 275.3 262.9 262.9 266.0 266.0 Hatching Use 982.2 952.1 940.0 945.0 950.0 950.0 Ending Stocks 19.3 27.7 26.0 26.0 26.0 26.0 Disappearance Total 6,399.9 6,440.1 6,505.9 6,510.9 6,463.0 6,423.0 Per Capita (number) 247.9 247.7 248.4 248.6 245.0 243.5 Total U.S. Milk Supply and Use 2010 2011 2012 Proj. 2012 Proj. 2013 Proj. 2013 Proj. Commodity Jun Jul Jun Jul Milk Billion Pounds Production 192.8 196.2 202.2 201.6 202.6 201.7 Farm Use 1.0 1.0 1.0 1.0 1.0 1.0 Fat Basis Supply Beg. Commercial Stocks 11.2 10.8 10.9 10.9 11.8 11.7 Marketings 191.9 195.3 201.2 200.6 201.6 200.7 Imports 4.1 3.5 3.3 3.5 3.3 3.4 Total Cml. Supply 207.2 209.6 215.5 215.0 216.7 215.8 Fat Basis Use Commercial Exports 8.5 9.5 8.9 9.3 9.1 9.2 Ending Commercial Stks 10.8 10.9 11.8 11.7 11.5 11.5 CCC Net Removals 1/ 0.2 0.0 0.0 0.0 0.0 0.0 Commercial Use 2/ 187.6 189.2 194.8 194.0 196.1 195.1 Skim-solid Basis Supply Beg. Commercial Stocks 11.2 12.2 11.8 11.8 12.0 12.0 Marketings 191.9 195.3 201.2 200.6 201.6 200.7 Imports 4.8 5.3 5.0 4.9 4.9 4.7 Total Cml. Supply 207.9 212.7 218.1 217.3 218.5 217.4 Skim-solid Basis Use Commercial Exports 30.4 32.7 32.1 32.4 32.8 32.9 Ending Commercial Stks 12.2 11.8 12.0 12.0 12.0 12.0 CCC Net Removals 1/ 0.0 0.0 0.0 0.0 0.0 0.0 Commercial Use 2/ 165.7 168.2 174.0 172.9 173.8 172.4 Filler Million Pounds CCC product net removals 1/ Butter 8 0 0 0 0 0 Cheese 0 0 0 0 0 0 Nonfat Dry Milk 0 0 0 0 0 0 Dry Whole Milk 0 0 0 0 0 0 Total Note: Totals may not add due to rounding. 1/ Includes products exported under the Dairy Export Incentive Program. 2/ Domestic commercial use only. The years 2009 and 2010 are adjusted for the Barter Program.
  • 34.
    July 2012 WASDE - 508 - 34 U.S. Dairy Prices 2010 2011 2012 Proj. 2012 Proj. 2013 Proj. 2013 Proj. Commodity Jun Jul Jun Jul Product Prices 1/ Dollars Per Pound Cheese 1.5226 1.8246 1.565- 1.590- 1.600- 1.605- 1.605 1.620 1.700 1.705 Butter 1.7020 1.9498 1.430- 1.470- 1.465- 1.465- 1.500 1.530 1.595 1.595 Nonfat Dry Milk 1.1687 1.5058 1.210- 1.210- 1.320- 1.320- 1.250 1.240 1.390 1.390 Dry Whey 0.3716 0.5325 0.540- 0.540- 0.555- 0.555- 0.560 0.560 0.585 0.585 Filler Dollars Per Cwt Milk Prices 2/ Class III 14.41 18.37 15.75- 16.00- 16.20- 16.25- 16.15 16.30 17.20 17.25 Class IV 15.09 19.04 14.35- 14.55- 15.40- 15.40- 14.85 14.95 16.50 16.50 All Milk 3/ 16.26 20.14 16.85- 17.05- 17.25- 17.35- 17.25 17.35 18.25 18.35 1/ Simple average of monthly prices calculated by AMS from NASS weekly average dairy product prices for class price computations. 2/ Annual Class III and Class IV prices are the simple averages of monthly minimum Federal order milk prices paid by regulated plants for milk used in the respective classes. All milk price is the simple average of monthly prices received by farmers for milk at average test. 3/ Does not reflect any deductions from producers as authorized by legislation.
  • 35.
    July 2012 WASDE - 508 - 35 Note: Tables on pages 35-37 present a record of the July projection and the final Estimate. Using world wheat production as an example, the "root mean square error" means that chances are 2 out of 3 that the current forecast will not be above or below the final estimate by more than 3.0 percent. Chances are 9 out of 10 (90% confidence level) that the difference will not exceed 5.0 percent. The average difference between the July projection and the final estimate is 14.3 million tons, ranging from 1.0 million to 34.6 million tons. The July projection has been below the estimate 18 times and above 13 times. Reliability of July Projections 1/ Differences between forecast and final estimate 90 percent Years Commodity and Root mean confidence Below Above Region square error interval Average Smallest Largest Final Final WHEAT Percent Million Metric Tons Production World 3.0 5.0 14.3 1.0 34.6 18 13 U.S. 3.7 6.3 1.7 0.2 6.2 13 18 Foreign 3.2 5.5 13.9 0.3 34.7 19 12 Exports World 6.0 10.2 5.9 0.2 18.7 19 12 U.S. 11.5 19.5 2.8 0.2 10.0 19 12 Foreign 7.3 12.4 5.4 0.1 21.3 20 11 Domestic Use World 2.1 3.6 9.4 1.6 25.7 19 12 U.S. 7.2 12.2 1.8 0.0 5.0 12 19 Foreign 2.1 3.5 8.8 1.3 26.9 21 10 Ending Stocks World 10.4 17.7 12.1 0.1 35.3 21 10 U.S. 20.0 33.9 3.4 0.2 13.9 16 15 Foreign 11.0 18.6 10.5 2.3 31.7 21 10 COARSE GRAINS 2/ Production World 2.9 4.9 20.5 3.7 68.4 16 15 U.S. 10.5 17.9 15.9 0.6 57.7 14 17 Foreign 2.5 4.2 12.6 1.1 37.9 15 16 Exports World 7.5 12.7 6.7 0.6 18.2 21 10 U.S. 17.6 29.9 7.4 0.2 20.9 11 20 Foreign 15.0 25.4 6.8 1.4 19.7 20 11 Domestic Use World 1.6 2.8 11.9 0.0 26.7 16 15 U.S. 4.8 8.2 7.2 0.3 22.2 20 11 Foreign 1.8 3.1 9.2 1.0 30.5 17 14 Ending Stocks World 18.7 31.8 19.2 1.6 60.2 19 12 U.S. 40.9 69.3 13.8 0.5 50.5 12 19 Foreign 14.9 25.2 11.1 0.2 29.2 22 9 RICE, milled Production World 2.6 4.4 7.4 0.4 24.0 20 11 U.S. 4.8 8.1 0.2 0.0 0.6 16 13 Foreign 2.6 4.5 7.4 0.5 24.3 20 11 Exports World 9.6 16.3 1.5 0.0 6.7 22 9 U.S. 10.9 18.4 0.2 0.0 1.0 15 12 Foreign 10.5 17.8 1.5 0.0 6.5 22 9 Domestic Use World 2.2 3.7 5.1 0.2 22.9 20 11 U.S. 8.8 14.9 0.2 0.0 0.5 12 19 Foreign 2.2 3.7 5.1 0.2 22.9 20 11 Ending Stocks World 14.3 24.2 5.0 0.1 15.6 23 8 U.S. 30.3 51.4 0.3 0.0 1.0 18 12 Foreign 15.8 26.8 5.1 0.2 16.5 24 7 1/ Footnotes at end of table. CONTINUED
  • 36.
    July 2012 WASDE - 508 - 36 Reliability of July Projections (Continued) Differences between forecast and final estimate 90 percent Years Commodity and Root mean confidence Below Above Region square error interval Average Smallest Largest Final Final SOYBEANS Percent Million Metric Tons Production World 5.4 9.2 7.2 0.7 26.9 14 17 U.S. 7.4 12.6 3.5 0.2 11.7 15 16 Foreign 8.1 13.8 6.7 1.0 25.8 16 15 Exports World 8.3 14.2 3.2 0.0 10.7 18 13 U.S. 13.7 23.2 2.7 0.1 6.8 18 13 Foreign 21.8 36.9 2.6 0.0 10.5 16 15 Domestic Use World 4.1 6.9 5.3 0.7 16.1 19 12 U.S. 5.7 9.6 1.8 0.0 4.9 19 12 Foreign 4.4 7.5 4.4 0.6 11.2 18 13 Ending Stocks World 15.4 26.1 3.5 0.0 13.6 19 12 U.S. 53.0 90.0 2.7 0.0 8.2 10 21 Foreign 19.9 33.7 3.8 0.0 15.4 20 11 COTTON Million 480-Pound Bales Production World 5.6 9.6 3.6 0.0 14.9 18 13 U.S. 10.3 17.5 1.4 0.1 5.3 18 13 Foreign 5.8 9.8 2.9 0.0 12.1 16 14 Exports World 10.6 17.9 2.2 0.1 11.6 16 15 U.S. 29.5 50.1 1.3 0.1 3.6 19 12 Foreign 14.1 23.9 1.7 0.0 9.8 13 18 Domestic Use World 4.5 7.6 3.2 0.1 15.4 14 17 U.S. 9.9 16.7 0.6 0.0 1.4 16 14 Foreign 4.6 7.8 3.1 0.2 14.6 14 17 Ending Stocks World 17.6 29.8 6.0 0.2 16.3 21 10 U.S. 42.3 71.8 1.6 0.1 4.9 15 16 Foreign 17.1 29.0 5.0 0.5 16.1 22 9 1/ Marketing years 1981/82 through 2011/12 for grains, soybeans, and cotton. Final for grains, soybeans, and cotton is defined as the first November estimate following the marketing year for 1981/82 through 2010/11, and for 2011/12 last month's estimate. 2/ Includes corn, sorghum, barley, oats, rye, millet, and mixed grain.
  • 37.
    July 2012 WASDE - 508 - 37 Reliability of United States July Projections 1/ Differences between forecast and final estimate 90 percent Years Root mean confidence Below Above square error interval Average Smallest Largest Final Final CORN Percent Million Bushels Production 11.7 19.8 572 12 2,034 17 14 Exports 18.1 30.7 266 0 775 11 18 Domestic Use 5.3 8.9 281 10 770 20 11 Ending Stocks 50.9 86.3 495 11 1,840 13 18 SORGHUM Production 18.5 31.3 74 3 213 16 15 Exports 36.8 62.5 42 0 118 14 16 Domestic Use 17.5 29.7 50 3 139 13 18 Ending Stocks 62.8 106.6 53 0 174 11 19 BARLEY Production 8.5 14.3 24 0 87 10 20 Exports 61.8 104.9 16 0 92 18 12 Domestic Use 10.9 18.4 28 0 87 13 17 Ending Stocks 24.3 41.3 31 1 114 12 19 OATS Production 12.8 21.7 23 0 144 5 25 Exports 100.5 170.6 1 0 8 8 10 Domestic Use 6.6 11.1 18 0 67 9 20 Ending Stocks 18.2 30.8 15 2 68 14 17 SOYBEAN MEAL Thousand Short Tons Production 5.7 9.6 1,325 118 4,432 21 10 Exports 16.2 27.4 888 81 2,450 17 14 Domestic Use 6.1 10.4 971 76 4,470 15 16 Ending Stocks 44.5 75.5 59 0 413 10 16 SOYBEAN OIL Million Pounds Production 5.3 9.0 630 81 2,130 21 10 Exports 36.5 61.9 433 0 1,575 17 13 Domestic Use 4.5 7.7 466 0 2,300 17 13 Ending Stocks 42.5 72.2 512 106 1,568 17 14 ANIMAL PROD. 3/ Million Pounds Beef 4.5 7.8 898 83 2,677 13 5 Pork 2.9 5.0 383 39 1,372 10 8 Broilers 2.4 4.2 686 184 1,338 7 11 Turkeys 3.7 6.5 156 2 444 9 9 Million Dozen Eggs 1.2 2.1 67 4 184 12 6 Billion Pounds Milk 1.8 3.1 2.5 0.2 7.0 11 7 1/ See pages 35 and 36 for record of reliability for U.S. wheat, rice, soybeans, and cotton. Marketing years 1981/82 through 2011/12 for grains, soybeans, and cotton. Final for grains, soybeans, and cotton is defined as the first November estimate following the marketing year for 1981/82 through 2010/11, and for 2011/12 last month's estimate. Calendar years 1995 through 2012 for meats, eggs, and milk. Final for animal products is defined as latest annual production estimate published by NASS for 1995-2011, and for 2012 last month's estimate.
  • 38.
    WASDE-508-38 Related USDA Reports The WASDE report incorporates information from a number of statistical reports published by USDA and other government agencies. In turn, the WASDE report provides a framework for more detailed reports issued by USDA’s Economic Research Service and Foreign Agricultural Service. For more information on how the WASDE report is prepared, go to: http://www.usda.gov/oce/commodity/wasde. Supply and Demand Database The Foreign Agricultural Service publishes Production, Supply, and Demand Online, a comprehensive database of supply and demand balances by commodity for 190 countries and regions at http://www.fas.usda.gov/psd/online. Data for grains, oilseeds, and cotton are updated monthly and data for other commodities are updated less frequently. Foreign Production Assessments Preliminary foreign production assessments and satellite imagery analysis used to prepare the WASDE report are provided by the Production Estimates and Crop Assessment Division (PECAD) of the Foreign Agricultural Service. PECAD is located at www.pecad.fas.usda.gov/. Metric Conversion Factors 1 Hectare = 2.4710 Acres 1 Kilogram = 2.20462 Pounds Metric-Ton Equivalent = Domestic Unit Factor Wheat & Soybeans bushels .027216 Rice cwt .045359 Corn, Sorghum, & Rye bushels .025401 Barley bushels .021772 Oats bushels .014515 Sugar short tons .907185 Cotton 480-lb bales .217720
  • 40.
    UNITED STATES DEPARTMENTOF AGRICULTURE FIRST-CLASS MAIL WORLD AGRICULTURAL OUTLOOK BOARD POSTAGE & FEES PAID WASHINGTON, D.C. 20250-3812 USDA ___________________ PERMIT NO. G-289 OFFICIAL BUSINESS Penalty for Private Use, $300 World Agricultural Supply and Demand Estimates WASDE-508 – July 11, 2012 Electronic Subscriptions: Download the WASDE report at http://usda.mannlib.cornell.edu/. Get a free e-mail subscription to the WASDE and other USDA crop reports at http://usda.mannlib.cornell.edu. Select the “Reports by E-Mail” bar to sign up. Print Subscriptions: For print subscriptions, call the National Technical Information Service (NTIS) at 1-800-999-6779 or 703-605-6220. The U.S. Department of Agriculture (USDA) prohibits discrimination in all its programs and activities on the basis of race, color, national origin, gender, religion, age, disability, political beliefs, sexual orientation, and marital or family status. (Not all prohibited bases apply to all programs.) Persons with disabilities who require alternative means for communication of program information (Braille, large print, audiotape, etc.) should contact USDA’s TARGET Center at 202- 720-2600 (voice and TDD). To file a complaint of discrimination, write USDA, Director, Office of Civil Rights, Room 326-W, Whitten Building, 1400 Independence Avenue, SW, Washington, D.C. 20250-9410 or call (202) 720-5964 (voice or TDD). USDA is an equal opportunity provider and employer.