Download to read offline


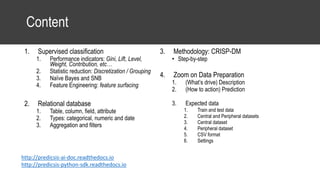


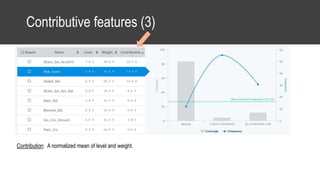
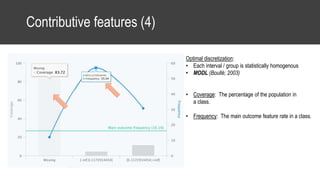
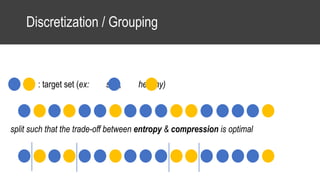
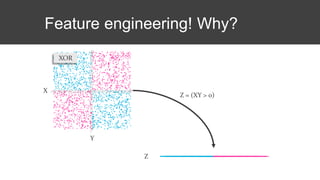
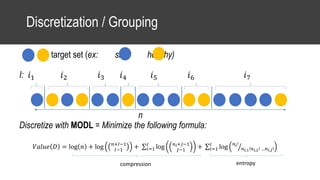
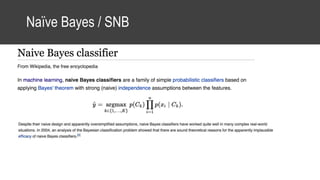
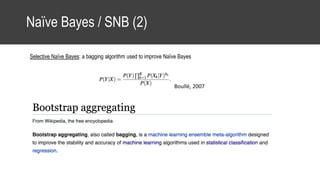
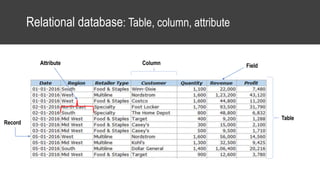
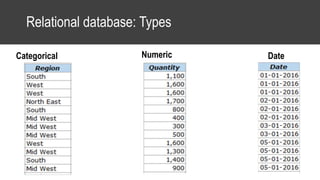
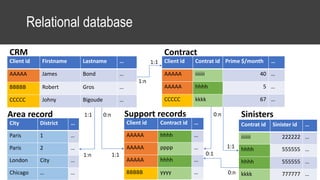


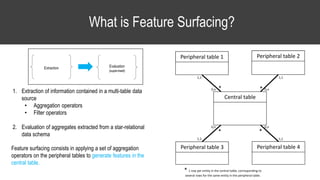
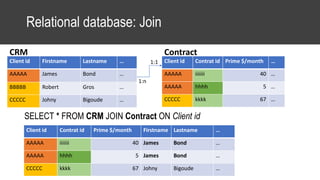
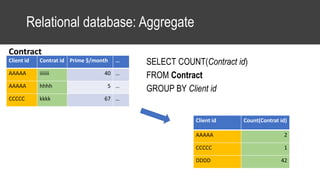
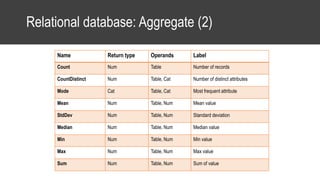
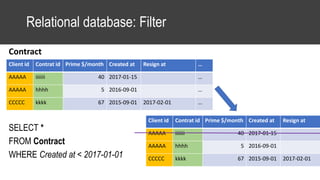
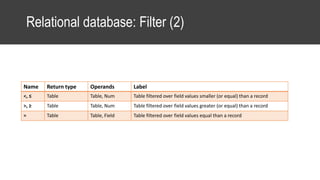

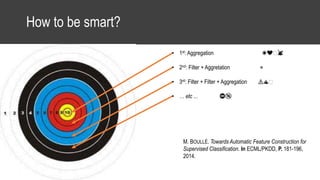
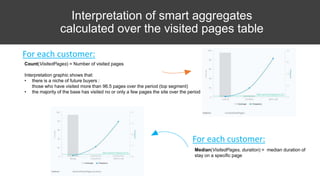
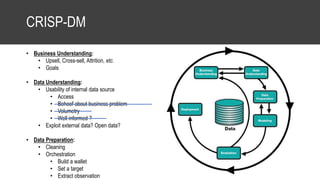
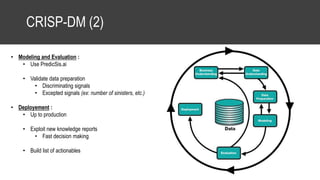
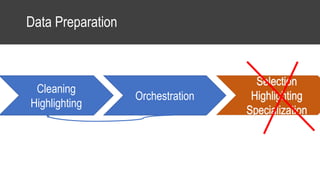
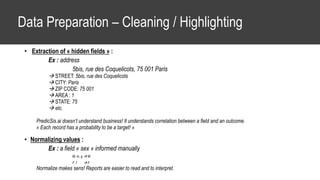

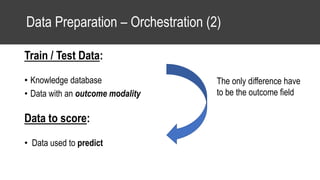
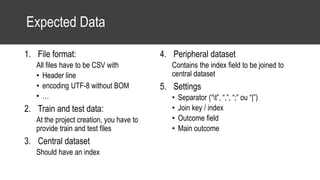

The document provides an overview of data science basics and supervised classification techniques including performance indicators, statistical reduction methods like discretization and grouping, naive Bayes and selective naive Bayes models, and feature engineering. It also discusses relational databases, including table structures, data types, aggregation, filtering, and joins. Finally, it introduces the CRISP-DM methodology and provides details on data preparation steps like cleaning, highlighting, and orchestration of training and test datasets.