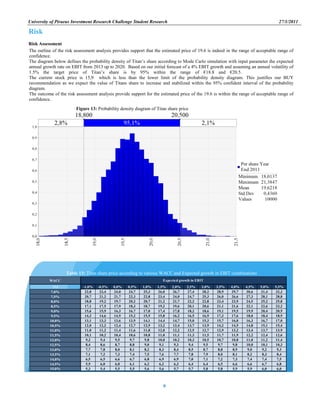
1. This report recommends buying shares of TITAN cement, as it is currently undervalued by 15% based on current market conditions in Greece.
2. TITAN has transformed into a truly multinational company with activities in both emerging and mature markets, offsetting negative impacts from regions affected by the financial crisis like Greece.
3. TITAN's strongest growing region over the past two years has been EastMed, offsetting declines elsewhere and representing the company's main source of cash flow and profits. Prospects in EastMed remain extremely positive.

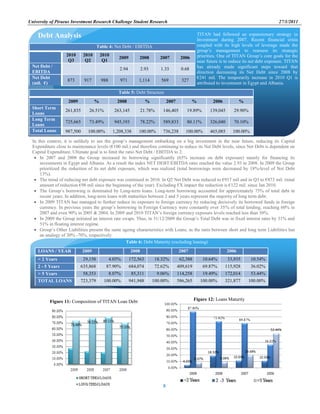


![[Eng] dry composite sliding bearings producer blind profile](https://cdn.slidesharecdn.com/ss_thumbnails/engdrycompositeslidingbearingsproducer-blindprofile-130203145431-phpapp01-thumbnail.jpg?width=640&height=640&fit=bounds)

