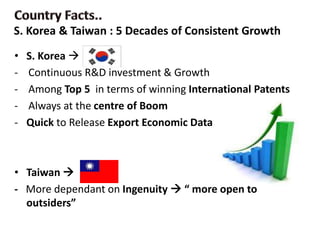
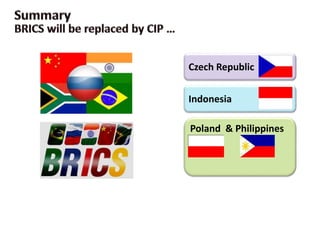
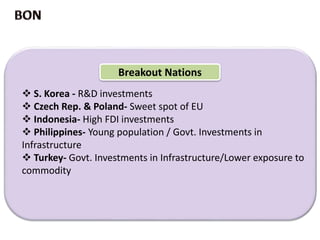
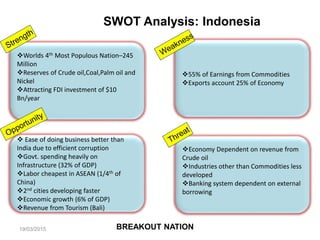
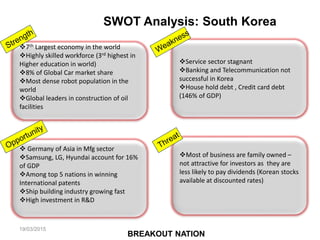
19/03/2015
Automotive and Farm Equipment Sectors
 Countries beating Growth Expectations
 Best for Investors with 3-5 yrs of Investment horizon
• GDP Growth
• Political Environment
• Govt. Investments & Infrastructure spending
• Development of Tier-II Cities
• FDI & Exports
• Innovation (R&D Expenditure)
• No of billionaires
Trends analyzed by
Touchy-feel Stuff
Macro-Economic Indicators
GDP Growth
• Per Capita income
-1.5K India – 5 % Growth Very Poor
-11K Brazil – 5 % Growth  Good
-50 K US – 3% Growth  Spectacular
• ‘Cheap’ In-Country prices is good
• Low prices  Indicative of Competition
$ 4000-$ 5000 Growth rate slows down e.g. China ($ 6000)
Political Environment
• Regardless of regime , Quality of Leadership matters
(50 % Democratic & 50 % Autocratic among nations analyzed )
• Govt. spending in Infrastructure as % of GDP
- Brazil- Low %  Stability at any Cost
- China-High % Growth at any Cost
Govt. Investments & Infrastructure Spending
Development of Tier II cities
• Economic output should not be focused in one Central Hub
(Thailand  Bangkok problematic..)
• Local Companies Expanding / Investing Abroad :
- India
- S. Africa
- Malaysia
FDI & Exports
Troubling sign!!
No of Billionaires
• More no of New Billionaires in a Nation
• From Govt. Patronage Sectors
• Different Production Groups
• India Billionaire Club : Same faces every year
• S. Korea 
- Continuous R&D investment & Growth
- Among Top 5 in terms of winning International Patents
- Always at the centre of Boom
- Quick to Release Export Economic Data
• Taiwan 
- More dependant on Ingenuity  “ more open to
outsiders”
S. Korea & Taiwan : 5 Decades of Consistent Growth
• Indonesia 
- Attracting FDI investment : $10 Bn/year
- Heavy Govt. Spend on
Infrastructure (32% of GDP)
- Labor cheapest in ASEAN (1/4th of China)
- Fast development of Tier-II cities
- 4th most populous country
- Tourism Revenue
- Reserves of Crude oil , Coal, Palm oil
and Nickel
On the Tiger Road : Indonesia
• Advantage:
- Poland
- Czech Rep
Currency is not “Euro”
But part of “EU”
The Sweet Spot Of EU..
• Russia/Brazil High Dependence on Commodity Exports
• Turkey No Commodity export
Commodity export..
• Central Bank tries to control 3 major factors :
 Inflation
 Exchange Rate
 Capital Flows
• Interest rate  Controlled inflation
• Interest rate  Exchange rate goes up..
• Controlling all 3 “ Whack -a -mole”
• Long –Term Economic Forecasts are futile
• Every decade has been defined by some idea
• Winners of one decade are often not the winners of next
• Generally countries with lower base rate of per capita
have potential to grow fast
• But may not grow at the same rate in decades…
• R&D Spending High , Innovation  USA, S. Korea , Taiwan
• Former Economic leaders slowing down (China, Japan)
• All time Winner S. Korea & Taiwan
Czech Republic
Indonesia
Poland & Philippines
Less potential to become Breakout Nations
 Thailand- Polarization in Bangkok
 S. Africa- Oligopolies Domination/Stagnant Economy
 Malaysia- Labor import/ Brain drain
 Vietnam- Poor Infrastructure & lack of skilled labor
 Russia- Negative FDI/Corruption/ Commodity Export
 Mexico - Social Inequality/ US Proximity
 Brazil- Commodity Export
 China- 6000 $ per capita Growth likely to slow down
 India- Corruption/ High Context Society
50 %
Chance
Breakout Nations
 S. Korea - R&D investments
 Czech Rep. & Poland- Sweet spot of EU
 Indonesia- High FDI investments
 Philippines- Young population / Govt. Investments in
Infrastructure
 Turkey- Govt. Investments in Infrastructure/Lower exposure to
commodity
Worlds 4th Most Populous Nation–245
Million
Reserves of Crude oil,Coal,Palm oil and
Nickel
Attracting FDI investment of $10
Bn/year
55% of Earnings from Commodities
Exports account 25% of Economy
Economy Dependent on revenue from
Crude oil
Industries other than Commodities less
developed
Banking system dependent on external
borrowing
 Ease of doing business better than
India due to efficient corruption
Govt. spending heavily on
Infrastructure (32% of GDP)
Labor cheapest in ASEAN (1/4th of
China)
2nd cities developing faster
Economic growth (6% of GDP)
Revenue from Tourism (Bali)
SWOT Analysis: Indonesia
BREAKOUT NATION19/03/2015
7th Largest economy in the world
Highly skilled workforce (3rd highest in
Higher education in world)
8% of Global Car market share
Most dense robot population in the
world
Global leaders in construction of oil
facilities
Service sector stagnant
Banking and Telecommunication not
successful in Korea
House hold debt , Credit card debt
(146% of GDP)
Most of business are family owned –
not attractive for investors as they are
less likely to pay dividends (Korean stocks
available at discounted rates)
 Germany of Asia in Mfg sector
Samsung, LG, Hyundai account for 16%
of GDP
Among top 5 nations in winning
International patents
Ship building industry growing fast
High investment in R&D
SWOT Analysis: South Korea
BREAKOUT NATION
19/03/2015
 No Govt. debt
 Small and Medium sized competitive
companies
Well managed govt.& good Local Banks
Only nation in Eastern Europe to have
preserved their brand Skoda (Arm of
VW, but independent in design and
Engg.)
Not willing to joint EU due to Euro-
zone crisis
Dependent on Germany for Exports
Economy vulnerable to EU crisis
 Czech currency Koruna is stable and
inexpensive (Good for exports)
Labor cost is 27% cheaper than
Western Europe
Productivity cost is 40% lower than
Western Europe
SWOT Analysis: Czech Republic
BREAKOUT NATION19/03/2015
Current GDP growth of 11%
Stable govt.
Govt. debt 40% of GDP (EU norm <60%
of GDP) 
Population – 79 Million (Avg age 29 yrs)
2nd largest construction industry after
China
80% Govt. Revenue comes from Tax on
industries like Telecom, Automobile&
Gasoline.
Cars more expensive in Turkey than
Europe ( for Automobile imports)
Economy vulnerable to EU crisis
Economy vulnerable to Middle east
political instability
 Turkish Lira stable due to less interest
rates
Exports competitive due to stable Lira
Govt. investing heavily in Infrastructure
FORD,FIAT to move European
operations to Turkey due to inexpensive
labor (labor 75% cheaper than W Europe)
SWOT Analysis: Turkey
BREAKOUT NATION19/03/2015
 Debt free country
 Small and Medium sized competitive
companies
 Talented workforce
Good banking system
Central bank is independent of Political
interference
Quality consumer brands presence
Not willing to joint EU due to Euro-
zone crisis
Dependent on Western Europe for
Exports
 Poland currency Zloty is stable and
inexpensive
Labor cost is 27% cheaper than
Western Europe
SWOT Analysis: Poland
BREAKOUT NATION19/03/2015
Highly literate population
Key Shipping route pass through
Colombo
Revenue from Tourism
Crude oil reserves
High Govt. debt (80% of GDP)
Business climate rank by World Bank
102nd /180
Post war instability
China investing in Infrastructure (ports)
can act as trade barrier for India
Govt. spend rising in infrastructure
post war
MNC interested in IT outsourcing,
Back office
Banking and Retail MNC
Increase in Cargo traffic at Colombo
port
Oil exploration off west coast by
Reliance – Revenue from Crude oil
SWOT Analysis: Sri Lanka
VERY LIKELY TO BE A BREAKOUT
19/03/2015
Highly Skilled Population
Thai corporations not dependent on
external borrowing
40% workforce working in Agriculture
(out ot 60 million population)
High dependence on Exports (30% of
GDP)
2nd cities not developed
Political Instability.
Biggest exporter of Cars (1
Million/year) after Japan and S Korea in
Asia
Good Infrasturture
Revenue from Tourism
SWOT Analysis: Thailand
NOT A BREAKOUT
NATION
19/03/2015
Young Population (60% of population
under 25)
Good per capita income $8000
Rich in Natural resources like Rubber &
Palm oil
Delay in Execution of projects
Less skilled workforce
Less attractive to investors
Mfg exports decreasing as Malaysia has
to import labor
Brain Drain of Skilled population
Govt. spend rising in infrastructure
(28% of GDP)
Rubber and Commodity exports
Less govt. debt (50% of GDP)
SWOT Analysis: Malaysia
NOT A BREAKOUT
NATION
19/03/2015
 Top exporter of iron ore, Sugar, Coffee,
Soybeans, poultry.
 2 Mn barrels/year oil production
 Brazilian stocks are one of the hottest
Rose 300 % in $ terms in the last decade
 Slow Growth Rate since 1980’s
One of the closed economies till date
 Total imports and exports account for
only 15 % of the GDP
Trade as a share of GDP one of the
lowest among emerging Nations(only 20
%)
 One of the most costliest and
overhyped economies
 Poor productivity growth rate (0.2 %
btw 1980-2008)
 Poor New Infrastructure investment
 imports growing more than exports
recently.
 Struggling to grow even 4% a year
 Recently recognized as World’s tenth
largest oil reserves.
 Huge foreign currency flowing in.
 Rising Stock markets
SWOT Analysis: Brazil
19/03/2015
 One of the hottest Stock Markets
 Becoming Multinationals by making
huge profits at home
 Avg Per Capita Income( $11000)
 Concentration of Business in Top
Families
 Stagnant Economy-Power of
Oligopolies
 Local economy not listed in Stock
Market
 High Corruption
 Poor Security System
 One Party Rule & capture of
important positions by the same
 Labor Laws very Pro worker
 Social Inequality
 High Drug trafficking & kidnapping
 Heavily dependent on US Economy
 Highest Migration Rate since 2006
 Competitive labor rates & in proximity
to US – Ray of Hope for Manufacturing
Sector
SWOT Analysis: Mexico
19/03/2015
Young Population–90 Million (50%
below 21 yrs
5th largest Reserves of Crude oil,
Copper, Nickel, Gold & Silver
$9 Bn BPO industry (Good English
speaking population)
Consumption 80% of GDP (Higher than
USA)
Poor Infrastructure
High dependence on NRI income (10%
of GDP)
Unstable Govt.
High Emigration.
 Revenue from Tourism
Increasing Per capita income $2500
Govt. spending increasing in
Infrastructure and Industries 
SWOT Analysis: Philippines
NOT A BREAKOUT
NATION
19/03/2015
 Abundance of Crude Oil & Natural Gas
 Stable Government
 Ranked 3rd in world for no of
Billionaires(100)
 Poor Infrastructure
 High Inflation
 Poor Growth of Auto, Real Estate &
Consumer Industries
 Weak Banking System
 Ageing population
 Corruption in Public sectors
 Govt. Income Highly dependent on oil
 No Small & Medium Enterprises
 No Global Presence of Russian Brands
 Net FDI is negative
Good R&D and Innovation capabilities
 No Govt. Restrictions in Retail ,
Internet & Media investments
 Reduction in Govt. Stakes in
companies
 Increase in immigrants from Eastern
Europe
SWOT Analysis: Russia
19/03/2015
Good per capita income $8000
Worlds largest reserves of Platinum,
Manganese,Gold,Iron ore and Coal
Unemployment (25% of Population)
Frequent Labor strikes
Wages Increasing higher than Inflation
Economy stagnant (3% of GDP)
Oligopolies dominate Industry
High Govt.debt.($750 Bn for Insurance
, pension)
Productivity in Mfg decreasing
Exports of Gold and Platinum
Growth in Mining and Mfg
Demand for Automobiles
SWOT Analysis: South Africa
NOT A BREAKOUT
NATION
19/03/2015
Crude oil reserves
54 Sea ports
Population – 90 million
Very poor Infrastructure
Lack of skilled labor
High interest rates (24%)
High Inflation (20%)
Sea Ports underdeveloped
Vietnamese Dong highly unstable
Political inclination towards
communism
 Revenue from Oil exploration
Govt. spend rising in infrastructure
Revenue from Shipping (54 ports)
Low cost Mfg hub for electronic
products (Intel plant)
SWOT Analysis: Vietnam
NOT A BREAKOUT NATION
19/03/2015

Breakout nations

  • 1.
  • 2.
    Automotive and FarmEquipment Sectors
  • 3.
     Countries beatingGrowth Expectations  Best for Investors with 3-5 yrs of Investment horizon
  • 4.
    • GDP Growth •Political Environment • Govt. Investments & Infrastructure spending • Development of Tier-II Cities • FDI & Exports • Innovation (R&D Expenditure) • No of billionaires Trends analyzed by Touchy-feel Stuff Macro-Economic Indicators
  • 5.
    GDP Growth • PerCapita income -1.5K India – 5 % Growth Very Poor -11K Brazil – 5 % Growth  Good -50 K US – 3% Growth  Spectacular • ‘Cheap’ In-Country prices is good • Low prices  Indicative of Competition $ 4000-$ 5000 Growth rate slows down e.g. China ($ 6000)
  • 6.
    Political Environment • Regardlessof regime , Quality of Leadership matters (50 % Democratic & 50 % Autocratic among nations analyzed ) • Govt. spending in Infrastructure as % of GDP - Brazil- Low %  Stability at any Cost - China-High % Growth at any Cost Govt. Investments & Infrastructure Spending
  • 7.
    Development of TierII cities • Economic output should not be focused in one Central Hub (Thailand  Bangkok problematic..) • Local Companies Expanding / Investing Abroad : - India - S. Africa - Malaysia FDI & Exports Troubling sign!!
  • 8.
    No of Billionaires •More no of New Billionaires in a Nation • From Govt. Patronage Sectors • Different Production Groups • India Billionaire Club : Same faces every year
  • 9.
    • S. Korea - Continuous R&D investment & Growth - Among Top 5 in terms of winning International Patents - Always at the centre of Boom - Quick to Release Export Economic Data • Taiwan  - More dependant on Ingenuity  “ more open to outsiders” S. Korea & Taiwan : 5 Decades of Consistent Growth
  • 10.
    • Indonesia  -Attracting FDI investment : $10 Bn/year - Heavy Govt. Spend on Infrastructure (32% of GDP) - Labor cheapest in ASEAN (1/4th of China) - Fast development of Tier-II cities - 4th most populous country - Tourism Revenue - Reserves of Crude oil , Coal, Palm oil and Nickel On the Tiger Road : Indonesia
  • 11.
    • Advantage: - Poland -Czech Rep Currency is not “Euro” But part of “EU” The Sweet Spot Of EU..
  • 12.
    • Russia/Brazil HighDependence on Commodity Exports • Turkey No Commodity export Commodity export..
  • 13.
    • Central Banktries to control 3 major factors :  Inflation  Exchange Rate  Capital Flows • Interest rate  Controlled inflation • Interest rate  Exchange rate goes up.. • Controlling all 3 “ Whack -a -mole”
  • 14.
    • Long –TermEconomic Forecasts are futile • Every decade has been defined by some idea • Winners of one decade are often not the winners of next • Generally countries with lower base rate of per capita have potential to grow fast • But may not grow at the same rate in decades…
  • 15.
    • R&D SpendingHigh , Innovation  USA, S. Korea , Taiwan • Former Economic leaders slowing down (China, Japan) • All time Winner S. Korea & Taiwan
  • 16.
  • 17.
    Less potential tobecome Breakout Nations  Thailand- Polarization in Bangkok  S. Africa- Oligopolies Domination/Stagnant Economy  Malaysia- Labor import/ Brain drain  Vietnam- Poor Infrastructure & lack of skilled labor  Russia- Negative FDI/Corruption/ Commodity Export  Mexico - Social Inequality/ US Proximity  Brazil- Commodity Export  China- 6000 $ per capita Growth likely to slow down  India- Corruption/ High Context Society 50 % Chance
  • 18.
    Breakout Nations  S.Korea - R&D investments  Czech Rep. & Poland- Sweet spot of EU  Indonesia- High FDI investments  Philippines- Young population / Govt. Investments in Infrastructure  Turkey- Govt. Investments in Infrastructure/Lower exposure to commodity
  • 19.
    Worlds 4th MostPopulous Nation–245 Million Reserves of Crude oil,Coal,Palm oil and Nickel Attracting FDI investment of $10 Bn/year 55% of Earnings from Commodities Exports account 25% of Economy Economy Dependent on revenue from Crude oil Industries other than Commodities less developed Banking system dependent on external borrowing  Ease of doing business better than India due to efficient corruption Govt. spending heavily on Infrastructure (32% of GDP) Labor cheapest in ASEAN (1/4th of China) 2nd cities developing faster Economic growth (6% of GDP) Revenue from Tourism (Bali) SWOT Analysis: Indonesia BREAKOUT NATION19/03/2015
  • 20.
    7th Largest economyin the world Highly skilled workforce (3rd highest in Higher education in world) 8% of Global Car market share Most dense robot population in the world Global leaders in construction of oil facilities Service sector stagnant Banking and Telecommunication not successful in Korea House hold debt , Credit card debt (146% of GDP) Most of business are family owned – not attractive for investors as they are less likely to pay dividends (Korean stocks available at discounted rates)  Germany of Asia in Mfg sector Samsung, LG, Hyundai account for 16% of GDP Among top 5 nations in winning International patents Ship building industry growing fast High investment in R&D SWOT Analysis: South Korea BREAKOUT NATION 19/03/2015
  • 21.
     No Govt.debt  Small and Medium sized competitive companies Well managed govt.& good Local Banks Only nation in Eastern Europe to have preserved their brand Skoda (Arm of VW, but independent in design and Engg.) Not willing to joint EU due to Euro- zone crisis Dependent on Germany for Exports Economy vulnerable to EU crisis  Czech currency Koruna is stable and inexpensive (Good for exports) Labor cost is 27% cheaper than Western Europe Productivity cost is 40% lower than Western Europe SWOT Analysis: Czech Republic BREAKOUT NATION19/03/2015
  • 22.
    Current GDP growthof 11% Stable govt. Govt. debt 40% of GDP (EU norm <60% of GDP)  Population – 79 Million (Avg age 29 yrs) 2nd largest construction industry after China 80% Govt. Revenue comes from Tax on industries like Telecom, Automobile& Gasoline. Cars more expensive in Turkey than Europe ( for Automobile imports) Economy vulnerable to EU crisis Economy vulnerable to Middle east political instability  Turkish Lira stable due to less interest rates Exports competitive due to stable Lira Govt. investing heavily in Infrastructure FORD,FIAT to move European operations to Turkey due to inexpensive labor (labor 75% cheaper than W Europe) SWOT Analysis: Turkey BREAKOUT NATION19/03/2015
  • 23.
     Debt freecountry  Small and Medium sized competitive companies  Talented workforce Good banking system Central bank is independent of Political interference Quality consumer brands presence Not willing to joint EU due to Euro- zone crisis Dependent on Western Europe for Exports  Poland currency Zloty is stable and inexpensive Labor cost is 27% cheaper than Western Europe SWOT Analysis: Poland BREAKOUT NATION19/03/2015
  • 24.
    Highly literate population KeyShipping route pass through Colombo Revenue from Tourism Crude oil reserves High Govt. debt (80% of GDP) Business climate rank by World Bank 102nd /180 Post war instability China investing in Infrastructure (ports) can act as trade barrier for India Govt. spend rising in infrastructure post war MNC interested in IT outsourcing, Back office Banking and Retail MNC Increase in Cargo traffic at Colombo port Oil exploration off west coast by Reliance – Revenue from Crude oil SWOT Analysis: Sri Lanka VERY LIKELY TO BE A BREAKOUT 19/03/2015
  • 25.
    Highly Skilled Population Thaicorporations not dependent on external borrowing 40% workforce working in Agriculture (out ot 60 million population) High dependence on Exports (30% of GDP) 2nd cities not developed Political Instability. Biggest exporter of Cars (1 Million/year) after Japan and S Korea in Asia Good Infrasturture Revenue from Tourism SWOT Analysis: Thailand NOT A BREAKOUT NATION 19/03/2015
  • 26.
    Young Population (60%of population under 25) Good per capita income $8000 Rich in Natural resources like Rubber & Palm oil Delay in Execution of projects Less skilled workforce Less attractive to investors Mfg exports decreasing as Malaysia has to import labor Brain Drain of Skilled population Govt. spend rising in infrastructure (28% of GDP) Rubber and Commodity exports Less govt. debt (50% of GDP) SWOT Analysis: Malaysia NOT A BREAKOUT NATION 19/03/2015
  • 27.
     Top exporterof iron ore, Sugar, Coffee, Soybeans, poultry.  2 Mn barrels/year oil production  Brazilian stocks are one of the hottest Rose 300 % in $ terms in the last decade  Slow Growth Rate since 1980’s One of the closed economies till date  Total imports and exports account for only 15 % of the GDP Trade as a share of GDP one of the lowest among emerging Nations(only 20 %)  One of the most costliest and overhyped economies  Poor productivity growth rate (0.2 % btw 1980-2008)  Poor New Infrastructure investment  imports growing more than exports recently.  Struggling to grow even 4% a year  Recently recognized as World’s tenth largest oil reserves.  Huge foreign currency flowing in.  Rising Stock markets SWOT Analysis: Brazil 19/03/2015
  • 28.
     One ofthe hottest Stock Markets  Becoming Multinationals by making huge profits at home  Avg Per Capita Income( $11000)  Concentration of Business in Top Families  Stagnant Economy-Power of Oligopolies  Local economy not listed in Stock Market  High Corruption  Poor Security System  One Party Rule & capture of important positions by the same  Labor Laws very Pro worker  Social Inequality  High Drug trafficking & kidnapping  Heavily dependent on US Economy  Highest Migration Rate since 2006  Competitive labor rates & in proximity to US – Ray of Hope for Manufacturing Sector SWOT Analysis: Mexico 19/03/2015
  • 29.
    Young Population–90 Million(50% below 21 yrs 5th largest Reserves of Crude oil, Copper, Nickel, Gold & Silver $9 Bn BPO industry (Good English speaking population) Consumption 80% of GDP (Higher than USA) Poor Infrastructure High dependence on NRI income (10% of GDP) Unstable Govt. High Emigration.  Revenue from Tourism Increasing Per capita income $2500 Govt. spending increasing in Infrastructure and Industries  SWOT Analysis: Philippines NOT A BREAKOUT NATION 19/03/2015
  • 30.
     Abundance ofCrude Oil & Natural Gas  Stable Government  Ranked 3rd in world for no of Billionaires(100)  Poor Infrastructure  High Inflation  Poor Growth of Auto, Real Estate & Consumer Industries  Weak Banking System  Ageing population  Corruption in Public sectors  Govt. Income Highly dependent on oil  No Small & Medium Enterprises  No Global Presence of Russian Brands  Net FDI is negative Good R&D and Innovation capabilities  No Govt. Restrictions in Retail , Internet & Media investments  Reduction in Govt. Stakes in companies  Increase in immigrants from Eastern Europe SWOT Analysis: Russia 19/03/2015
  • 31.
    Good per capitaincome $8000 Worlds largest reserves of Platinum, Manganese,Gold,Iron ore and Coal Unemployment (25% of Population) Frequent Labor strikes Wages Increasing higher than Inflation Economy stagnant (3% of GDP) Oligopolies dominate Industry High Govt.debt.($750 Bn for Insurance , pension) Productivity in Mfg decreasing Exports of Gold and Platinum Growth in Mining and Mfg Demand for Automobiles SWOT Analysis: South Africa NOT A BREAKOUT NATION 19/03/2015
  • 32.
    Crude oil reserves 54Sea ports Population – 90 million Very poor Infrastructure Lack of skilled labor High interest rates (24%) High Inflation (20%) Sea Ports underdeveloped Vietnamese Dong highly unstable Political inclination towards communism  Revenue from Oil exploration Govt. spend rising in infrastructure Revenue from Shipping (54 ports) Low cost Mfg hub for electronic products (Intel plant) SWOT Analysis: Vietnam NOT A BREAKOUT NATION 19/03/2015