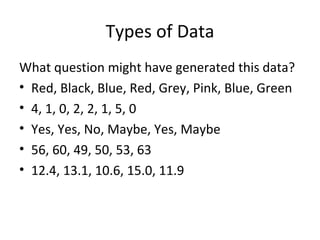
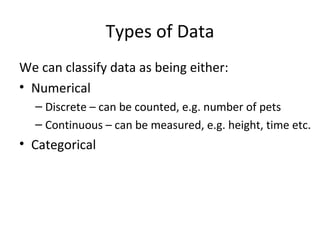
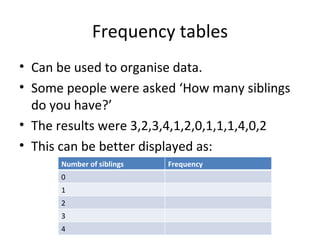
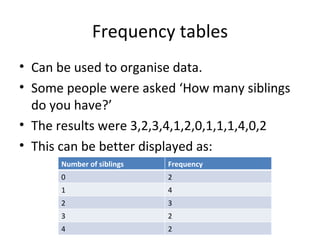
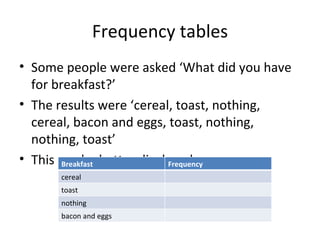
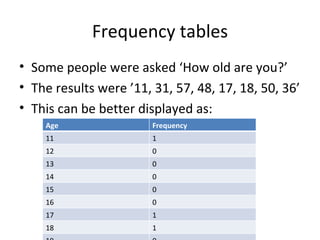
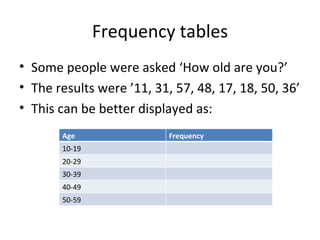
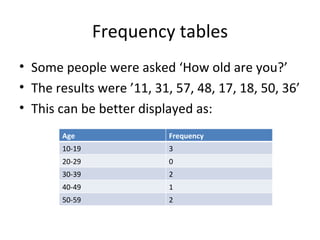
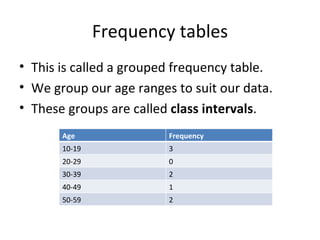
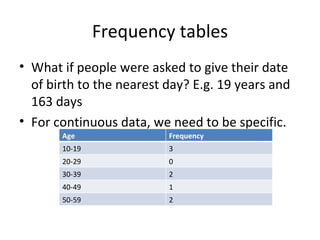
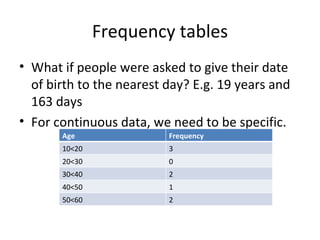
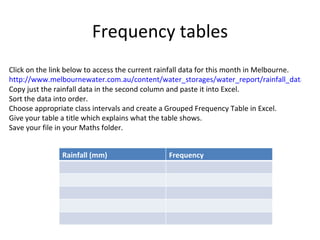
Univariate Data Objectives What are categorical and numerical data? What is a bar chart and when is it used? What is a histogram and when is it used? What is a stem-and-leaf plot and when is it used? What are the mean, median, range, interquartile range, variance and standard deviation? What are the properties of these summary statistics and when is each used? How do we construct and interpret boxplots?
Types of Data What question might have generated this data? Red, Black, Blue, Red, Grey, Pink, Blue, Green 4, 1, 0, 2, 2, 1, 5, 0 Yes, Yes, No, Maybe, Yes, Maybe 56, 60, 49, 50, 53, 63 12.4, 13.1, 10.6, 15.0, 11.9
Types of Data We can classify data as being either: Numerical Categorical
Types of Data We can classify data as being either: Numerical Discrete – can be counted, e.g. number of pets Continuous – can be measured, e.g. height, time etc. Categorical
Your task In pairs or groups of 3, you will create a podcast to explain types of data.  You will need to take photos using your phone and upload them to your computer. Use as many examples as you can find around the school site. Use iMovie to create your podcast. Once finished, transfer your podcast to your teacher’s computer via USB stick. Your podcast must be finished by the end of next lesson.
Frequency tables Can be used to organise data. Some people were asked ‘How many siblings do you have?’ The results were 3,2,3,4,1,2,0,1,1,1,4,0,2  This can be better displayed as: Number of siblings Frequency 0 1 2 3 4
Frequency tables Can be used to organise data. Some people were asked ‘How many siblings do you have?’ The results were 3,2,3,4,1,2,0,1,1,1,4,0,2  This can be better displayed as: Number of siblings Frequency 0 2 1 4 2 3 3 2 4 2
Frequency tables Some people were asked ‘What did you have for breakfast?’ The results were ‘cereal, toast, nothing, cereal, bacon and eggs, toast, nothing, nothing, toast’ This can be better displayed as: Breakfast Frequency cereal toast nothing bacon and eggs
Frequency tables Some people were asked ‘What did you have for breakfast?’ The results were ‘cereal, toast, nothing, cereal, bacon and eggs, toast, nothing, nothing, toast’ This can be better displayed as: Breakfast Frequency cereal 2 toast 3 nothing 3 bacon and eggs 1
Frequency tables Some people were asked ‘How old are you?’ The results were ’11, 31, 57, 48, 17, 18, 50, 36’ This can be better displayed as: Age Frequency 11 1 12 0 13 0 14 0 15 0 16 0 17 1 18 1 19 0 20 0 21 0
Frequency tables Some people were asked ‘How old are you?’ The results were ’11, 31, 57, 48, 17, 18, 50, 36’ This can be better displayed as: Age Frequency 10-19 20-29 30-39 40-49 50-59
Frequency tables Some people were asked ‘How old are you?’ The results were ’11, 31, 57, 48, 17, 18, 50, 36’ This can be better displayed as: Age Frequency 10-19 3 20-29 0 30-39 2 40-49 1 50-59 2
Frequency tables This is called a grouped frequency table. We group our age ranges to suit our data. These groups are called  class intervals . Age Frequency 10-19 3 20-29 0 30-39 2 40-49 1 50-59 2
Frequency tables What if people were asked to give their date of birth to the nearest day? E.g. 19 years and 163 days For continuous data, we need to be specific. Age Frequency 10-19 3 20-29 0 30-39 2 40-49 1 50-59 2
Frequency tables What if people were asked to give their date of birth to the nearest day? E.g. 19 years and 163 days For continuous data, we need to be specific. Age Frequency 10<20 3 20<30 0 30<40 2 40<50 1 50<60 2
Frequency tables Click on the link below to access the current rainfall data for this month in Melbourne. http://www.melbournewater.com.au/content/water_storages/water_report/rainfall_data.asp?bhcp=1 Copy just the rainfall data in the second column and paste it into Excel. Sort the data into order. Choose appropriate class intervals and create a Grouped Frequency Table in Excel. Give your table a title which explains what the table shows. Save your file in your Maths folder. Rainfall (mm) Frequency
Frequency tables

Univariate Data

  • 1.
    Univariate Data ObjectivesWhat are categorical and numerical data? What is a bar chart and when is it used? What is a histogram and when is it used? What is a stem-and-leaf plot and when is it used? What are the mean, median, range, interquartile range, variance and standard deviation? What are the properties of these summary statistics and when is each used? How do we construct and interpret boxplots?
  • 2.
    Types of DataWhat question might have generated this data? Red, Black, Blue, Red, Grey, Pink, Blue, Green 4, 1, 0, 2, 2, 1, 5, 0 Yes, Yes, No, Maybe, Yes, Maybe 56, 60, 49, 50, 53, 63 12.4, 13.1, 10.6, 15.0, 11.9
  • 3.
    Types of DataWe can classify data as being either: Numerical Categorical
  • 4.
    Types of DataWe can classify data as being either: Numerical Discrete – can be counted, e.g. number of pets Continuous – can be measured, e.g. height, time etc. Categorical
  • 5.
    Your task Inpairs or groups of 3, you will create a podcast to explain types of data. You will need to take photos using your phone and upload them to your computer. Use as many examples as you can find around the school site. Use iMovie to create your podcast. Once finished, transfer your podcast to your teacher’s computer via USB stick. Your podcast must be finished by the end of next lesson.
  • 6.
    Frequency tables Canbe used to organise data. Some people were asked ‘How many siblings do you have?’ The results were 3,2,3,4,1,2,0,1,1,1,4,0,2 This can be better displayed as: Number of siblings Frequency 0 1 2 3 4
  • 7.
    Frequency tables Canbe used to organise data. Some people were asked ‘How many siblings do you have?’ The results were 3,2,3,4,1,2,0,1,1,1,4,0,2 This can be better displayed as: Number of siblings Frequency 0 2 1 4 2 3 3 2 4 2
  • 8.
    Frequency tables Somepeople were asked ‘What did you have for breakfast?’ The results were ‘cereal, toast, nothing, cereal, bacon and eggs, toast, nothing, nothing, toast’ This can be better displayed as: Breakfast Frequency cereal toast nothing bacon and eggs
  • 9.
    Frequency tables Somepeople were asked ‘What did you have for breakfast?’ The results were ‘cereal, toast, nothing, cereal, bacon and eggs, toast, nothing, nothing, toast’ This can be better displayed as: Breakfast Frequency cereal 2 toast 3 nothing 3 bacon and eggs 1
  • 10.
    Frequency tables Somepeople were asked ‘How old are you?’ The results were ’11, 31, 57, 48, 17, 18, 50, 36’ This can be better displayed as: Age Frequency 11 1 12 0 13 0 14 0 15 0 16 0 17 1 18 1 19 0 20 0 21 0
  • 11.
    Frequency tables Somepeople were asked ‘How old are you?’ The results were ’11, 31, 57, 48, 17, 18, 50, 36’ This can be better displayed as: Age Frequency 10-19 20-29 30-39 40-49 50-59
  • 12.
    Frequency tables Somepeople were asked ‘How old are you?’ The results were ’11, 31, 57, 48, 17, 18, 50, 36’ This can be better displayed as: Age Frequency 10-19 3 20-29 0 30-39 2 40-49 1 50-59 2
  • 13.
    Frequency tables Thisis called a grouped frequency table. We group our age ranges to suit our data. These groups are called class intervals . Age Frequency 10-19 3 20-29 0 30-39 2 40-49 1 50-59 2
  • 14.
    Frequency tables Whatif people were asked to give their date of birth to the nearest day? E.g. 19 years and 163 days For continuous data, we need to be specific. Age Frequency 10-19 3 20-29 0 30-39 2 40-49 1 50-59 2
  • 15.
    Frequency tables Whatif people were asked to give their date of birth to the nearest day? E.g. 19 years and 163 days For continuous data, we need to be specific. Age Frequency 10<20 3 20<30 0 30<40 2 40<50 1 50<60 2
  • 16.
    Frequency tables Clickon the link below to access the current rainfall data for this month in Melbourne. http://www.melbournewater.com.au/content/water_storages/water_report/rainfall_data.asp?bhcp=1 Copy just the rainfall data in the second column and paste it into Excel. Sort the data into order. Choose appropriate class intervals and create a Grouped Frequency Table in Excel. Give your table a title which explains what the table shows. Save your file in your Maths folder. Rainfall (mm) Frequency
  • 17.