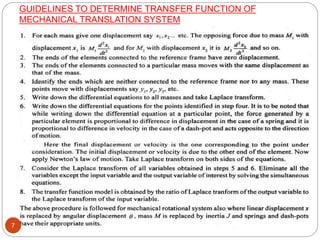
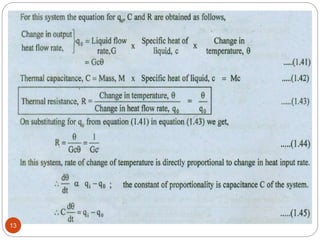
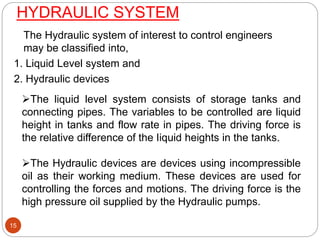
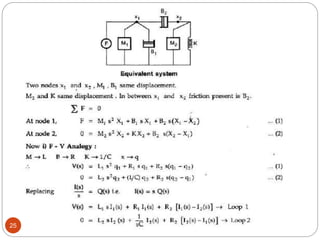
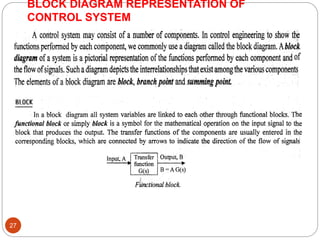
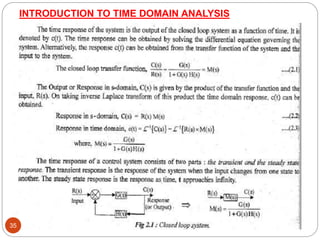
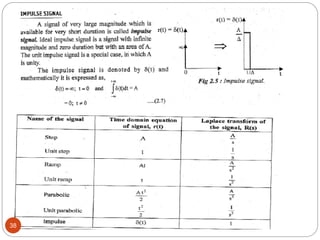
UNIT – II
CONTROL SYSTEM
ENGINEERING
Prepared by D.Balaji
AP/EEE/MVIT
1
MATHEMATICAL MODEL OF PHYSICAL SYSTEM
2
Symbols used for mechanical system
3
4
5
6
GUIDELINES TO DETERMINE TRANSFER FUNCTION OF
MECHANICAL TRANSLATION SYSTEM
7
8
9
THERMAL SYSTEM
Thermal systems are those that involve the
transfer of heat from one substance to another.
There are three different ways of heat flow from
one substance to another. They are conduction,
convection and radiation.
10
11
12
13
14
HYDRAULIC SYSTEM
The Hydraulic system of interest to control engineers
may be classified into,
1. Liquid Level system and
2. Hydraulic devices
The liquid level system consists of storage tanks and
connecting pipes. The variables to be controlled are liquid
height in tanks and flow rate in pipes. The driving force is
the relative difference of the Iiquid heights in the tanks.
The Hydraulic devices are devices using incompressible
oil as their working medium. These devices are used for
controlling the forces and motions. The driving force is the
high pressure oil supplied by the Hydraulic pumps.
15
16
17
18
19
MATHEMATICAL MODEL OF ELECTRICAL
SYSTEM
20
21
22
23
24
25
26
BLOCK DIAGRAM REPRESENTATION OF
CONTROL SYSTEM
27
28
29
30
31
32
STEPS TO SOLVE BLOCK DIAGRAM REDUCTION PROBLEMS:
Step 1: Reduce the blocks connected in series
Step 2: Reduce the blocks connected in parallel
Step 3: Reduce the minor feedback loops
Step 4: Try to shift take off points towards right and Summing point towards left
Step 5: Repeat steps 1 to 4 till simple form is obtained
Step 6: Obtain the Transfer Function of Overall System
33
Advantages of Block Diagram Representation
Very simple to construct block diagram for a complicated system
Function of individual element can be visualized
Individual & Overall performance can be studied
Over all transfer function can be calculated easily
Disadvantages of Block Diagram Representation
No information about the physical construction
Source of energy is not shown
34
INTRODUCTION TO TIME DOMAIN ANALYSIS
35
STANDARD TEST SIGNALS
36
37
38
39
40

UNIT 2 CSE NEW.pptx

  • 1.
    UNIT – II CONTROLSYSTEM ENGINEERING Prepared by D.Balaji AP/EEE/MVIT 1
  • 2.
    MATHEMATICAL MODEL OFPHYSICAL SYSTEM 2
  • 3.
    Symbols used formechanical system 3
  • 4.
  • 5.
  • 6.
  • 7.
    GUIDELINES TO DETERMINETRANSFER FUNCTION OF MECHANICAL TRANSLATION SYSTEM 7
  • 8.
  • 9.
  • 10.
    THERMAL SYSTEM Thermal systemsare those that involve the transfer of heat from one substance to another. There are three different ways of heat flow from one substance to another. They are conduction, convection and radiation. 10
  • 11.
  • 12.
  • 13.
  • 14.
  • 15.
    HYDRAULIC SYSTEM The Hydraulicsystem of interest to control engineers may be classified into, 1. Liquid Level system and 2. Hydraulic devices The liquid level system consists of storage tanks and connecting pipes. The variables to be controlled are liquid height in tanks and flow rate in pipes. The driving force is the relative difference of the Iiquid heights in the tanks. The Hydraulic devices are devices using incompressible oil as their working medium. These devices are used for controlling the forces and motions. The driving force is the high pressure oil supplied by the Hydraulic pumps. 15
  • 16.
  • 17.
  • 18.
  • 19.
  • 20.
    MATHEMATICAL MODEL OFELECTRICAL SYSTEM 20
  • 21.
  • 22.
  • 23.
  • 24.
  • 25.
  • 26.
  • 27.
    BLOCK DIAGRAM REPRESENTATIONOF CONTROL SYSTEM 27
  • 28.
  • 29.
  • 30.
  • 31.
  • 32.
  • 33.
    STEPS TO SOLVEBLOCK DIAGRAM REDUCTION PROBLEMS: Step 1: Reduce the blocks connected in series Step 2: Reduce the blocks connected in parallel Step 3: Reduce the minor feedback loops Step 4: Try to shift take off points towards right and Summing point towards left Step 5: Repeat steps 1 to 4 till simple form is obtained Step 6: Obtain the Transfer Function of Overall System 33
  • 34.
    Advantages of BlockDiagram Representation Very simple to construct block diagram for a complicated system Function of individual element can be visualized Individual & Overall performance can be studied Over all transfer function can be calculated easily Disadvantages of Block Diagram Representation No information about the physical construction Source of energy is not shown 34
  • 35.
    INTRODUCTION TO TIMEDOMAIN ANALYSIS 35
  • 36.
  • 37.
  • 38.
  • 39.
  • 40.