Download to read offline


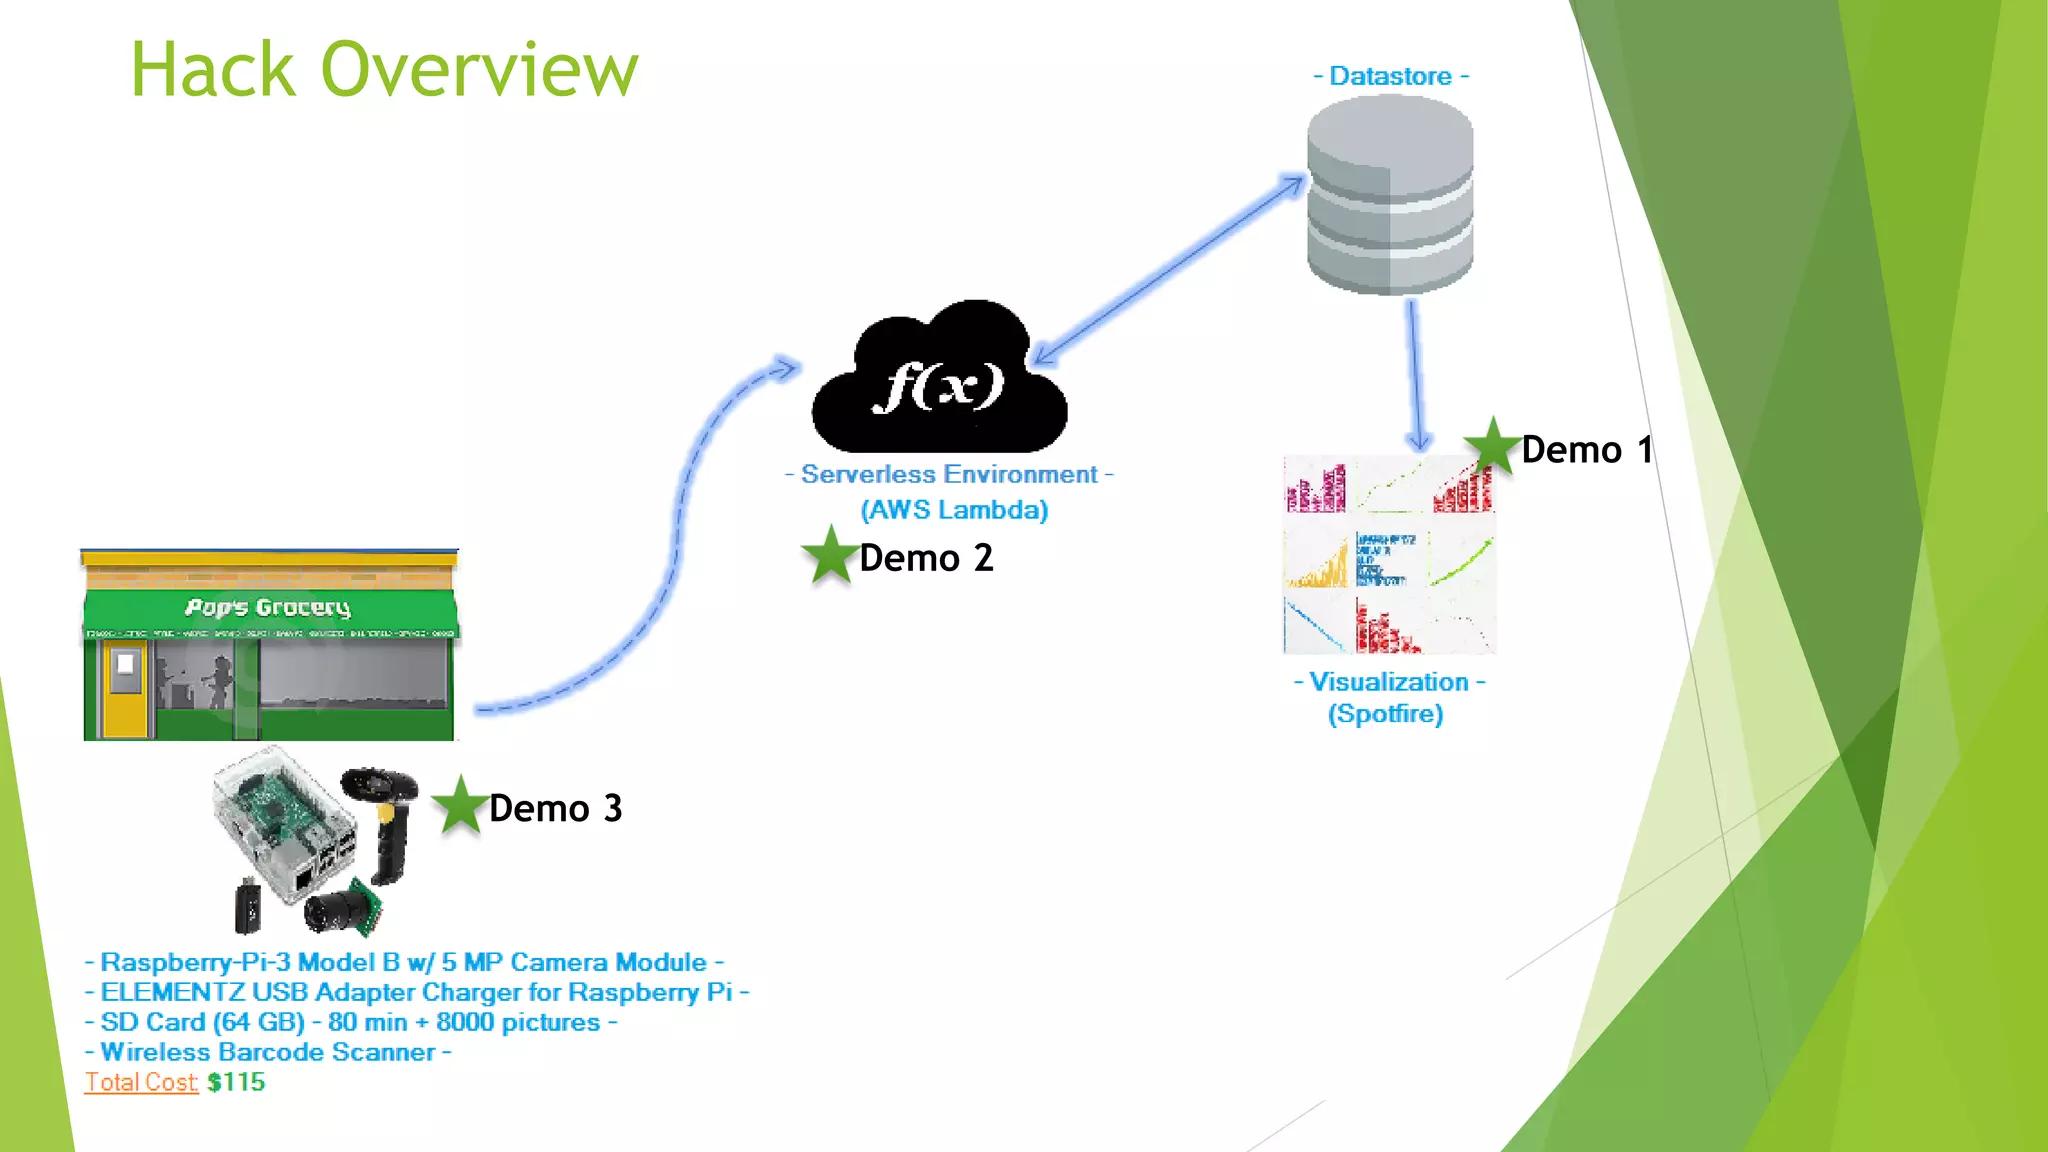


The document discusses an inexpensive, auto-scalable analytics solution for kirana stores that uses a Raspberry Pi system combined with machine learning and computer vision to capture real-time sales data and automate inventory management. The proposed system includes multiple cameras and a database for monitoring store performance, consumer behavior, and inventory status while ensuring ease of use with a visualization dashboard. Challenges such as data inconsistency and the need for hardware deployment optimization are addressed, emphasizing the integration of various technologies for enhanced analytics.


![[Webinar] High Speed Retail Analytics](https://cdn.slidesharecdn.com/ss_thumbnails/highspeedretailanalytics-121120164330-phpapp01-thumbnail.jpg?width=640&height=640&fit=bounds)


