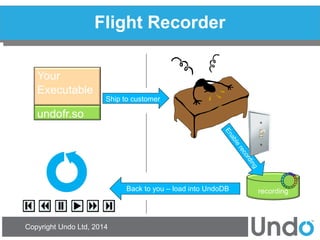
- Undo Ltd is a company that developed UndoDB, a reversible debugger that allows debugging programs by rewinding execution.
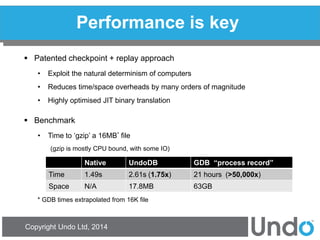
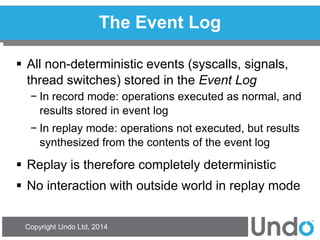
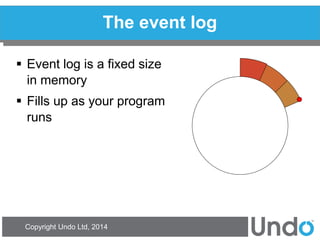
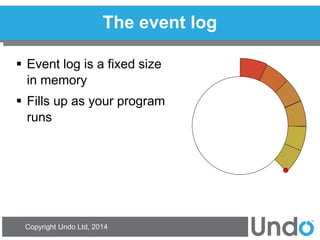
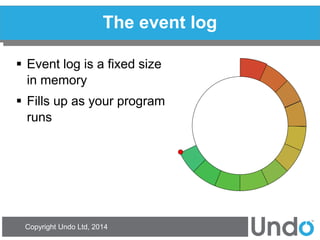
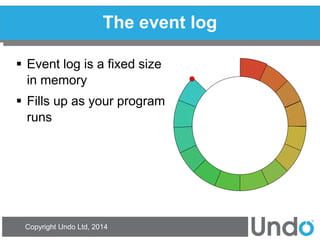
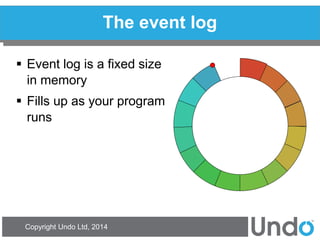
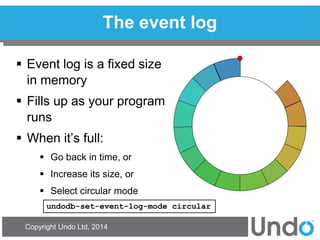
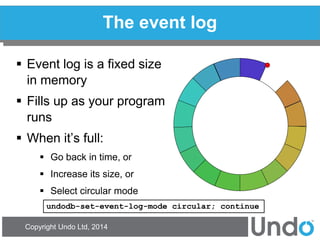
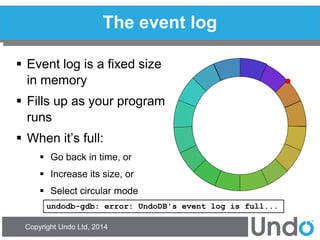
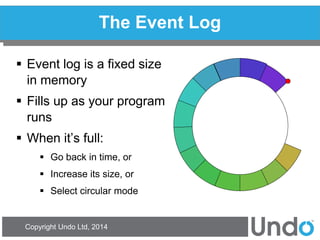
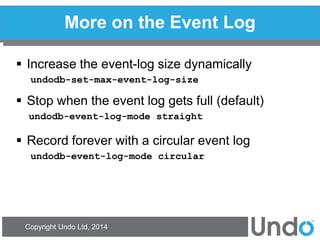
- UndoDB records non-deterministic events during execution to create an event log, allowing replay of execution in either direction.
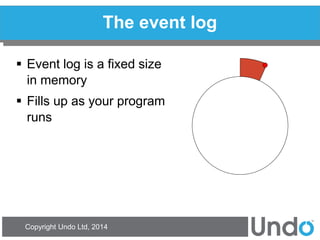
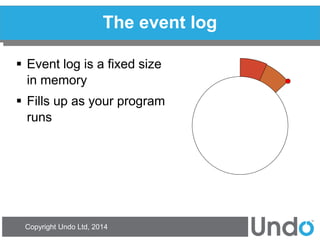
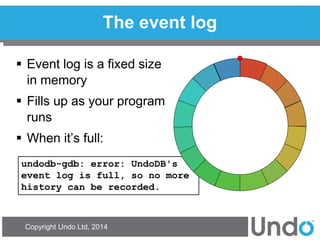
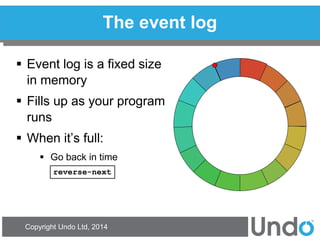
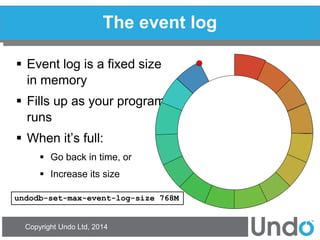
- When the event log is full, it can either rewind to an earlier point, increase the log size, or switch to circular mode.
Give me 15 minutes and i'll change your view of gdbgregthelaw
My cppcon lightning talk. If you’re writing C++ for anything other than Windows, chances are that you occasionally break out GDB. GDB has come a long way in the last few years and now does so much more than break, print, step and continue. Its built-in Python scripting is particularly powerful and offers a whole new way to debug. In a series of short demos, Undo Software co-founder and CEO, Greg Law, will show some neat tricks on how to get the most out of GDB, and will reveal powerful new (and not-so-new) features that you probably haven’t heard of.
This document discusses using the GNU Debugger (GDB) to debug programs. It begins with an introduction to GDB and why it is useful. Examples are then provided of using GDB for interactive debugging, examining core dumps, patching binaries, and advanced tricks. A real-world case study demonstrates using GDB to debug a crash in the GNU C library by examining assembly code and source-level debugging with debug symbols. The document concludes by mentioning another case study involving hijacking file descriptors in GDB.
This document provides a tutorial on using the GNU Debugger (GDB) to debug C and C++ programs. It discusses starting GDB, loading programs into it, setting breakpoints to pause execution, single-stepping or continuing execution, and querying values of variables. It also covers conditional breakpoints, using GDB with pointers and data structures, and other useful commands like backtrace and watchpoints. The goal is to demonstrate how GDB can be used to inspect program execution and help debug issues like segmentation faults.
The document provides an overview of the GNU Debugger (GDB). It lists common GDB commands for debugging programs like breakpoints, watching variables, backtracing functions, and examining runtime behavior. Additional debugger tools are also mentioned like gdbtui, Xcode, and Emacs plugins that build on GDB. The document ends with references to online resources for learning more about using GDB and debugging with it.
When the debugging of modern software is required, basic GDB techniques are insufficient, but new techniques can be created from the nearly 160 commands available in GDB. "Modern software" refers to multi-threading, using STL and other libraries, IPC, signals and exception
mechanisms. In this lecture, techniques for debugging large, modern software written in C++ will be explained.
If you can write some code patch, it will be one of great ways for contributing open-sources. but, there is no way to contribute open-sources without writing code? I'd like to encourage doing translation, filing a bug and so on. This is a case study for that. Don't need anything else! Please join us and enjoy! :)
TinyGo is a Go compiler that targets microcontrollers. It compiles Go code to run on devices with limited memory like those with 8-32KB RAM. TinyGo works by interpreting parts of Go code at compile time, using SSA and LLVM to optimize code size. It generates binary for microcontrollers like Raspberry Pi Pico. The runtime is configured for the specific target through build tags. TinyGo addresses challenges in reusing board configurations and lack of hardware APIs. It aims to run Go on very low-level micros like Python does.
This document discusses concurrency in operating systems and different programming languages. It explains how concurrency works at the OS level using schedulers and threads/processes. It then compares implementations of concurrency in Python, Java, and Go. Python uses threads but is constrained by the GIL, Java uses native threads, and Go uses lightweight goroutines scheduled across OS threads. The document cautions that while goroutines make concurrency easy, there are still costs to consider. It concludes by noting languages evolve over time and no approach is inherently unable to handle high concurrency applications.
GDB can debug programs by running them under its control. It allows inspecting and modifying program state through breakpoints, watchpoints, and examining variables and memory. GDB supports debugging optimized code, multi-threaded programs, and performing tasks like stepping, continuing, and backtracing through the call stack. It can also automate debugging through commands, scripts, and breakpoint actions.
This document discusses functional programming on microcontroller units (MCUs) and summarizes the speaker's workshop on this topic. It explores reasons for using functional languages on MCUs and Internet of Things devices due to benefits like strong typing and runtime error avoidance. Several cross-compilers from functional languages to C suitable for MCUs are presented, like Ajhc for Haskell and Rust, along with experiences running them on boards like the mbed LPC1768 and Seeeduino Arch Pro. Debugging options using pyOCD and OpenOCD are also covered.
This document provides performance enhancement tips for Python programs. It recommends profiling code first using the "python -m cProfile" command to identify slow parts before optimizing. Potential optimization strategies discussed include using PyPy to gain a 2x page load speed boost, using Cython to compile Python to C for a 20% performance boost with no code changes, and using multiprocessing to parallelize CPU-bound tasks by utilizing all CPU cores. Multiprocessing is preferable to multithreading in Python due to the Global Interpreter Lock (GIL). The document emphasizes profiling first and reducing complexity over premature optimization.
- The document discusses challenges with analyzing data stored in MongoDB, a NoSQL database, using typical analyst tools which expect structured data.
- It presents an open-source solution to synchronize data from MongoDB to PostgreSQL in real-time, and extract the MongoDB schema to normalize it for analysis in SQL and tools like Superset.
- The stack includes MongoDB Connector to replicate data to PostgreSQL, Pymongo-Schema to define the MongoDB schema, and Doc-manager to translate the data model for PostgreSQL. This allows analysts to work with the data using standard SQL and BI tools.
GDB is a debugger program used to test and debug other programs. It allows the user to step through a program line-by-line, set breakpoints, view variable values and more. Some key features of GDB include setting breakpoints, running and stopping a program at specific points, examining variable values and execution flow. GDB can also be used for remote debugging where the program runs on one machine and GDB runs on another, connected machine.
The document discusses improving foreign function interface (FFI) techniques in Smalltalk by making them more portable across implementations. It proposes extending the interpreter to allow direct calls to C functions, similar to approaches used in Python, Lua, and .NET. This would involve adding primitives for basic CPU types to the bytecode and implementing the interface in plugins for different backends like C, C++, and a virtual CPU.
Alex Chistyakov gives a presentation on performance engineering. He discusses using profiling tools like the Poor Man's Profiler and flamegraphs to analyze the performance of a Python program. He profiles a Deluge BitTorrent client running in Docker and finds that it spends most of its time in the libtorrent C++ library with about 30% overhead from Python. The profiling helped identify areas for potential optimization.
The Simple Scheduler in Embedded System @ OSDC.TW 2014Jian-Hong Pan
The document describes a simple scheduler module implemented in C for embedded systems. It breaks processes into small jobs represented by functions that are scheduled in a first-in, first-out queue without preemption. This allows embedding an operating system concept into simple systems using only functions and a ready queue. Interrupts can add jobs to the queue. The scheduler and example oscilloscope application demonstrate scheduling without process state using only callbacks.
When building a large enough set of services using node.js, there will be a point when you find that your application is suffering from performance or memory issues. When this happens, you have to roll up your sleeves, get your tools and start digging. This talk explains how you can use tools such as ab, flame graphs, heap snapshots and Chrome's memory inspector to find the cause of these. We will go over two real life issues, a CPU bottleneck and a memory leak, we found while building our services at Auth0, and also explain how we fixed them.
The document summarizes a presentation given by Alex Chistyakov comparing the performance of PostgreSQL on Ubuntu Linux, FreeBSD, and Gentoo Linux. It finds that Ubuntu with asynchronous commits achieved the highest transactions per second. FreeBSD performance was lower, and Gentoo was deemed too complex due to its "emerge" installation method requiring network configuration in a chicken-and-egg dilemma. In conclusion, the presenter prefers to stay with the simpler Ubuntu distribution.
The document discusses configuring a Hadoop/HBase cluster to build a cloud VAT declarations revising service. It describes trying and failing to use proprietary software solutions from Oracle and Cloudera. Instead, it advocates using open source tools like Ansible to automate configuration, and developing their own open source product for configuring Hadoop stacks in a modular way without vendor lock-in. The presentation concludes by inviting questions.
PLAM 2015 - Evolving Backups Strategy, Devploying pyxbackupJervin Real
Not all backup requirements are the same, there are simple backups and then there are complex backup and recovery strategies. After working with hundreds of users laying out the ground work, we've decided that although not all installations are the same, all of them run through the same procedure so we have decided to automate most of this things with pyxbackup. This talk will highlight the evolution of the project from the most basic backup implementation to extending capabilities for different scenarios like compression, remote storage, encryption and being a portable, comprehensible backup utility for the novice and experts alike.
The pyxbackup project can be found at:
https://github.com/dotmanila/pyxbackup
Go is an open source programming language developed at Google to build simple, reliable and efficient software. It is a compiled, concurrent language that makes it easy to build scalable network and web applications. Some key features of Go include garbage collection, static typing, concurrency support with goroutines, and a large standard library. Go aims to combine the efficiency and speed of compiled languages like C with the simplicity and ease of dynamic languages.
Python for IoT discusses building Pyaiot, a system to connect constrained IoT devices to the web. Pyaiot uses common IoT protocols like CoAP and MQTT to allow bidirectional communication between low-power devices and a web dashboard. The author details how Pyaiot was implemented using Python and asyncio to be multi-protocol, modular, and reactive in a real-time manner. Lessons learned include some initial challenges with asyncio, but that Python facilitated fast development of the complex system to meet the initial requirements.
This document introduces Groovy, a scripting language for Java. It discusses how Groovy compiles to Java bytecode and can be used with existing Java tools and libraries. Examples show how Groovy simplifies common tasks like iteration, exception handling, and building XML/HTML. The document also briefly introduces Grails, a web framework that uses Groovy's conventions to accelerate development.
Python Django Basics
Python and Django getting Started
Why Python?
Why Django?
Django - MTV, MVT
What python does that another programming language do not ?
What kind of applications can you build with Python?
What is Python ?
What can you do with python?
Debugging is the process of finding and reducing bugs in software and hardware. A debugger like GDB is a program used to debug other programs by allowing the programmer to stop execution at any point and examine variable values. Debug symbols embedded in binaries or separate files provide information mapping machine code to programming language constructs to aid debugging. GDB allows setting breakpoints to pause execution, examining memory and registers, and modifying variables and function calls to test programs.
Reproducibility in artificial intelligenceCarlos Toxtli
The document discusses various methods for improving reproducibility in artificial intelligence research. It begins by introducing some AI projects the author has worked on. It then discusses causes of non-reproducibility such as lack of data/code access. The document looks at potential solutions like reproducibility frameworks, benchmarking, and standalone methods. It focuses on the author's MultiAffect framework, which standardizes data processing, feature extraction, training, evaluation and reporting. It aims to make research reproducible and accessible. The framework is demonstrated on affect recognition and action recognition tasks, showing it can achieve results comparable to other works.
We continue where we left off from Part 1. This section covers 2 main topics, debugging libraries and fuzzer design. For debugging libraries we go over PyDBG and WinAppDbg, discussing basic to intermediate examples, and when you might want to use one instead of the other. After that, fuzzer design is discussed, including goals, design choices, architecture, etc. Some code samples are shown from my fuzzer, along with a github link for those who are interested.
NLP for videos: Understanding customers' feelings in videos - Albert Lewandow...GetInData
Did you like it? Check out our blog to stay up to date: https://getindata.com/blog
Currently there are more and more created videos distributed via multiple social media channels. It becomes more and more important to monitor all of them by companies to verify their customers' feedback, reviews, opinions. During the talk, we talk about extracting text from videos, analyzing language and prepare robust, scalable infrastructure for it. The idea behind platform is about having the mix between managed and self-managed service for Big Data processing. The keynote shows the case study of the MVP of the platform for marketing companies.
Author: Albert Lewandowski
Linkedin: https://www.linkedin.com/in/albert-lewandowski/
___
Getindata is a company founded in 2014 by ex-Spotify data engineers. From day one our focus has been on Big Data projects. We bring together a group of best and most experienced experts in Poland, working with cloud and open-source Big Data technologies to help companies build scalable data architectures and implement advanced analytics over large data sets.
Our experts have vast production experience in implementing Big Data projects for Polish as well as foreign companies including i.a. Spotify, Play, Truecaller, Kcell, Acast, Allegro, ING, Agora, Synerise, StepStone, iZettle and many others from the pharmaceutical, media, finance and FMCG industries.
https://getindata.com
The document discusses Joel Spolsky's "Joel Test" which evaluates software development teams. It applies the test's 12 questions to PHP teams and provides recommendations. Key points include using source control, continuous integration, bug tracking, specifications, estimating tasks, and providing developers with resources to do their jobs.
App Performance Tip: Sharing Flash Across Virtualized WorkloadsDataCore Software
Core business applications like Oracle, SAP, SQL Server, Exchange and SharePoint often perform poorly when virtualized. More often than not the root cause is data I/O bottlenecks.
In this presentation, DataCore Software and Fusion-io highlight how to:
• Integrate flash memory to overcome I/O bottlenecks in real-world environments
• Combine flash technology with existing storage
• Speed up virtualized applications
• Prevent storage from slowing down or taking down your applications
eFolder Partner Chat Webinar — Spring Cleaning: Getting Your Clients to Ditch...eFolder
Learn how to position BDR as a premium aspect of your managed services offering, which will help increase your bottom line while also increasing your clients’ satisfaction.
Linked in Twitter Facebook Google+ Email Embed Share Flash Across Virtualized...Emulex Corporation
Does your business need to speed up response times and provide continuous availability for your mission-critical applications?Core business applications like Oracle, SAP, SQL Server, Exchange and SharePoint often perform poorly when virtualized. More often than not, the root cause of poor performance is data I/O bottlenecks. If you are looking at solid-state memory technologies to deliver the blazing performance you need, this joint webinar will be well worth your time!
Code, ci, infrastructure - the gophers wayAlex Baitov
The presence of golang. Golang becomes pretty powerful. There are plenty of everyday golang tools. I will show you that we built infrastructure mostly consists of tools written on one language - golang. What benefits did we gain from writing an application on the language of its infrastructure. And I will describe how we use golang in production.
Kris Buytaert discusses his transition from developer to operations engineer to consultant. He advocates for starting DevOps transformations with operations skills and involvement to improve success rates and adoption. Buytaert outlines four common transition cases for startups and multinationals, highlighting the importance of cultural and skills alignment between development and operations.
This document discusses 12 tricks hackers use to compromise continuous integration and continuous delivery (CI/CD) systems. It outlines attacks such as installing malware via libraries, leaking secrets, executing malicious code in pipelines, consuming cloud services to cause outages, zip bombs, memory bombs, fork bombs, and compromising APIs. The document emphasizes the importance of limiting permissions, monitoring systems, and assuming insider attackers when hardening CI/CD pipelines and infrastructure.
PHP Mega Meetup, Sep, 2020, Anti patterns in phpAhmed Abdou
PHP is one of the easiest programming languages to use ever and powers more than half of the internet.
With this ease of use, certain common patterns emerge that become harmful. This is especially true when your product or service is not expected to die soon. Some anti-patterns are coding, others are related to operating your service, especially with new docker stacks. We will go over some of the most common pitfalls with a focus on enterprise development.
This ppt is about Online gas booking project in java. It describe basic introduction, hardware and software requirements and screenshots of the project. For more info
please visit : http://s4al.com/category/study-java/
Good Security Starts with Software Assurance - Software Assurance Market Plac...Phil Agcaoili
The document provides an overview of a live event discussing the Software Assurance Marketplace (SWAMP) project. It includes:
1) An agenda for the event with presentations on the SWAMP overview, an executive insight, and Q&A session.
2) Descriptions of the SWAMP project, which is a $23 million, 5-year effort to build a facility for testing open source software for vulnerabilities. It will provide tools, resources, and results reporting to support software assurance.
3) Details on the SWAMP's vision to help developers integrate security testing early and often through continuous assurance in their development cycles. This will help find and fix vulnerabilities before they become serious problems.
The new runtime which Google is started implementing as developers view to implement or not which has advantages over the previous Dalvik runtime and more...
Cloud Native Debugging in Production - Dig Deep into your agentsShai Almog
Talk given at HashiTalks 2022 by Shai Almog:
Learn how continuous observability helps us go beyond the limits of AMS, Logs and other observability tools. Solve real world problems at scale in production in polyglot highly distributed environments such as Nomad, K8S etc. with this free solution.
Public Sector Virtual Town Hall: High Availability for PostgreSQLEDB
Highly available databases are essential to organizations depending on mission-critical, 24/7 access to data. PostgreSQL is widely recognized as an excellent open-source database, with critical maturity and features that allow organizations to scale and achieve high availability.
This webinar will explore:
High availability concepts and workings
RPO, RTO, and uptime in high availability
Postgres high availability using streaming replication and logical replication
Important high availability parameters in PostgreSQL and options to monitor high availability
EDB tools (EDB Postgres Failover Manager, BART etc) to create a highly available Postgres architecture
Production profiling what, why and how technical audience (3)RichardWarburton
Everyone wants to understand what their application is really doing in production, but this information is normally invisible to developers. Profilers tell you what code your application is running but few developers profile and mostly on their development environments.
Thankfully production profiling is now a practical reality that can help you solve and avoid performance problems. Profiling in development can be problematic because it’s rare that you have a realistic workload or performance test for your system. Even if you’ve got accurate perf tests maintaining these and validating that they represent production systems is hugely time consuming and hard. Not only that but often the hardware and operating system that you run in production are different from your development environment.
This pragmatic talk will help you understand the ins and outs of profiling in a production system. You’ll learn about different techniques and approaches that help you understand what’s really happening with your system. This helps you to solve new performance problems, regressions and undertake capacity planning exercises.
DevOps Fest 2020. immutable infrastructure as code. True story.Vlad Fedosov
This document discusses the journey of transitioning infrastructure management at Namecheap to an immutable infrastructure as code model using tools like Terraform, Docker, and Jenkins. Key points include taking over a project from an outsourcing company, setting up immutable infrastructure with infrastructure as code, configuring CI/CD pipelines as code in Jenkins, and lessons learned around testing, chaos engineering, and encouraging team feedback. The overall goals were to make infrastructure hard to break, easy to repair, and easy to modify.
The document discusses disaster recovery (DR) planning and testing using virtual DR solutions. It notes that downtime has significant economic costs, and that most enterprises prioritize improving DR capabilities. Traditional DR testing is static, focuses on backups, and has slow recovery times. Virtual DR solutions allow replicating workloads into virtual machines, enabling one-click failover and flexible testing. This reduces recovery times and costs while improving protection of workloads. The document promotes PlateSpin Protect and Forge solutions for virtual DR and workload protection across environments.
Malibou Pitch Deck For Its €3M Seed Roundsjcobrien
French start-up Malibou raised a €3 million Seed Round to develop its payroll and human resources
management platform for VSEs and SMEs. The financing round was led by investors Breega, Y Combinator, and FCVC.
14 th Edition of International conference on computer visionShulagnaSarkar2
About the event
14th Edition of International conference on computer vision
Computer conferences organized by ScienceFather group. ScienceFather takes the privilege to invite speakers participants students delegates and exhibitors from across the globe to its International Conference on computer conferences to be held in the Various Beautiful cites of the world. computer conferences are a discussion of common Inventions-related issues and additionally trade information share proof thoughts and insight into advanced developments in the science inventions service system. New technology may create many materials and devices with a vast range of applications such as in Science medicine electronics biomaterials energy production and consumer products.
Nomination are Open!! Don't Miss it
Visit: computer.scifat.com
Award Nomination: https://x-i.me/ishnom
Conference Submission: https://x-i.me/anicon
For Enquiry: Computer@scifat.com
Flutter is a popular open source, cross-platform framework developed by Google. In this webinar we'll explore Flutter and its architecture, delve into the Flutter Embedder and Flutter’s Dart language, discover how to leverage Flutter for embedded device development, learn about Automotive Grade Linux (AGL) and its consortium and understand the rationale behind AGL's choice of Flutter for next-gen IVI systems. Don’t miss this opportunity to discover whether Flutter is right for your project.
How Can Hiring A Mobile App Development Company Help Your Business Grow?ToXSL Technologies
ToXSL Technologies is an award-winning Mobile App Development Company in Dubai that helps businesses reshape their digital possibilities with custom app services. As a top app development company in Dubai, we offer highly engaging iOS & Android app solutions. https://rb.gy/necdnt
Enhanced Screen Flows UI/UX using SLDS with Tom KittPeter Caitens
Join us for an engaging session led by Flow Champion, Tom Kitt. This session will dive into a technique of enhancing the user interfaces and user experiences within Screen Flows using the Salesforce Lightning Design System (SLDS). This technique uses Native functionality, with No Apex Code, No Custom Components and No Managed Packages required.
Unlock the Secrets to Effortless Video Creation with Invideo: Your Ultimate G...The Third Creative Media
"Navigating Invideo: A Comprehensive Guide" is an essential resource for anyone looking to master Invideo, an AI-powered video creation tool. This guide provides step-by-step instructions, helpful tips, and comparisons with other AI video creators. Whether you're a beginner or an experienced video editor, you'll find valuable insights to enhance your video projects and bring your creative ideas to life.
Odoo releases a new update every year. The latest version, Odoo 17, came out in October 2023. It brought many improvements to the user interface and user experience, along with new features in modules like accounting, marketing, manufacturing, websites, and more.
The Odoo 17 update has been a hot topic among startups, mid-sized businesses, large enterprises, and Odoo developers aiming to grow their businesses. Since it is now already the first quarter of 2024, you must have a clear idea of what Odoo 17 entails and what it can offer your business if you are still not aware of it.
This blog covers the features and functionalities. Explore the entire blog and get in touch with expert Odoo ERP consultants to leverage Odoo 17 and its features for your business too.
An Overview of Odoo ERP
Odoo ERP was first released as OpenERP software in February 2005. It is a suite of business applications used for ERP, CRM, eCommerce, websites, and project management. Ten years ago, the Odoo Enterprise edition was launched to help fund the Odoo Community version.
When you compare Odoo Community and Enterprise, the Enterprise edition offers exclusive features like mobile app access, Odoo Studio customisation, Odoo hosting, and unlimited functional support.
Today, Odoo is a well-known name used by companies of all sizes across various industries, including manufacturing, retail, accounting, marketing, healthcare, IT consulting, and R&D.
The latest version, Odoo 17, has been available since October 2023. Key highlights of this update include:
Enhanced user experience with improvements to the command bar, faster backend page loading, and multiple dashboard views.
Instant report generation, credit limit alerts for sales and invoices, separate OCR settings for invoice creation, and an auto-complete feature for forms in the accounting module.
Improved image handling and global attribute changes for mailing lists in email marketing.
A default auto-signature option and a refuse-to-sign option in HR modules.
Options to divide and merge manufacturing orders, track the status of manufacturing orders, and more in the MRP module.
Dark mode in Odoo 17.
Now that the Odoo 17 announcement is official, let’s look at what’s new in Odoo 17!
What is Odoo ERP 17?
Odoo 17 is the latest version of one of the world’s leading open-source enterprise ERPs. This version has come up with significant improvements explained here in this blog. Also, this new version aims to introduce features that enhance time-saving, efficiency, and productivity for users across various organisations.
Odoo 17, released at the Odoo Experience 2023, brought notable improvements to the user interface and added new functionalities with enhancements in performance, accessibility, data analysis, and management, further expanding its reach in the market.
Consistent toolbox talks are critical for maintaining workplace safety, as they provide regular opportunities to address specific hazards and reinforce safe practices.
These brief, focused sessions ensure that safety is a continual conversation rather than a one-time event, which helps keep safety protocols fresh in employees' minds. Studies have shown that shorter, more frequent training sessions are more effective for retention and behavior change compared to longer, infrequent sessions.
Engaging workers regularly, toolbox talks promote a culture of safety, empower employees to voice concerns, and ultimately reduce the likelihood of accidents and injuries on site.
The traditional method of conducting safety talks with paper documents and lengthy meetings is not only time-consuming but also less effective. Manual tracking of attendance and compliance is prone to errors and inconsistencies, leading to gaps in safety communication and potential non-compliance with OSHA regulations. Switching to a digital solution like Safelyio offers significant advantages.
Safelyio automates the delivery and documentation of safety talks, ensuring consistency and accessibility. The microlearning approach breaks down complex safety protocols into manageable, bite-sized pieces, making it easier for employees to absorb and retain information.
This method minimizes disruptions to work schedules, eliminates the hassle of paperwork, and ensures that all safety communications are tracked and recorded accurately. Ultimately, using a digital platform like Safelyio enhances engagement, compliance, and overall safety performance on site. https://safelyio.com/
Measures in SQL (SIGMOD 2024, Santiago, Chile)Julian Hyde
SQL has attained widespread adoption, but Business Intelligence tools still use their own higher level languages based upon a multidimensional paradigm. Composable calculations are what is missing from SQL, and we propose a new kind of column, called a measure, that attaches a calculation to a table. Like regular tables, tables with measures are composable and closed when used in queries.
SQL-with-measures has the power, conciseness and reusability of multidimensional languages but retains SQL semantics. Measure invocations can be expanded in place to simple, clear SQL.
To define the evaluation semantics for measures, we introduce context-sensitive expressions (a way to evaluate multidimensional expressions that is consistent with existing SQL semantics), a concept called evaluation context, and several operations for setting and modifying the evaluation context.
A talk at SIGMOD, June 9–15, 2024, Santiago, Chile
Authors: Julian Hyde (Google) and John Fremlin (Google)
https://doi.org/10.1145/3626246.3653374
Microservice Teams - How the cloud changes the way we workSven Peters
A lot of technical challenges and complexity come with building a cloud-native and distributed architecture. The way we develop backend software has fundamentally changed in the last ten years. Managing a microservices architecture demands a lot of us to ensure observability and operational resiliency. But did you also change the way you run your development teams?
Sven will talk about Atlassian’s journey from a monolith to a multi-tenanted architecture and how it affected the way the engineering teams work. You will learn how we shifted to service ownership, moved to more autonomous teams (and its challenges), and established platform and enablement teams.
What to do when you have a perfect model for your software but you are constrained by an imperfect business model?
This talk explores the challenges of bringing modelling rigour to the business and strategy levels, and talking to your non-technical counterparts in the process.
Preparing Non - Technical Founders for Engaging a Tech AgencyISH Technologies
Preparing non-technical founders before engaging a tech agency is crucial for the success of their projects. It starts with clearly defining their vision and goals, conducting thorough market research, and gaining a basic understanding of relevant technologies. Setting realistic expectations and preparing a detailed project brief are essential steps. Founders should select a tech agency with a proven track record and establish clear communication channels. Additionally, addressing legal and contractual considerations and planning for post-launch support are vital to ensure a smooth and successful collaboration. This preparation empowers non-technical founders to effectively communicate their needs and work seamlessly with their chosen tech agency.Visit our site to get more details about this. Contact us today www.ishtechnologies.com.au
Mobile App Development Company In Noida | Drona InfotechDrona Infotech
Drona Infotech is a premier mobile app development company in Noida, providing cutting-edge solutions for businesses.
Visit Us For : https://www.dronainfotech.com/mobile-application-development/
Mobile App Development Company In Noida | Drona Infotech
Undo tech overview_201410
1. Copyright Undo Ltd, 2014
Introduction to UndoDB
Greg Law
Co-founder and CEO, Undo Ltd
2. Copyright Undo Ltd, 2014
Undo Overview
•Founded in 2005, with 25 man years development in debug technology Founder : Greg Law, Ph.D , Acorn, Solarflare, Nexwave,etc Founder: Julian Smith, Ph.D, Acorn, E-14, Broadcom, etc
•Well funded with $1.25 million raised in round 3.
−Backed financially by Cambridge Angels and Jaan Tallinn, co-founder Skype
−Currently 11 full time staff
•Market Momentum
−Revenue and headcount doubled in 2012 and 2013.
−OEMs with ARM (DS5 v5.16) and Rogue Wave (Totalview)
−Selected as Gartner Cool Vendor in Application Development for 2014.
−Customers include : NASA, Lawrence Livermore Labs, Cadence Design Systems, Mentor Graphics, Synopsys Inc.
3. Copyright Undo Ltd, 2014
Debugging Involves Backwards Reasoning
“Reason back from the state of the crashed program to determine what could have caused this. Debugging involves backwards reasoning, like solving murder mysteries. Something impossible occurred, and the only solid information is that it really did occur. So we must think backwards from the result to discover the reasons.”
Kernighan & Pike's The Practice of Programming
4. Copyright Undo Ltd, 2014
Debugging Involves Backwards Reasoning
“Reason back from the state of the crashed program to determine what could have caused this. Debugging involves backwards reasoning, like solving murder mysteries. Something impossible occurred, and the only solid information is that it really did occur. So we must think backwards from the result to discover the reasons.” Kernighan & Pike's The Practice of Programming
5. Copyright Undo Ltd, 2014
Debugging Involves Backwards Reasoning
“Reason back from the state of the crashed program to determine what could have caused this. Debugging involves backwards reasoning, like solving murder mysteries. Something impossible occurred, and the only solid information is that it really did occur. So we must think backwards from the result to discover the reasons.”
Kernighan & Pike's The Practice of Programming
•Regular debuggers give you pause/continue
6. Copyright Undo Ltd, 2014
Debugging Involves Backwards Reasoning
“Reason back from the state of the crashed program to determine what could have caused this. Debugging involves backwards reasoning, like solving murder mysteries. Something impossible occurred, and the only solid information is that it really did occur. So we must think backwards from the result to discover the reasons.”
Kernighan & Pike's The Practice of Programming
•Regular debuggers give you pause/continue
•UndoDB gives you a rewind button, etc
•CCTV for your code
7. Copyright Undo Ltd, 2014
Reversible Debugging for Real Code
A holy-grail of tools research for decades.
UndoDB is the first and only reversible debugger that is effective on real-world, complex software
•Used on many of the world’s most complex software projects Scientific supercomputing clusters (NASA Ames, LLNL, etc) EDA, Enterprise (several fortune 500 customers)
High performance, scalable, for compiled code on Linux
"I found the idea of the product amazing and a boon to my productivity... I have already been able to fix a deadlock that was driving me crazy for a week in only ten minutes!”
8. Copyright Undo Ltd, 2014
Performance is key
Patented checkpoint + replay approach
•Exploit the natural determinism of computers
•Reduces time/space overheads by many orders of magnitude
•Highly optimised JIT binary translation
Benchmark
•Time to ‘gzip’ a 16MB* file (gzip is mostly CPU bound, with some IO) * GDB times extrapolated from 16K file
Native
UndoDB
GDB “process record”
Time
1.49s
2.61s (1.75x)
21 hours (>50,000x)
Space
N/A
17.8MB
63GB
9. Copyright Undo Ltd, 2014
The Event Log
All non-deterministic events (syscalls, signals, thread switches) stored in the Event Log
−In record mode: operations executed as normal, and results stored in event log
−In replay mode: operations not executed, but results synthesized from the contents of the event log
Replay is therefore completely deterministic
No interaction with outside world in replay mode
10. Copyright Undo Ltd, 2014
The event log
Event log is a fixed size in memory
Fills up as your program runs
11. Copyright Undo Ltd, 2014
The event log
Event log is a fixed size in memory
Fills up as your program runs
12. Copyright Undo Ltd, 2014
The event log
Event log is a fixed size in memory
Fills up as your program runs
13. Copyright Undo Ltd, 2014
The event log
Event log is a fixed size in memory
Fills up as your program runs
14. Copyright Undo Ltd, 2014
The event log
Event log is a fixed size in memory
Fills up as your program runs
15. Copyright Undo Ltd, 2014
The event log
Event log is a fixed size in memory
Fills up as your program runs
16. Copyright Undo Ltd, 2014
The event log
Event log is a fixed size in memory
Fills up as your program runs
17. Copyright Undo Ltd, 2014
undodb-gdb: error: UndoDB's event log is full, so no more history can be recorded.
The event log
Event log is a fixed size in memory
Fills up as your program runs
When it’s full:
18. Copyright Undo Ltd, 2014
The event log
Event log is a fixed size in memory
Fills up as your program runs
When it’s full:
Go back in time
reverse-next
19. Copyright Undo Ltd, 2014
The event log
Event log is a fixed size in memory
Fills up as your program runs
When it’s full:
Go back in time
reverse-next
20. Copyright Undo Ltd, 2014
The event log
Event log is a fixed size in memory
Fills up as your program runs
When it’s full:
Go back in time, or
Increase its size
undodb-set-max-event-log-size 768M
21. Copyright Undo Ltd, 2014
The event log
Event log is a fixed size in memory
Fills up as your program runs
When it’s full:
Go back in time, or
Increase its size, or
Select circular mode
undodb-set-event-log-mode circular
22. Copyright Undo Ltd, 2014
The event log
Event log is a fixed size in memory
Fills up as your program runs
When it’s full:
Go back in time, or
Increase its size, or
Select circular mode
undodb-set-event-log-mode circular; continue
23. Copyright Undo Ltd, 2014
The event log
Event log is a fixed size in memory
Fills up as your program runs
When it’s full:
Go back in time, or
Increase its size, or
Select circular mode
undodb-gdb: error: UndoDB's event log is full...
24. Copyright Undo Ltd, 2014
The Event Log
Event log is a fixed size in memory
Fills up as your program runs
When it’s full:
Go back in time, or
Increase its size, or
Select circular mode
31. Copyright Undo Ltd, 2014
Threads
Scheduling is serialized, but preemptive
−Many race conditions can be reproduced
•But not all – e.g. missing or incorrect memory barrier
−Bigger impact on performance
Record: OS scheduler selects which thread runs next
Replay: UndoDB forces scheduling to mirror record
32. Copyright Undo Ltd, 2014
UndoDB Save/Load
Collaborate
Save a recording and send it to a colleague.
Load the recording onto another machine
Defer and prioritise
Capture now, debug later Save a recording for analysis later.
Capture sporadic/intermittent bugs and save them for later.
Protect against losing your data
Resilient to power or system failures -- never reproduce a bug a second time.
33. Copyright Undo Ltd, 2014
Record In-The-Field Failures
Undo Flight Recorder is a new product to record failures at the customer site
A library you link into your code and ship to your customers
By default, library is dormant. C API allows your program to enable recording
36. Copyright Undo Ltd, 2014
Flight Recorder
Your Executable
undofr.so
Ship to customer
37. Copyright Undo Ltd, 2014
Flight Recorder
Your
Executable
undofr.so
Ship to customer
Back to you – load into UndoDB recording
38. Copyright Undo Ltd, 2014
Good Kinds of Bug for UndoDB
1.Long run times
2.Frequently-called functions
3.Intermittent bugs
4.Stack corruption
5.Memory leaks
6.Real-time network protocols
7.Race conditions
8.Data structure corruption
9.Dynamic code
39. Copyright Undo Ltd, 2014
Good Kinds of Bug for UndoDB
1.Long run times
2.Frequently-called functions
3.Intermittent bugs
4.Stack corruption
5.Memory leaks
6.Real-time network protocols
7.Race conditions
8.Data structure corruption
9.Dynamic code
40. Copyright Undo Ltd, 2014
Good Kinds of Bug for UndoDB
1.Long run times
2.Frequently-called functions
3.Intermittent bugs
4.Stack corruption
5.Memory leaks
6.Real-time network protocols
7.Race conditions
8.Data structure corruption
9.Dynamic code
Demo #1
(square roots)
41. Copyright Undo Ltd, 2014
Good Bugs for UndoDB
1.Long run times
2.Frequently-called functions
3.Intermittent bugs
4.Stack corruption
5.Memory leaks
6.Real-time network protocols
7.Race conditions
8.Data structure corruption
9.Dynamic code
Demo #2
(stack smash)
42. Copyright Undo Ltd, 2014
Features and benefits
Works on unmodified Linux x86 and ARM systems and programs
•No kernel patches or modules, or special hardware requirements
•No recompilation or special libraries for program being debugged
•No restrictions on application to debug: threads, signals, shared memory, etc
Greatest value is on the bugs where:
•Effects manifest themselves a long time after underlying bug
•Non-deterministic “once in a blue moon” failures
•Large, unfamiliar codebases (“how did that happen?”)
Full-featured debugger
•Attach, watchpoints, etc.
•Fits seamlessly into your existing workflow (gdb / Eclipse / Emacs, etc)
43. Copyright Undo Ltd, 2014
Competition Time
Get the code at: http://undo-software.com/bugmug
Can you find the bug?
#bugmug @undosoft
support@undo-software.com
44. Copyright Undo Ltd, 2014
Support
Questions or problems: support@undo-software.com
If you suspect a bug in UndoDB:
−Run with --undodb-asserts-1 on the command line, or set UNDODB_debug_level_internal=2 env var to enable internal logging/extra checking
−On UndoDB crash, files a la undodb_log.1234 will be created; send these as attachments to Undo
−Alternatively, use maint-undodb-dump-internal-log command to dump the logs immediately
45. Copyright Undo Ltd, 2014
Part II UndoDB master class
Tips and tricks for better debugging
46. Copyright Undo Ltd, 2014
Timeline
“What time is it?”, or “Goto” a particular time:
undodb-get-n
undodb-goto-n
undodb-show-event-log-extent
Precise control of timeline:
undodb-set-bookmark and
undodb-goto-bookmark
Tip: Use these commands to binary chop
47. Copyright Undo Ltd, 2014
Record Mode and Replay Mode
When you first run, you’re in Record Mode
If you step forwards, you stay in Record Mode
Issue a reverse operation puts you in Replay Mode
48. Copyright Undo Ltd, 2014
Record/replay continued
Replaying forwards to the end of the event log takes you back into record mode (debugger will stop)
Use undodb-goto-record-mode to jump straight to record mode
−As with undodb-goto-n, will not hit breakpoints
State (registers, memory) can be modified in record mode, but not in replay mode
User issued function-calls (e.g. ‘call’ command from gdb prompt) can be issued from replay mode or record mode (see below)
49. Copyright Undo Ltd, 2014
The Event Log
All “non-deterministic” inputs are recorded
−System-calls
−Thread-switches
−Signals
−Non-deterministic instructions
−Shared memory reads (incl. DMA)
List events
maint-undodb-show-events b,e
maint-undodb-show-eventstats b,e
50. Copyright Undo Ltd, 2014
More on the Event Log
Increase the event-log size dynamically
undodb-set-max-event-log-size
Stop when the event log gets full (default)
undodb-event-log-mode straight
Record forever with a circular event log
undodb-event-log-mode circular
51. Copyright Undo Ltd, 2014
Performance tuning
Start recording later:
−Start with --undodb-defer-recording option
−Then when you’re ready: undodb-enable-record
−Note: you cannot go back to record recording was enabled
Overview of performance metrics
−maint-undodb-show-exec-summary
−Make sure your instrumentation heap is big enough:
--undodb-instr-heapsize 512M
−Look out for executing code in writable memory
approx 2x slower than executing for read-only memory
52. Copyright Undo Ltd, 2014
Snapshots
List existing snapshots
maint-undodb-show-snapshots
Beware memory consumption
e.g. --undodb-snapshots 5
Note that reverse opterations may be slower
Hint to create a snapshot soon
maint-undodb-snapshot
(will create a snapshot at next basic-block boundary)
53. Copyright Undo Ltd, 2014
More tips and tricks
No symbols/no backtrace?
reverse-stepi or reverse-finish
undodb-goto-n -1000
Set default command-line options
~/.undodb-gdb.defaults
Calling functions in debuggee/inferior
−Side-effects are discarded after function is run
Function is run in a temporary process
−Use our `infcall’ gdb patch to make this bullet-proof
e.g. break foo.c:42 if !memcmp( a, b, 32)
54. Copyright Undo Ltd, 2014
More tips and tricks
Autotrace feature
Attach to an executable by name rather than pid
--undodb-autotrace /path/to/myexe cmd
cmd is the command as executed; if it or a child process exec’s /path/to/myexec then undodb will attach to that
The path must be complete path or a glob
Work differently
−Don’t try to anticipate where to put breakpoints; run until the bug happens, then “think backwards”