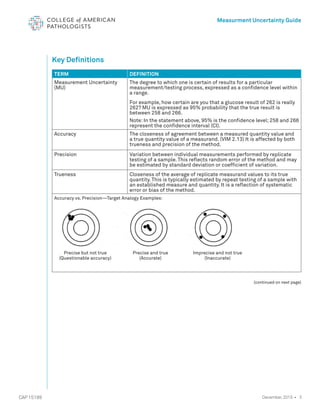
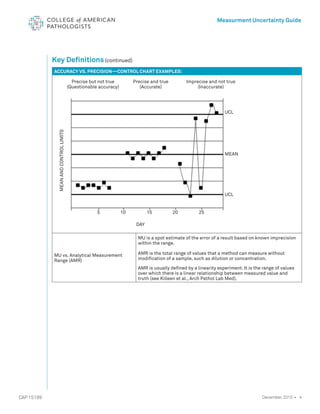
Measurement
Uncertainty Guide
ISO 15189 Accreditation Program
2
December, 2015 •
CAP 15189
CAP 15189
Background—Why This is Necessary
The ISO 15189:2012 standard contains enhanced expectations regarding measurement
uncertainty (MU) in clause 5.5.1.4. To clarify the laboratory’s responsibility and the CAP’s 15189
assessment standards, we have developed this interpretive document for the purposes of
accreditation.
ISO 15189 MU Requirements Summary
Clause 5.5.1.4 states that laboratories “shall determine measurement uncertainty for each
measurement procedure in the examination phase used to report measured quantity values.”
It also states that “Upon request, the laboratory shall make its estimates of measurement
uncertainty available to laboratory users.”
CAP Guidance Summary
Laboratories in the CAP Laboratory Accreditation Program satisfy most of what is necessary to
meet the ISO 15189 clause regarding MU. They do so through the following ongoing routines:
			 • Quality Control (QC)
			 • Proficiency testing (PT)
			 • Calibration
			 • Multi-instrument comparison
			 • Method comparison
			 • Generation of data supporting the analytical measurement range
				 as defined by the medical director
We recommend that laboratories (1) ensure that they have access to the confidence levels for
their tests, derived from QC and other analytical processes, and (2) be able to supply a procedure
that describes the quality routines that support the validity of the stated confidence levels. For an
example of such a procedure, see Appendix A.
Exclusion
This guideline does not apply to point-of-care testing (POCT).
3
CAP 15189
Measurment Uncertainty Guide
December, 2015 •
Key Definitions
TERM DEFINITION
Measurement Uncertainty
(MU)
The degree to which one is certain of results for a particular
measurement/testing process, expressed as a confidence level within
a range.
For example, how certain are you that a glucose result of 262 is really
262? MU is expressed as 95% probability that the true result is
between 258 and 266.
Note: In the statement above, 95% is the confidence level; 258 and 266
represent the confidence interval (CI).
Accuracy The closeness of agreement between a measured quantity value and
a true quantity value of a measurand. (VIM 2.13) It is affected by both
trueness and precision of the method.
Precision Variation between individual measurements performed by replicate
testing of a sample. This reflects random error of the method and may
be estimated by standard deviation or coefficient of variation.
Trueness Closeness of the average of replicate measurand values to its true
quantity. This is typically estimated by repeat testing of a sample with
an established measure and quantity. It is a reflection of systematic
error or bias of the method.
Accuracy vs. Precision—Target Analogy Examples:
­
(continued on next page)
Precise but not true
(Questionable accuracy)
Precise and true
(Accurate)
Imprecise and not true
(Inaccurate)
4
CAP 15189
Measurment Uncertainty Guide
December, 2015 •
ACCURACY VS. PRECISION—CONTROL CHART EXAMPLES:
MU vs. Analytical Measurement
Range (AMR)
MU is a spot estimate of the error of a result based on known imprecision
within the range.
AMR is the total range of values that a method can measure without
modification of a sample, such as dilution or concentration.
AMR is usually defined by a linearity experiment. It is the range of values
over which there is a linear relationship between measured value and
truth (see Killeen et al., Arch Pathol Lab Med).
Key Definitions(continued)
DAY
UCL
MEAN
UCL
MEAN
AND
CONTROL
LIMITS
5 10 15		 20 25
Precise and true
(Accurate)
Imprecise and not true
(Inaccurate)
Precise but not true
(Questionable accuracy)
5
CAP 15189
Measurment Uncertainty Guide
December, 2015 •
Assumptions
1. 	 Working Group 2 (WG2) of the ISO Technical Committee 212 (TC212) is developing a technical
specification for MU in the medical laboratory. It is currently in the early stages and publication
is not expected in the immediate future. Once published, the CAP 15189 program will review the
document and make appropriate changes based on its recommendations.
	
As a technical specification, the TC212 WG2 document will not be a standard and will not represent an
absolute requirement; however, as the product of international experts, it will provide a guide to best
practices for the assessment of MU. This current CAP15189 guideline is a first attempt at establishing
expectations for this program using several sources, including the preliminary draft of the TC212 WG2
technical specification.
2. 	
Variability caused by pre-analytical processes often creates the largest source of uncertainty in the
result from a medical decision standpoint. For the purposes of assessment and accreditation
decision, clarify what you are incorporating into your MU when you provide it to a clinician and give
an MU assessment most suited for the clinical situation. (For risk assessment, see the document
CAP 15189 Program—Risk Management Guideline for Laboratories. This can be found at cap.org/
cap15189 under Additional Resources.)
3. 	 Proficiency testing itself is insufficient to assess the entire MU. Accuracy-based PT does provide
a higher-order (reference) target for its material, which can be used to assess bias/systematic error.
This, though, is still at best an indication of the true bias of the method being evaluated.
	
TC212 WG2 is considering how to deal with bias assessment, because for most measurands the
typical clinical laboratory has no way to really assess bias. Although bias is properly assessed
against a sample with known quantity, calibration is intended to provide long-term stability for the
measurement method, and the CAP 15189 program will for the interim accept proper calibration
records as providing minimal bias in the assessment of MU.
4. 	 The short-term QC CV is inadequate for computing your MU. The laboratory will need sufficient QC 		
data (minimum 20 data points, ideally near 100) to gain representative data on lot changes,
instrument maintenance, etc. However it is not necessary to keep changing the MU for each
measurand your laboratory reports.
Note: The CAP supports the guidance offered by James Westgard:“While there is a ‘rule of thumb’
that a minimum of 20 controlled measurements should be used to calculate an SD for setting control
limits; many more are needed to obtain a reliable estimate of the SD…It would seem prudent to aim
for at least 100 measurements when estimating MU.” Westgard JO. Basic Quality Management
Systems, Madison, WI: Westgard QC, Inc.; 2014, p. 231.
5. 	 When the ISO 15189 standard refers to “performance requirements,” it is referring to
confidence levels.
6. 	 Confidence levels should be approved by the laboratory medical director.
6
CAP 15189
Measurment Uncertainty Guide
December, 2015 •
Guidelines
1. 	 For each of its quantitative tests, a laboratory must have MU values that it can provide if requested.
	
Example:
	 The MU for Serum Potassium is:

At a level near 4.19 mmol/L, MU is +/- 0.52 mmol/L; (95% CI = 3.67 - 4.71 mmol/L)
At a level near 4.69 mmol/L, MU is +/- 0.61 mmol/L; (95% CI = 4.08 - 5.3 mmol/L)
At a level near 7.15 mmol/L, MU is +/- 0.84 mmol/L; (95% CI = 6.31 - 7.99 mmol/L)
(For complete example, see Appendix B.)
2. 	 Your laboratory does not have to report out the MU with every result, but it must be able to supply it
to any clinician who requests it. The laboratory must define and approve it. The laboratory must set
performance requirements for MU, expressed as a confidence level within a range.
3. 	 The laboratory should have a procedure that describes the quality routines that support the validity
of the stated confidence levels (or “a process to determine its MU”).
For an example, see Appendix A.
7
CAP 15189
Measurment Uncertainty Guide
December, 2015 •
Suggestions/Best Practices
1. 	MU is best calculated in response to clinician inquiry, because calibration error (systematic error)
and imprecision (random error) vary over time. The laboratory may choose to assess MU for a
method as part of its method validation/verification workup or may choose to have a process
available for calculating a current estimate of MU when required, within a reasonable time frame
that allows a timely response to request this information.
			
Though not required by the CAP 15189 program, a best practice would be to do both: make an initial
estimate of MU during method validation/verification to assess the error that might be seen with the
method, and have a process to re-evaluate MU in response to a clinical inquiry.
2. 	The practical estimation of MU comes down to calculating the SD from statistical quality control
data, then multiplying that SD by a factor of two to provide a conventional 95% confidence limit
for a test result.
				 • 	 Typically done using Gaussian statistics, a coverage factor of 1.95 or 2 is often used to give
expanded measurement uncertainty coverage of approximately 95% (roughly assuming that 		
95% of the time the true value for the specimen in question would be in this range).
				 • 	 Bias is ignored in this approach, as it assumes that the method calibration is traceable with
minimal error to a “true” reference value. If the error in the calibrator(s) is known, include it in 		
the MU calculation; however, when using commercial calibrators, this often is not provided to 		
the laboratory and therefore cannot be determined or included in the MU calculation.
				 • 	 The laboratory must ensure that the allowable calibration error is small relative to the random
error calculated from statistical quality control data. For analyzer-based methods using
multipoint calibration, the error for each calibrator is typically included in the calibration report.
Single-point calibrations are usually assumed as having no calibration error.
3. 	As stated in ISO 15189:2012 5.5.1.4, Note 3, examples of the practical utility of measurement
uncertainty estimates might include the following:
				 • Confirmation that patients’ values meet quality goals set by the laboratory
				 • Meaningful comparison of a patient value with a previous value of the same type or with a
				 clinical decision value
		
4. MU is dependent on intermediate actions, for example:
				 • Calibration results
				 • PT results
				
If calibration fails repeatedly, or you see numerous outliers in your PT, you should reevaluate
your MU calculation.
5. 	
If you either (1) detect an instrument out of calibration, or (2) fail PT for reasons other than clerical
error, this negates the MU assessment, because it calls into question whether you have a stable
system.
6. 	If, in the course of testing QC material, after 100 data points, your measurement falls outside the 2 		
SD range, you should investigate the event. Check with testing personnel for anything unusual, such
as QC material that is old, or material that was not mixed well. Consider whether the impact was big
enough that it might affect MU. With measurements outside the 2 SD range, there is a high
probability that something changed with the population or measurement system.
7. 	MU may be influenced by routine changes such as changes of reagent batches, different operators,
new operators, or scheduled instrument maintenance. When you have such changes, you should
consider whether you need to recalculate your MU. If you change methodology for the test, you must
recalculate your MU.
8
CAP 15189
Measurment Uncertainty Guide
December, 2015 •
How the CAP Will Assess MU
1. 	 Throughout the life of the analyzer, or other mechanical or manual test method, assessors will look
at the following in assessing MU:
• Calibration results
• PT results
• 
Testing data that supports analytical measurement range (AMR), or MU, as defined by the medical
director
• QC (mean, 2 SD; Is laboratory achieving its own range?)
• Multi-instrument comparison
• Method comparison
2. 	 The CAP will sample validation records. The CAP will determine the fit with results (number of
corrected results).
3. 	 The CAP will ask how the laboratory came up with MU for a specific analyte. If the laboratory
chooses to specify a process for calculating MU to be used when needed, rather than relying on
prior estimations for all methods, examples should be available and the laboratory must be ready
to perform an estimation during the assessment for any method when asked by the assessors.
References
1. 	
Joint Committee for Guides in Metrology. JCGM 200:2012, International vocabulary of metrology—
Basic and general concepts and associated terms (VIM) 3rd edition 2008 version with minor
corrections. JCGM website. Available at:http://www.bipm.org/en/publications/guides/ Accessed
August 30, 2015.
2. 	 Westgard JO. Basic Quality Management Systems, Madison, WI: Westgard QC, Inc.; 2014.
3. 	 Anthony A. Killeen, Tom Long, Rhona Souers, Patricia Styer, Christina B. Ventura, and George G. Klee
(2014) Verifying Performance Characteristics of Quantitative Analytical Systems: Calibration
Verification, Linearity, and Analytical Measurement Range. Archives of Pathology  Laboratory
Medicine: September 2014, Vol. 138, No. 9, pp. 1173-1181. Available at:
http://dx.doi.org/10.5858/arpa.2013-0051-CP Accessed August 30, 2015.
Measurment Uncertainty Guide
December, 2015 • 9
October, 2015 •
CAP 15189
Appendix A - Sample Procedure Supporting MU
The following procedure explains the activities and routines that support the validity of the reported con-
fidence levels for a given test.
Quality Activities Supporting Validity of Serum Potassium Test
STEP WHO WHAT DETAIL
1 Testing Personnel Calibration Performed every 2 weeks
2 Testing Personnel QC Performed daily per shift or every 8
hours
3 All Testing Personnel PT Performed 2-3 times per year as
required
4 Senior Testing Personnel Multi-instrument
comparison
Performed every 6 months
5 Senior Testing Personnel Method comparison Performed every 6 months
6 Supervisor Training of testing
personnel
Provided to testing personnel initially
when hired
7 Supervisor Competency program
Competency verified using the CAP
Competency Assessment Program
twice during the first year and once
annually thereafter
8
Laboratory Medical
Director
IQCP for test
Performed once per year or more
frequently if warranted by test
circumstances or volume
10
CAP 15189
Measurment Uncertainty Guide
December, 2015 •
Appendix B–Example of MU Documentation

See the following pages for an example of statistical records and values that would meet the standard for
Measurement Uncertainty. Note that there is no requirement to set up your MU calculations in this way.
Measurement Uncertainty Example
Measurement Uncertainty Review
Version 1.1 (Month, Day, Year)
1. Define the measurand:Serum Potassium.
Assay Atomic Absorption
Analyzer 1: Agilent GC-FID
Analyzer 2:
Analyzer 3:
Analyzer 4:
2. Calculate the weighted mean for each level QC across all instruments and QC lots.
3. Calculate the weighted SD for each level QC across all instruments and QC lots.
LEVEL 1 QC Analyzer 1 Analyzer 2 Analyzer 3 Analyzer 4
Month/Year N Mean SD N Mean SD N Mean SD N Mean SD
March-12 26 5.08 0.54
April-12 6 5.07 0.63
May-12 17 4.65 0.38
June-12 18 4.48 0.12
July-12 18 4.46 0.16
August-12 20 4.49 0.16
Period 7
Period 8
								
Weighted
Stats
N Mean SD N Mean SD N Mean SD N Mean SD
Per Analyzer 105 4.69 0.31 0 0 0 0 0 0 0 0 0
Weighted Stats N Mean SD
All Analyzers 105 4.69 0.31
									
Specimen: Serum
Units: mmol/L
# decimals: 2
Performance
Goal:
Coefficient of variation
(or relative uncertainty)
is less than 15%
11
CAP 15189
Measurment Uncertainty Guide
December, 2015 •
LEVEL 2 QC Analyzer 1 Analyzer 2 Analyzer 3 Analyzer 4
Month/Year N Mean SD N Mean SD N Mean SD N Mean SD
March-12 26 4.55 0.47
April-12 6 4.22 0.26
May-12 18 4.14 0.31
June-12 18 4.07 0.2
July-12 19 4.47 0.12
August-12 20 4 0.14
Period 7
Period 8
												
Weighted
Stats
N Mean SD N Mean SD N Mean SD N Mean SD
Per Analyzer 107 4.19 0.262 0 0 0 0 0 0 0 0 0
Weighted
Stats
N Mean SD
All Analyzers 107 4.19 0.262
LEVEL 3 QC Analyzer 1 Analyzer 2 Analyzer 3 Analyzer 4
Month/Year N Mean SD N Mean SD N Mean SD N Mean SD
March-12 26 7.56 0.72
April-12 6 7.16 0.47
May-12 18 7.11 0.76
June-12 18 6.94 0.25
July-12 19 6.99 0.16
August-12 20 6.97 0.13
Period 7
Period 8
Weighted
Stats
N Mean SD N Mean SD N Mean SD N Mean SD
Per Analyzer 107 7.15 0.424 0 0 0 0 0 0 0 0 0
Weighted
Stats
N Mean SD
All Analyzers 107 7.15 0.424
12
CAP 15189
Measurment Uncertainty Guide
December, 2015 •
4. Calculate the combined uncertainty (Uc) of the weighted SD and calibrator if available (or treat
as zero)
5. Determine the expanded uncertainty (U) at a 95%coverage factor (k=1.96)1
Weighted SD U calibrator Combined U k-value Expanded U
QC Level 1 0.31 0 0.31 1.96 0.61
QC Level 2 0.262 0 0.262 1.96 0.52
QC Level 3 0.424 0 0.424 1.96 0.84
Note 1–The 1.96 k-value is used to create an even 95% confidence interval, since two full standard
deviations actually correspond to 95.4 of all measured results.
6. Determine the relative uncertainty by dividing the combined uncertainty by the weighted mean.
Weighted Mean Combined U
Relative U
(Coefficient
of Variation)
Comment Meets goal?
QC Level 1 4.69 0.31 6.6%
Method meets acceptable per-
formance if relative CV is less
than specified goal
YES
QC Level 2 4.19 0.262 6.3% YES
QC Level 3 7.15 0.424 5.9% YES
Interpretation of Measurement Uncertainty
The result will be +/- the Expanded Uncertainty with 95% confidence (i.e., correct 19/20 times)
The MU for AA (serum) is:
At a level near 4.19 mmol/L, MU is +/- 0.52 mmol/L; (95% CI = 3.67 - 4.71 mmol/L)
At a level near 4.69 mmol/L, MU is +/- 0.61 mmol/L; (95% CI = 4.08 - 5.3 mmol/L)
At a level near 7.15 mmol/L, MU is +/- 0.84 mmol/L (95% CI = 6.31 - 7.99 mmol/L)
See graph on next page.
13
CAP 15189
Measurment Uncertainty Guide
December, 2015 •
True MEAN Values
4.19 4.19
4.69 4.69
7.15 7.15
Lower Limits of 95% Confidence
4.19 3.67
4.69 4.08
7.15 6.31
Upper Limits of 95% Confidence
4.19 4.71
4.69 5.3
7.15 7.99
x y
Slope y-inter
≤4.69 Upper 1.18 -0.2342
≤4.69 Lower 0.82 0.2342
4.69 Upper 1.093496 0.1715
4.69 Lower 0.906504 -0.1715
14
CAP 15189
Measurment Uncertainty Guide
December, 2015 •
Note: For a copy of the Excel spreadsheet (MU Calculation Tool.xlsx) used for the calculation on the
previous page, go to cap.org, search for the CAP 15189 website, and look under Additional Resources.
Or send a request marked MU Calculation Tool to cap15189@cap.org.
Sign-off and Review
Date entered
by:
Clinician name Date: Month, Day, Year Initials:
Reviewed by: Date: Initials:
© 2014 College of American Pathologists. All rights reserved.
24114.1015

Uncertainty (ASCP)

  • 1.
  • 2.
    2 December, 2015 • CAP15189 CAP 15189 Background—Why This is Necessary The ISO 15189:2012 standard contains enhanced expectations regarding measurement uncertainty (MU) in clause 5.5.1.4. To clarify the laboratory’s responsibility and the CAP’s 15189 assessment standards, we have developed this interpretive document for the purposes of accreditation. ISO 15189 MU Requirements Summary Clause 5.5.1.4 states that laboratories “shall determine measurement uncertainty for each measurement procedure in the examination phase used to report measured quantity values.” It also states that “Upon request, the laboratory shall make its estimates of measurement uncertainty available to laboratory users.” CAP Guidance Summary Laboratories in the CAP Laboratory Accreditation Program satisfy most of what is necessary to meet the ISO 15189 clause regarding MU. They do so through the following ongoing routines: • Quality Control (QC) • Proficiency testing (PT) • Calibration • Multi-instrument comparison • Method comparison • Generation of data supporting the analytical measurement range as defined by the medical director We recommend that laboratories (1) ensure that they have access to the confidence levels for their tests, derived from QC and other analytical processes, and (2) be able to supply a procedure that describes the quality routines that support the validity of the stated confidence levels. For an example of such a procedure, see Appendix A. Exclusion This guideline does not apply to point-of-care testing (POCT).
  • 3.
    3 CAP 15189 Measurment UncertaintyGuide December, 2015 • Key Definitions TERM DEFINITION Measurement Uncertainty (MU) The degree to which one is certain of results for a particular measurement/testing process, expressed as a confidence level within a range. For example, how certain are you that a glucose result of 262 is really 262? MU is expressed as 95% probability that the true result is between 258 and 266. Note: In the statement above, 95% is the confidence level; 258 and 266 represent the confidence interval (CI). Accuracy The closeness of agreement between a measured quantity value and a true quantity value of a measurand. (VIM 2.13) It is affected by both trueness and precision of the method. Precision Variation between individual measurements performed by replicate testing of a sample. This reflects random error of the method and may be estimated by standard deviation or coefficient of variation. Trueness Closeness of the average of replicate measurand values to its true quantity. This is typically estimated by repeat testing of a sample with an established measure and quantity. It is a reflection of systematic error or bias of the method. Accuracy vs. Precision—Target Analogy Examples: ­ (continued on next page) Precise but not true (Questionable accuracy) Precise and true (Accurate) Imprecise and not true (Inaccurate)
  • 4.
    4 CAP 15189 Measurment UncertaintyGuide December, 2015 • ACCURACY VS. PRECISION—CONTROL CHART EXAMPLES: MU vs. Analytical Measurement Range (AMR) MU is a spot estimate of the error of a result based on known imprecision within the range. AMR is the total range of values that a method can measure without modification of a sample, such as dilution or concentration. AMR is usually defined by a linearity experiment. It is the range of values over which there is a linear relationship between measured value and truth (see Killeen et al., Arch Pathol Lab Med). Key Definitions(continued) DAY UCL MEAN UCL MEAN AND CONTROL LIMITS 5 10 15 20 25 Precise and true (Accurate) Imprecise and not true (Inaccurate) Precise but not true (Questionable accuracy)
  • 5.
    5 CAP 15189 Measurment UncertaintyGuide December, 2015 • Assumptions 1. Working Group 2 (WG2) of the ISO Technical Committee 212 (TC212) is developing a technical specification for MU in the medical laboratory. It is currently in the early stages and publication is not expected in the immediate future. Once published, the CAP 15189 program will review the document and make appropriate changes based on its recommendations. As a technical specification, the TC212 WG2 document will not be a standard and will not represent an absolute requirement; however, as the product of international experts, it will provide a guide to best practices for the assessment of MU. This current CAP15189 guideline is a first attempt at establishing expectations for this program using several sources, including the preliminary draft of the TC212 WG2 technical specification. 2. Variability caused by pre-analytical processes often creates the largest source of uncertainty in the result from a medical decision standpoint. For the purposes of assessment and accreditation decision, clarify what you are incorporating into your MU when you provide it to a clinician and give an MU assessment most suited for the clinical situation. (For risk assessment, see the document CAP 15189 Program—Risk Management Guideline for Laboratories. This can be found at cap.org/ cap15189 under Additional Resources.) 3. Proficiency testing itself is insufficient to assess the entire MU. Accuracy-based PT does provide a higher-order (reference) target for its material, which can be used to assess bias/systematic error. This, though, is still at best an indication of the true bias of the method being evaluated. TC212 WG2 is considering how to deal with bias assessment, because for most measurands the typical clinical laboratory has no way to really assess bias. Although bias is properly assessed against a sample with known quantity, calibration is intended to provide long-term stability for the measurement method, and the CAP 15189 program will for the interim accept proper calibration records as providing minimal bias in the assessment of MU. 4. The short-term QC CV is inadequate for computing your MU. The laboratory will need sufficient QC data (minimum 20 data points, ideally near 100) to gain representative data on lot changes, instrument maintenance, etc. However it is not necessary to keep changing the MU for each measurand your laboratory reports. Note: The CAP supports the guidance offered by James Westgard:“While there is a ‘rule of thumb’ that a minimum of 20 controlled measurements should be used to calculate an SD for setting control limits; many more are needed to obtain a reliable estimate of the SD…It would seem prudent to aim for at least 100 measurements when estimating MU.” Westgard JO. Basic Quality Management Systems, Madison, WI: Westgard QC, Inc.; 2014, p. 231. 5. When the ISO 15189 standard refers to “performance requirements,” it is referring to confidence levels. 6. Confidence levels should be approved by the laboratory medical director.
  • 6.
    6 CAP 15189 Measurment UncertaintyGuide December, 2015 • Guidelines 1. For each of its quantitative tests, a laboratory must have MU values that it can provide if requested. Example: The MU for Serum Potassium is: At a level near 4.19 mmol/L, MU is +/- 0.52 mmol/L; (95% CI = 3.67 - 4.71 mmol/L) At a level near 4.69 mmol/L, MU is +/- 0.61 mmol/L; (95% CI = 4.08 - 5.3 mmol/L) At a level near 7.15 mmol/L, MU is +/- 0.84 mmol/L; (95% CI = 6.31 - 7.99 mmol/L) (For complete example, see Appendix B.) 2. Your laboratory does not have to report out the MU with every result, but it must be able to supply it to any clinician who requests it. The laboratory must define and approve it. The laboratory must set performance requirements for MU, expressed as a confidence level within a range. 3. The laboratory should have a procedure that describes the quality routines that support the validity of the stated confidence levels (or “a process to determine its MU”). For an example, see Appendix A.
  • 7.
    7 CAP 15189 Measurment UncertaintyGuide December, 2015 • Suggestions/Best Practices 1. MU is best calculated in response to clinician inquiry, because calibration error (systematic error) and imprecision (random error) vary over time. The laboratory may choose to assess MU for a method as part of its method validation/verification workup or may choose to have a process available for calculating a current estimate of MU when required, within a reasonable time frame that allows a timely response to request this information. Though not required by the CAP 15189 program, a best practice would be to do both: make an initial estimate of MU during method validation/verification to assess the error that might be seen with the method, and have a process to re-evaluate MU in response to a clinical inquiry. 2. The practical estimation of MU comes down to calculating the SD from statistical quality control data, then multiplying that SD by a factor of two to provide a conventional 95% confidence limit for a test result. • Typically done using Gaussian statistics, a coverage factor of 1.95 or 2 is often used to give expanded measurement uncertainty coverage of approximately 95% (roughly assuming that 95% of the time the true value for the specimen in question would be in this range). • Bias is ignored in this approach, as it assumes that the method calibration is traceable with minimal error to a “true” reference value. If the error in the calibrator(s) is known, include it in the MU calculation; however, when using commercial calibrators, this often is not provided to the laboratory and therefore cannot be determined or included in the MU calculation. • The laboratory must ensure that the allowable calibration error is small relative to the random error calculated from statistical quality control data. For analyzer-based methods using multipoint calibration, the error for each calibrator is typically included in the calibration report. Single-point calibrations are usually assumed as having no calibration error. 3. As stated in ISO 15189:2012 5.5.1.4, Note 3, examples of the practical utility of measurement uncertainty estimates might include the following: • Confirmation that patients’ values meet quality goals set by the laboratory • Meaningful comparison of a patient value with a previous value of the same type or with a clinical decision value 4. MU is dependent on intermediate actions, for example: • Calibration results • PT results If calibration fails repeatedly, or you see numerous outliers in your PT, you should reevaluate your MU calculation. 5. If you either (1) detect an instrument out of calibration, or (2) fail PT for reasons other than clerical error, this negates the MU assessment, because it calls into question whether you have a stable system. 6. If, in the course of testing QC material, after 100 data points, your measurement falls outside the 2 SD range, you should investigate the event. Check with testing personnel for anything unusual, such as QC material that is old, or material that was not mixed well. Consider whether the impact was big enough that it might affect MU. With measurements outside the 2 SD range, there is a high probability that something changed with the population or measurement system. 7. MU may be influenced by routine changes such as changes of reagent batches, different operators, new operators, or scheduled instrument maintenance. When you have such changes, you should consider whether you need to recalculate your MU. If you change methodology for the test, you must recalculate your MU.
  • 8.
    8 CAP 15189 Measurment UncertaintyGuide December, 2015 • How the CAP Will Assess MU 1. Throughout the life of the analyzer, or other mechanical or manual test method, assessors will look at the following in assessing MU: • Calibration results • PT results • Testing data that supports analytical measurement range (AMR), or MU, as defined by the medical director • QC (mean, 2 SD; Is laboratory achieving its own range?) • Multi-instrument comparison • Method comparison 2. The CAP will sample validation records. The CAP will determine the fit with results (number of corrected results). 3. The CAP will ask how the laboratory came up with MU for a specific analyte. If the laboratory chooses to specify a process for calculating MU to be used when needed, rather than relying on prior estimations for all methods, examples should be available and the laboratory must be ready to perform an estimation during the assessment for any method when asked by the assessors. References 1. Joint Committee for Guides in Metrology. JCGM 200:2012, International vocabulary of metrology— Basic and general concepts and associated terms (VIM) 3rd edition 2008 version with minor corrections. JCGM website. Available at:http://www.bipm.org/en/publications/guides/ Accessed August 30, 2015. 2. Westgard JO. Basic Quality Management Systems, Madison, WI: Westgard QC, Inc.; 2014. 3. Anthony A. Killeen, Tom Long, Rhona Souers, Patricia Styer, Christina B. Ventura, and George G. Klee (2014) Verifying Performance Characteristics of Quantitative Analytical Systems: Calibration Verification, Linearity, and Analytical Measurement Range. Archives of Pathology Laboratory Medicine: September 2014, Vol. 138, No. 9, pp. 1173-1181. Available at: http://dx.doi.org/10.5858/arpa.2013-0051-CP Accessed August 30, 2015.
  • 9.
    Measurment Uncertainty Guide December,2015 • 9 October, 2015 • CAP 15189 Appendix A - Sample Procedure Supporting MU The following procedure explains the activities and routines that support the validity of the reported con- fidence levels for a given test. Quality Activities Supporting Validity of Serum Potassium Test STEP WHO WHAT DETAIL 1 Testing Personnel Calibration Performed every 2 weeks 2 Testing Personnel QC Performed daily per shift or every 8 hours 3 All Testing Personnel PT Performed 2-3 times per year as required 4 Senior Testing Personnel Multi-instrument comparison Performed every 6 months 5 Senior Testing Personnel Method comparison Performed every 6 months 6 Supervisor Training of testing personnel Provided to testing personnel initially when hired 7 Supervisor Competency program Competency verified using the CAP Competency Assessment Program twice during the first year and once annually thereafter 8 Laboratory Medical Director IQCP for test Performed once per year or more frequently if warranted by test circumstances or volume
  • 10.
    10 CAP 15189 Measurment UncertaintyGuide December, 2015 • Appendix B–Example of MU Documentation See the following pages for an example of statistical records and values that would meet the standard for Measurement Uncertainty. Note that there is no requirement to set up your MU calculations in this way. Measurement Uncertainty Example Measurement Uncertainty Review Version 1.1 (Month, Day, Year) 1. Define the measurand:Serum Potassium. Assay Atomic Absorption Analyzer 1: Agilent GC-FID Analyzer 2: Analyzer 3: Analyzer 4: 2. Calculate the weighted mean for each level QC across all instruments and QC lots. 3. Calculate the weighted SD for each level QC across all instruments and QC lots. LEVEL 1 QC Analyzer 1 Analyzer 2 Analyzer 3 Analyzer 4 Month/Year N Mean SD N Mean SD N Mean SD N Mean SD March-12 26 5.08 0.54 April-12 6 5.07 0.63 May-12 17 4.65 0.38 June-12 18 4.48 0.12 July-12 18 4.46 0.16 August-12 20 4.49 0.16 Period 7 Period 8 Weighted Stats N Mean SD N Mean SD N Mean SD N Mean SD Per Analyzer 105 4.69 0.31 0 0 0 0 0 0 0 0 0 Weighted Stats N Mean SD All Analyzers 105 4.69 0.31 Specimen: Serum Units: mmol/L # decimals: 2 Performance Goal: Coefficient of variation (or relative uncertainty) is less than 15%
  • 11.
    11 CAP 15189 Measurment UncertaintyGuide December, 2015 • LEVEL 2 QC Analyzer 1 Analyzer 2 Analyzer 3 Analyzer 4 Month/Year N Mean SD N Mean SD N Mean SD N Mean SD March-12 26 4.55 0.47 April-12 6 4.22 0.26 May-12 18 4.14 0.31 June-12 18 4.07 0.2 July-12 19 4.47 0.12 August-12 20 4 0.14 Period 7 Period 8 Weighted Stats N Mean SD N Mean SD N Mean SD N Mean SD Per Analyzer 107 4.19 0.262 0 0 0 0 0 0 0 0 0 Weighted Stats N Mean SD All Analyzers 107 4.19 0.262 LEVEL 3 QC Analyzer 1 Analyzer 2 Analyzer 3 Analyzer 4 Month/Year N Mean SD N Mean SD N Mean SD N Mean SD March-12 26 7.56 0.72 April-12 6 7.16 0.47 May-12 18 7.11 0.76 June-12 18 6.94 0.25 July-12 19 6.99 0.16 August-12 20 6.97 0.13 Period 7 Period 8 Weighted Stats N Mean SD N Mean SD N Mean SD N Mean SD Per Analyzer 107 7.15 0.424 0 0 0 0 0 0 0 0 0 Weighted Stats N Mean SD All Analyzers 107 7.15 0.424
  • 12.
    12 CAP 15189 Measurment UncertaintyGuide December, 2015 • 4. Calculate the combined uncertainty (Uc) of the weighted SD and calibrator if available (or treat as zero) 5. Determine the expanded uncertainty (U) at a 95%coverage factor (k=1.96)1 Weighted SD U calibrator Combined U k-value Expanded U QC Level 1 0.31 0 0.31 1.96 0.61 QC Level 2 0.262 0 0.262 1.96 0.52 QC Level 3 0.424 0 0.424 1.96 0.84 Note 1–The 1.96 k-value is used to create an even 95% confidence interval, since two full standard deviations actually correspond to 95.4 of all measured results. 6. Determine the relative uncertainty by dividing the combined uncertainty by the weighted mean. Weighted Mean Combined U Relative U (Coefficient of Variation) Comment Meets goal? QC Level 1 4.69 0.31 6.6% Method meets acceptable per- formance if relative CV is less than specified goal YES QC Level 2 4.19 0.262 6.3% YES QC Level 3 7.15 0.424 5.9% YES Interpretation of Measurement Uncertainty The result will be +/- the Expanded Uncertainty with 95% confidence (i.e., correct 19/20 times) The MU for AA (serum) is: At a level near 4.19 mmol/L, MU is +/- 0.52 mmol/L; (95% CI = 3.67 - 4.71 mmol/L) At a level near 4.69 mmol/L, MU is +/- 0.61 mmol/L; (95% CI = 4.08 - 5.3 mmol/L) At a level near 7.15 mmol/L, MU is +/- 0.84 mmol/L (95% CI = 6.31 - 7.99 mmol/L) See graph on next page.
  • 13.
    13 CAP 15189 Measurment UncertaintyGuide December, 2015 • True MEAN Values 4.19 4.19 4.69 4.69 7.15 7.15 Lower Limits of 95% Confidence 4.19 3.67 4.69 4.08 7.15 6.31 Upper Limits of 95% Confidence 4.19 4.71 4.69 5.3 7.15 7.99 x y Slope y-inter ≤4.69 Upper 1.18 -0.2342 ≤4.69 Lower 0.82 0.2342 4.69 Upper 1.093496 0.1715 4.69 Lower 0.906504 -0.1715
  • 14.
    14 CAP 15189 Measurment UncertaintyGuide December, 2015 • Note: For a copy of the Excel spreadsheet (MU Calculation Tool.xlsx) used for the calculation on the previous page, go to cap.org, search for the CAP 15189 website, and look under Additional Resources. Or send a request marked MU Calculation Tool to cap15189@cap.org. Sign-off and Review Date entered by: Clinician name Date: Month, Day, Year Initials: Reviewed by: Date: Initials: © 2014 College of American Pathologists. All rights reserved. 24114.1015