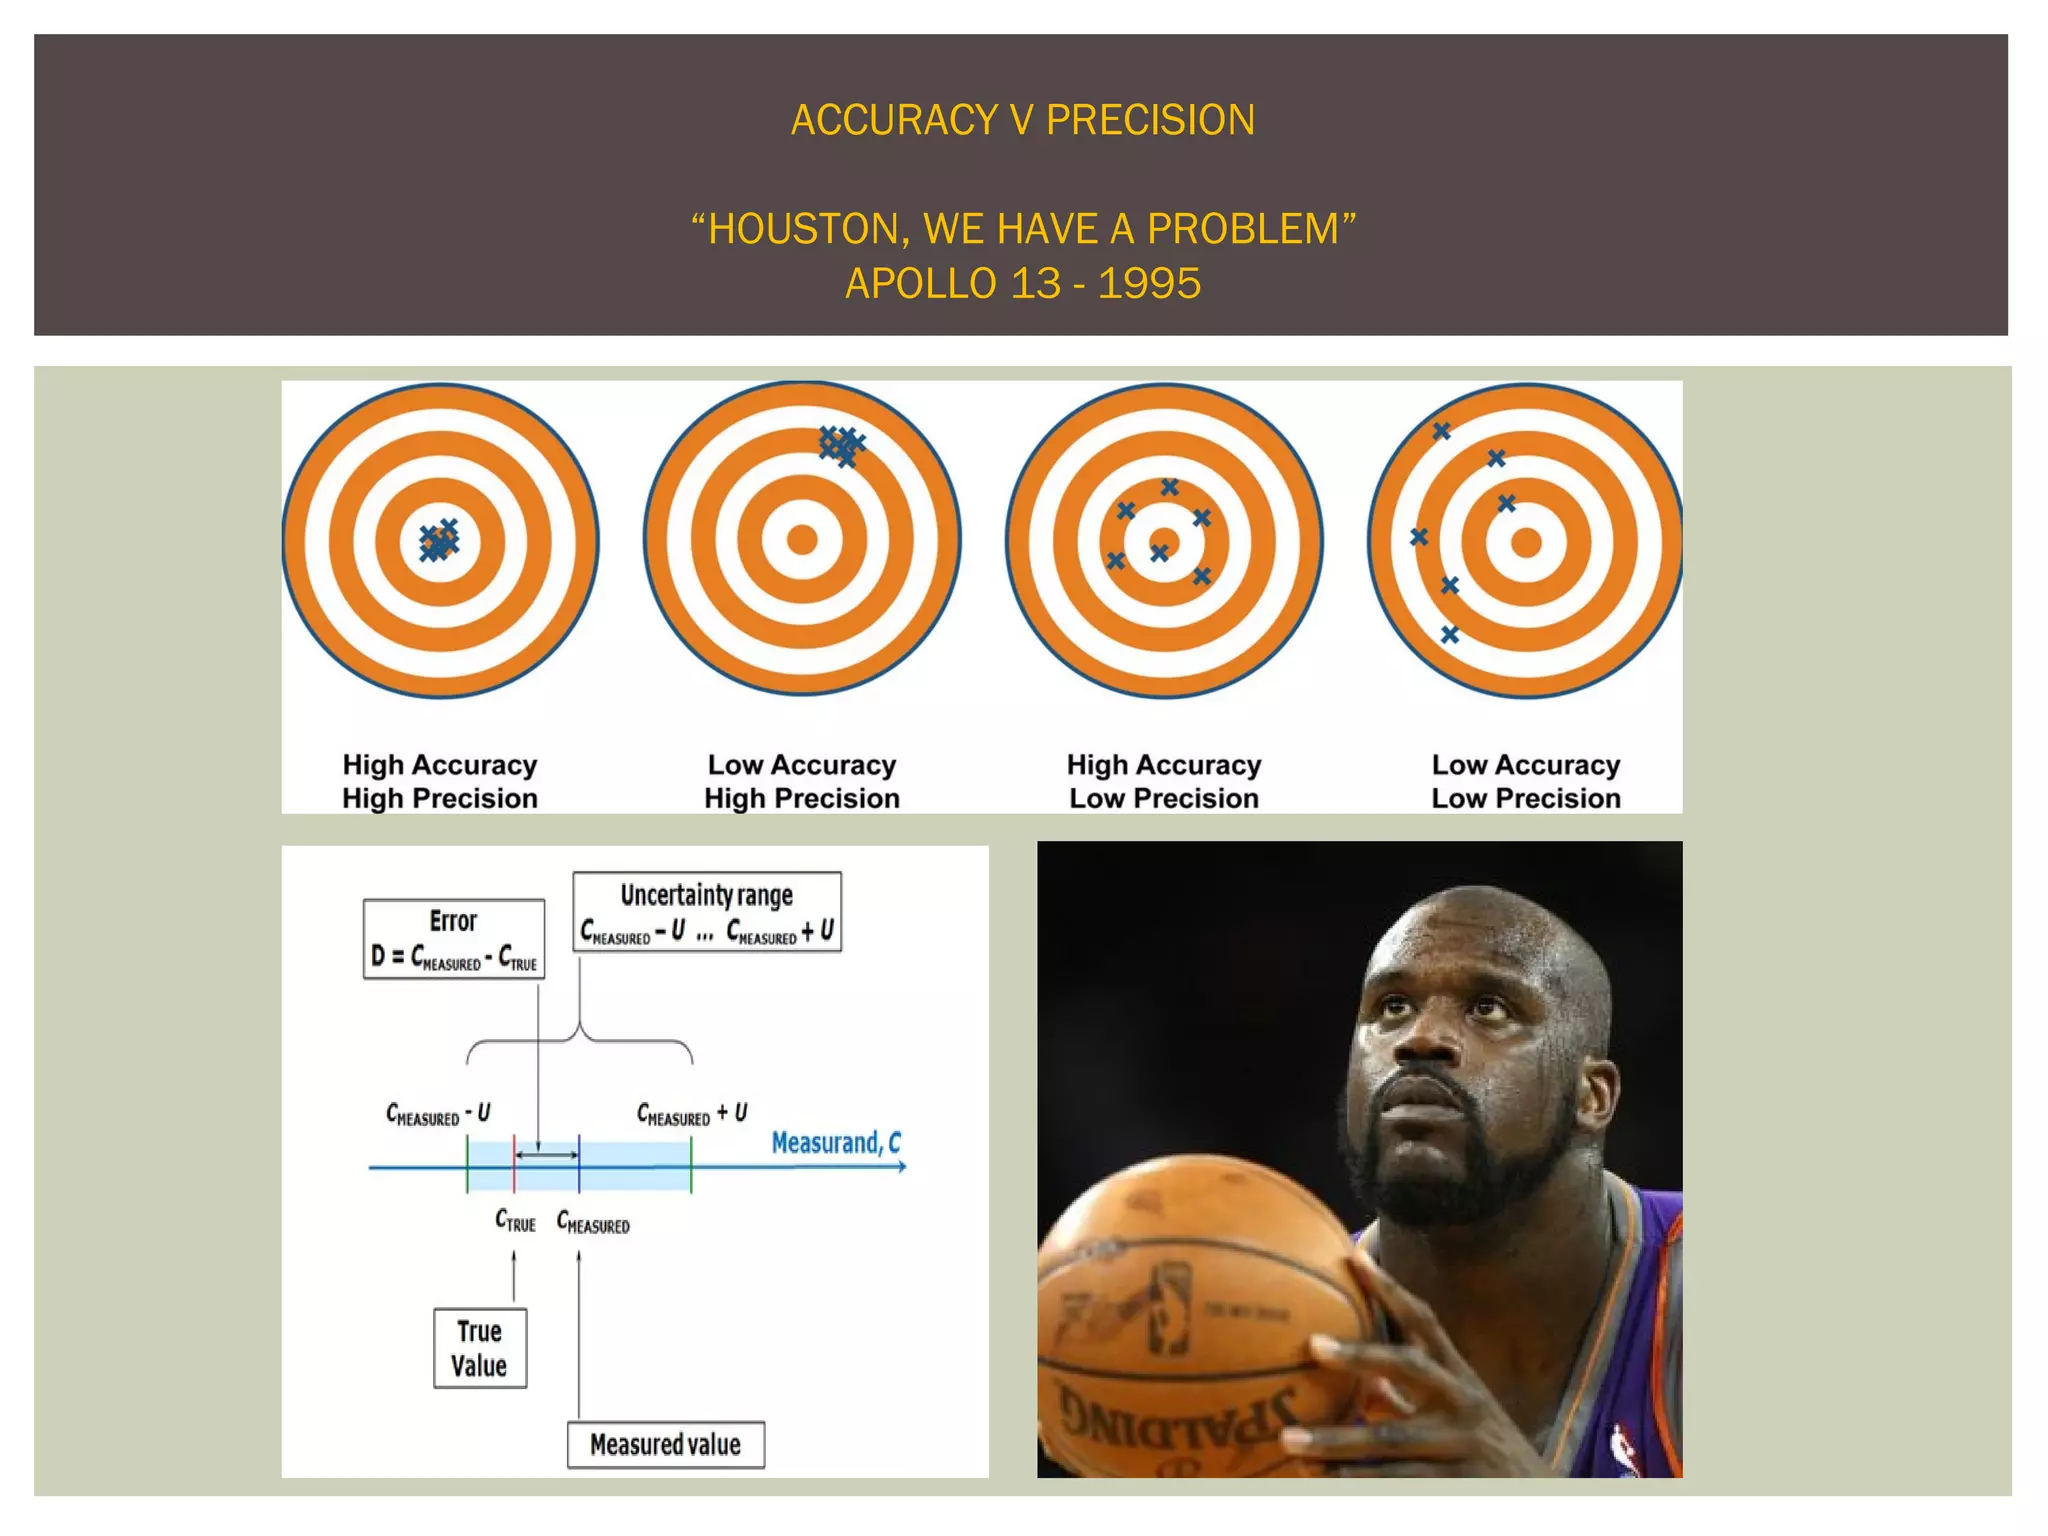
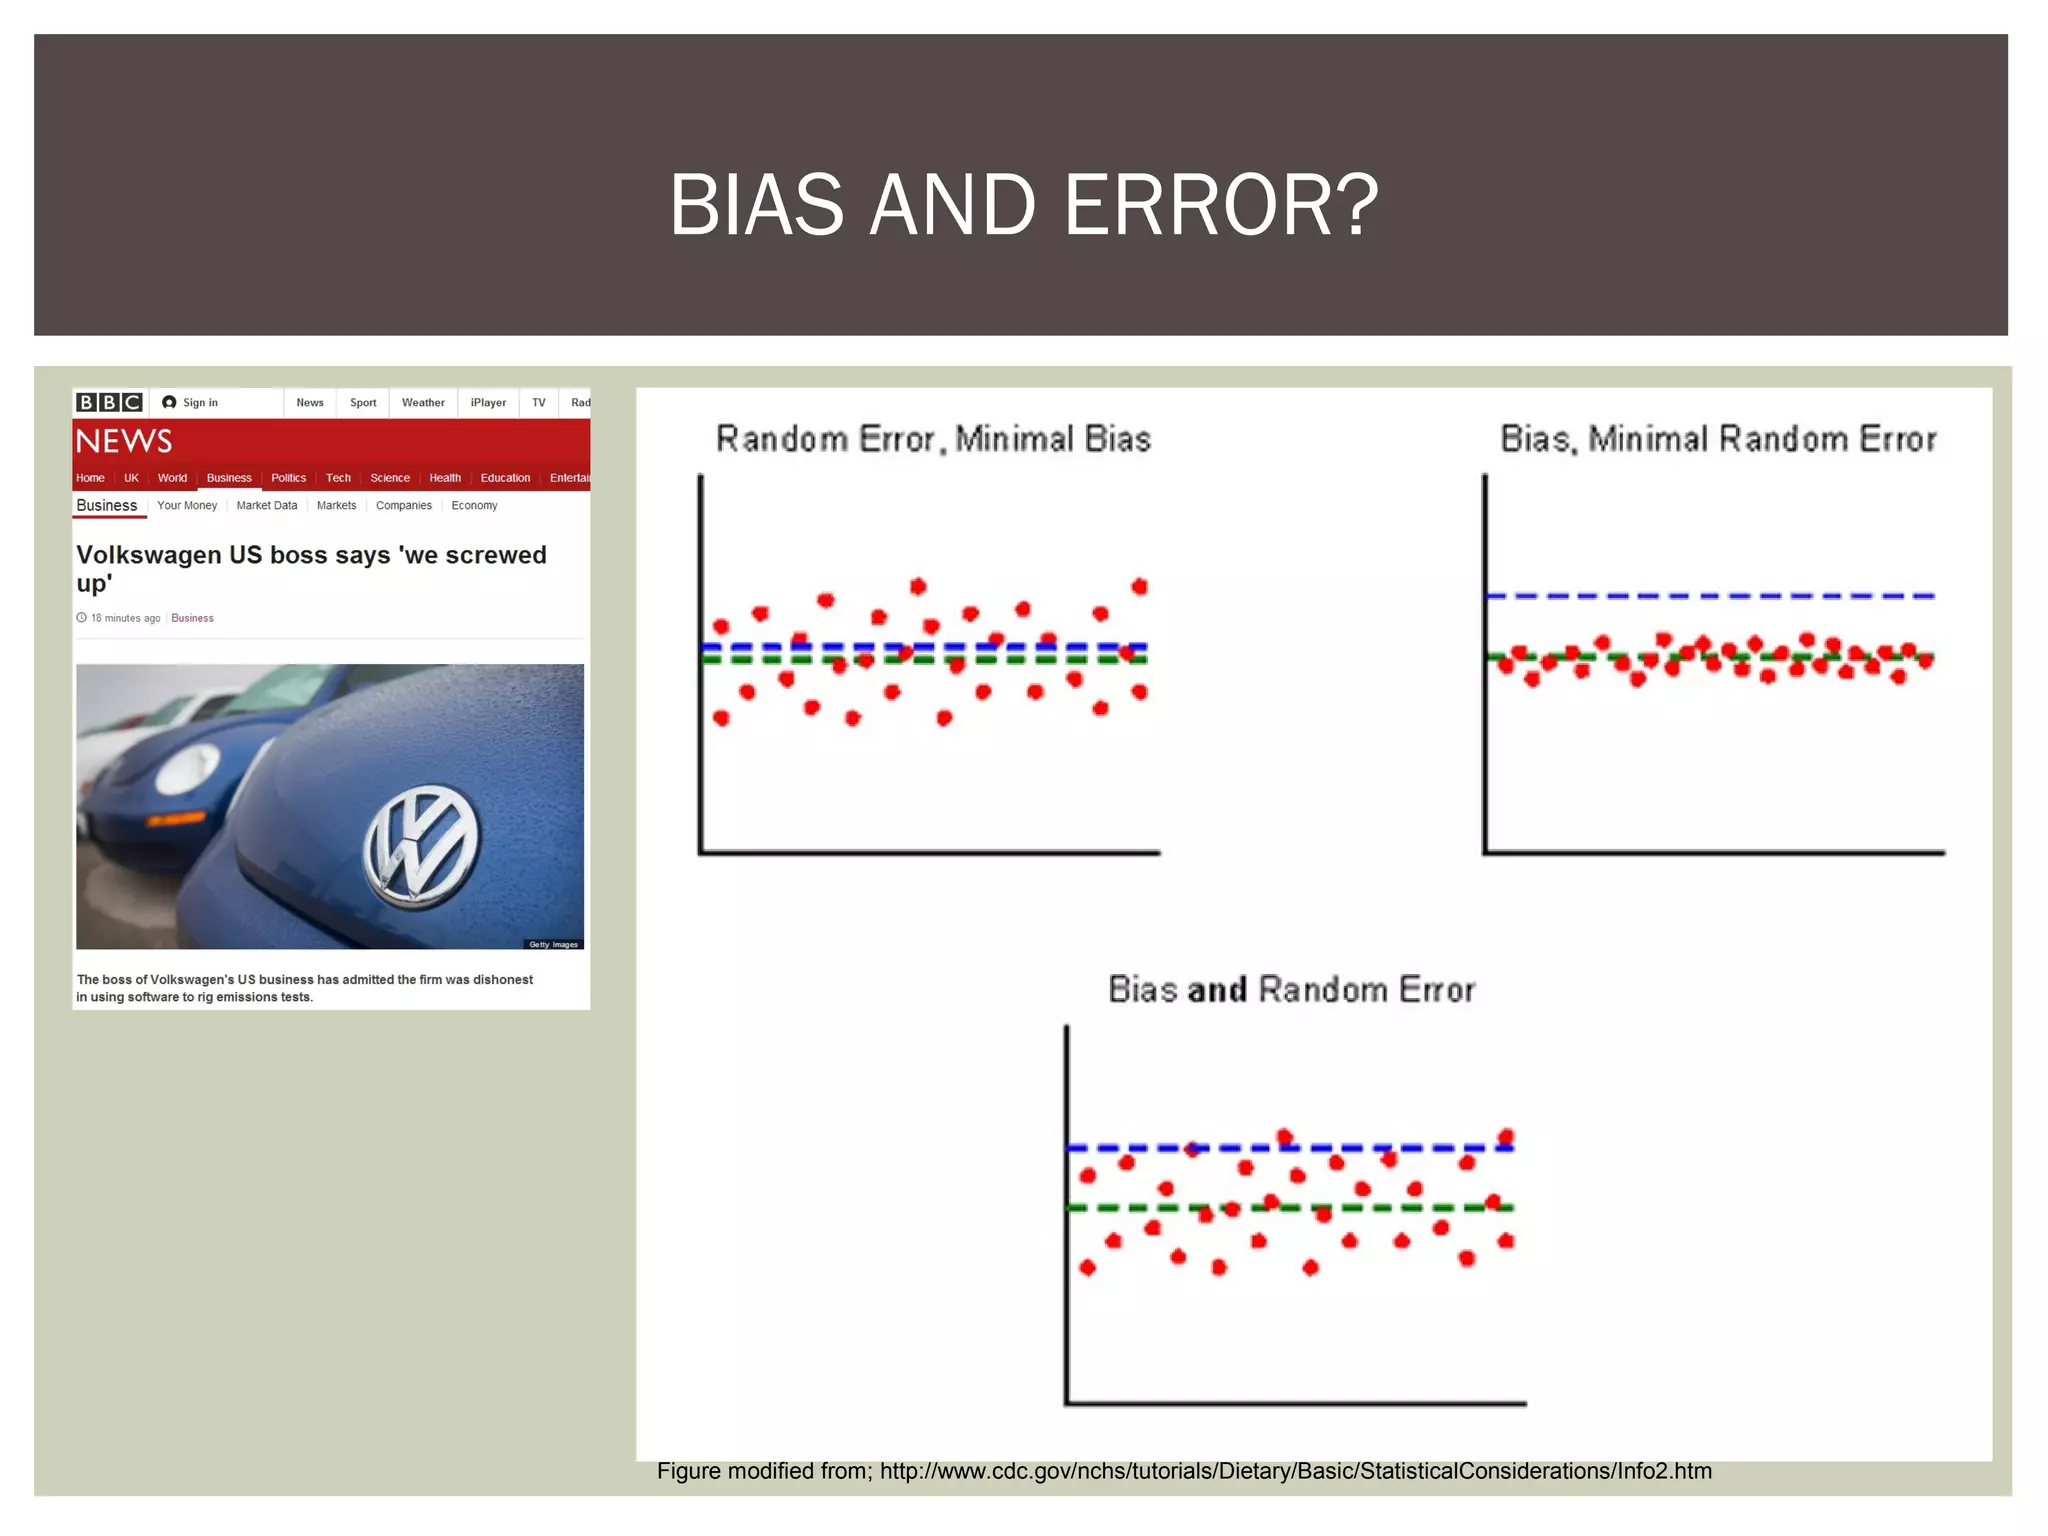
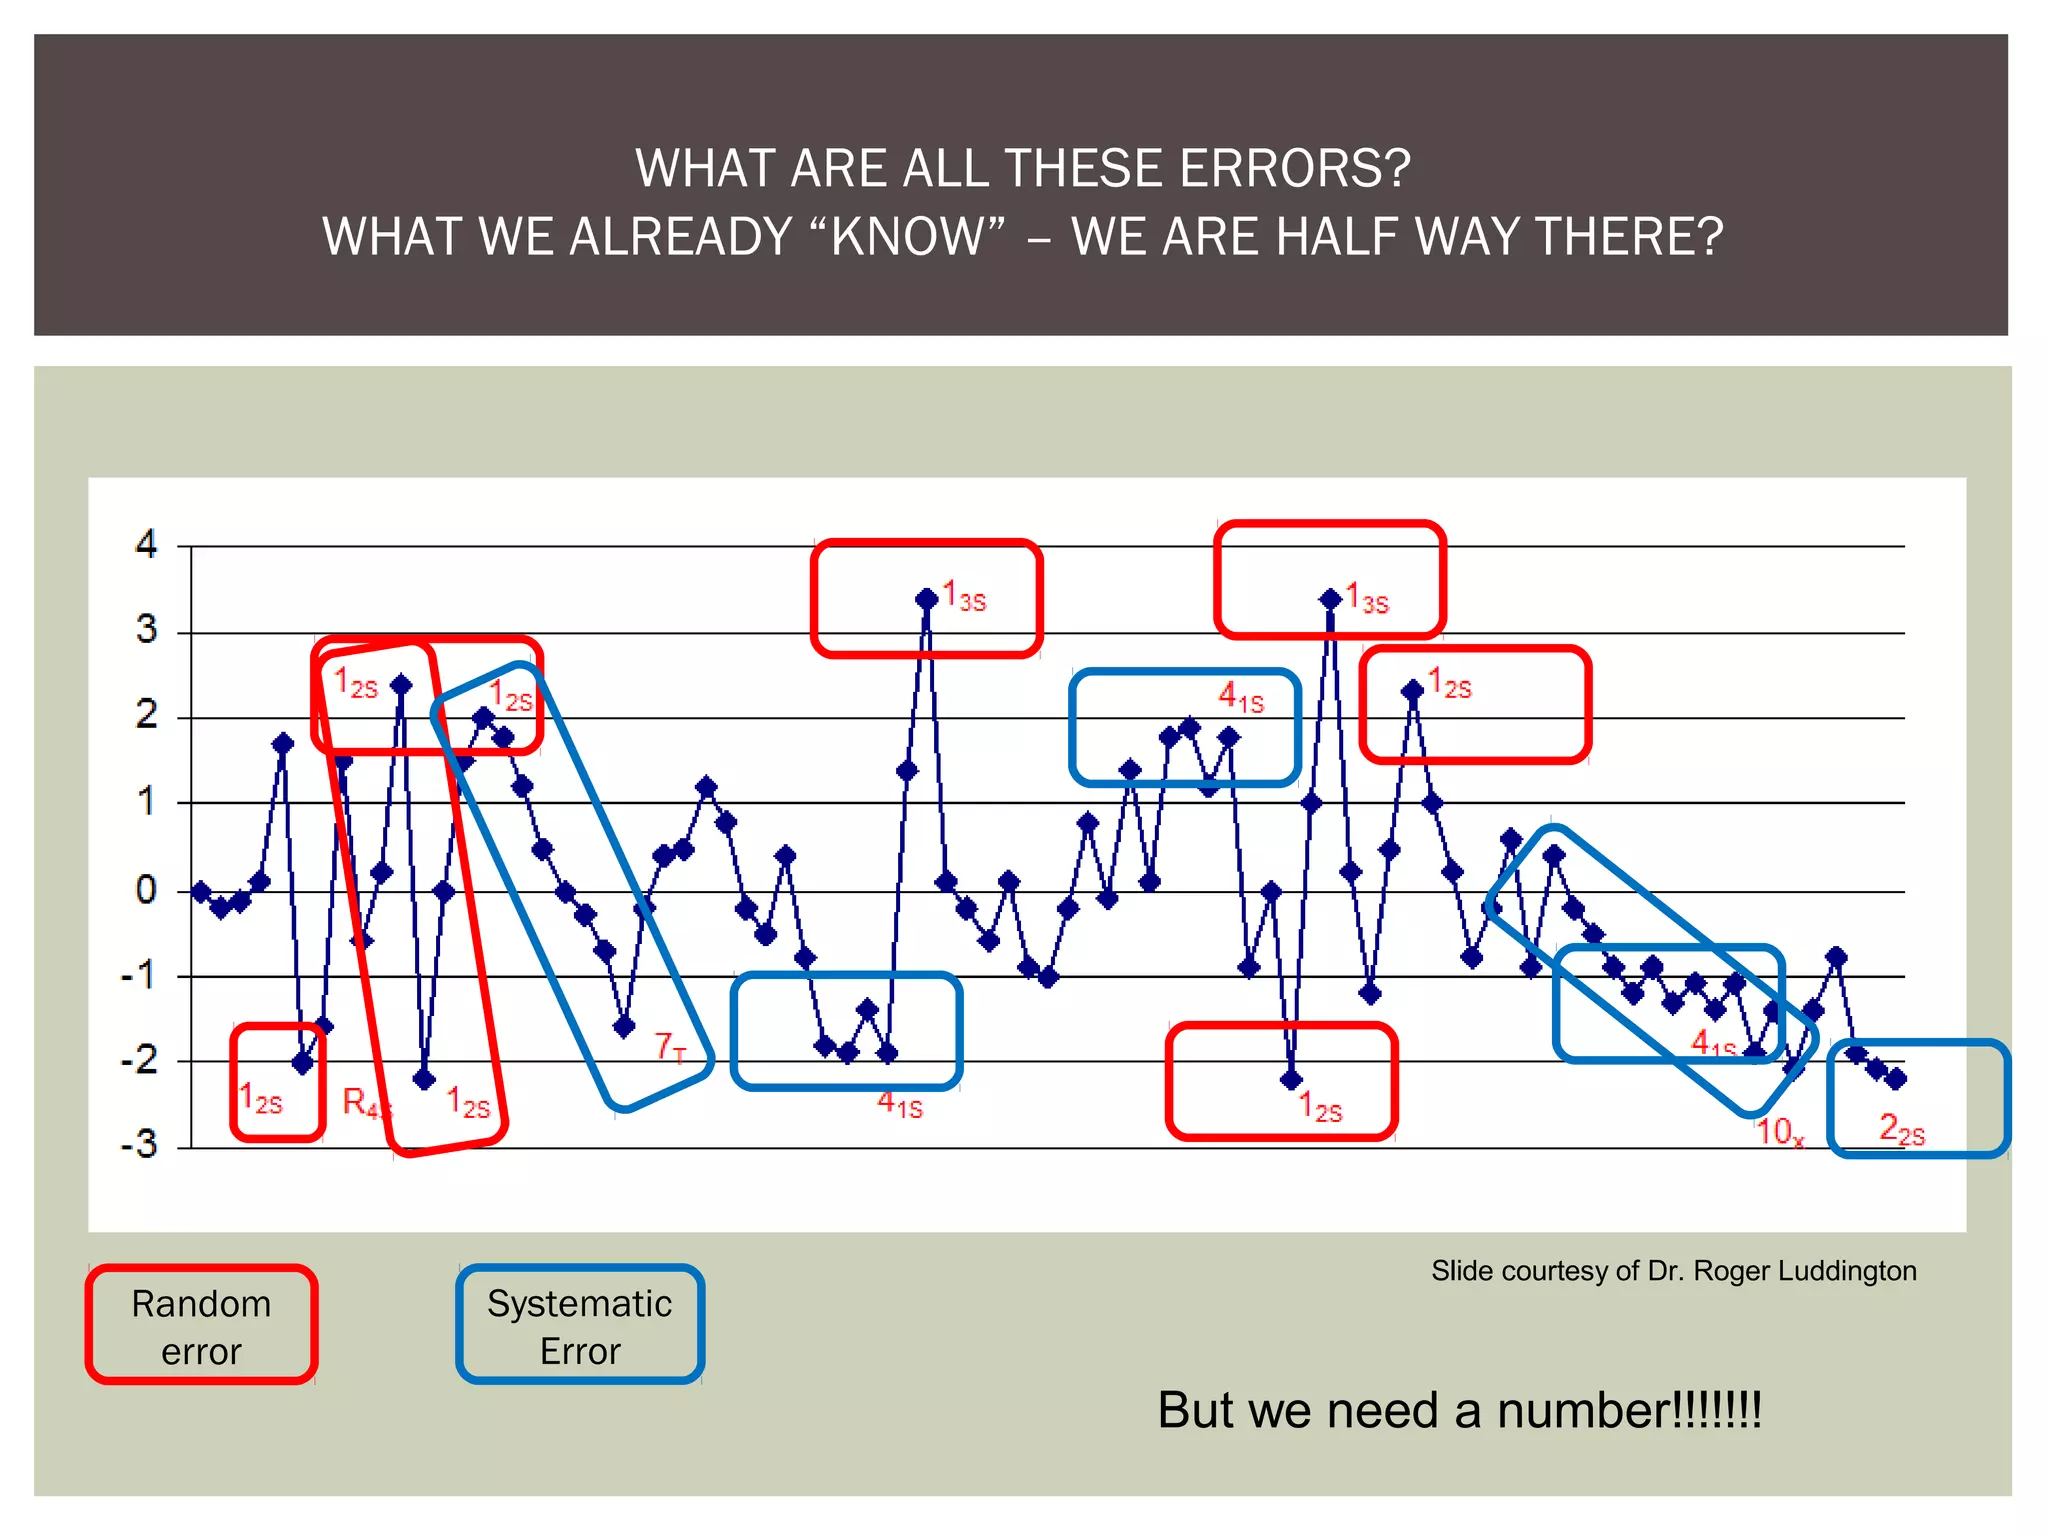
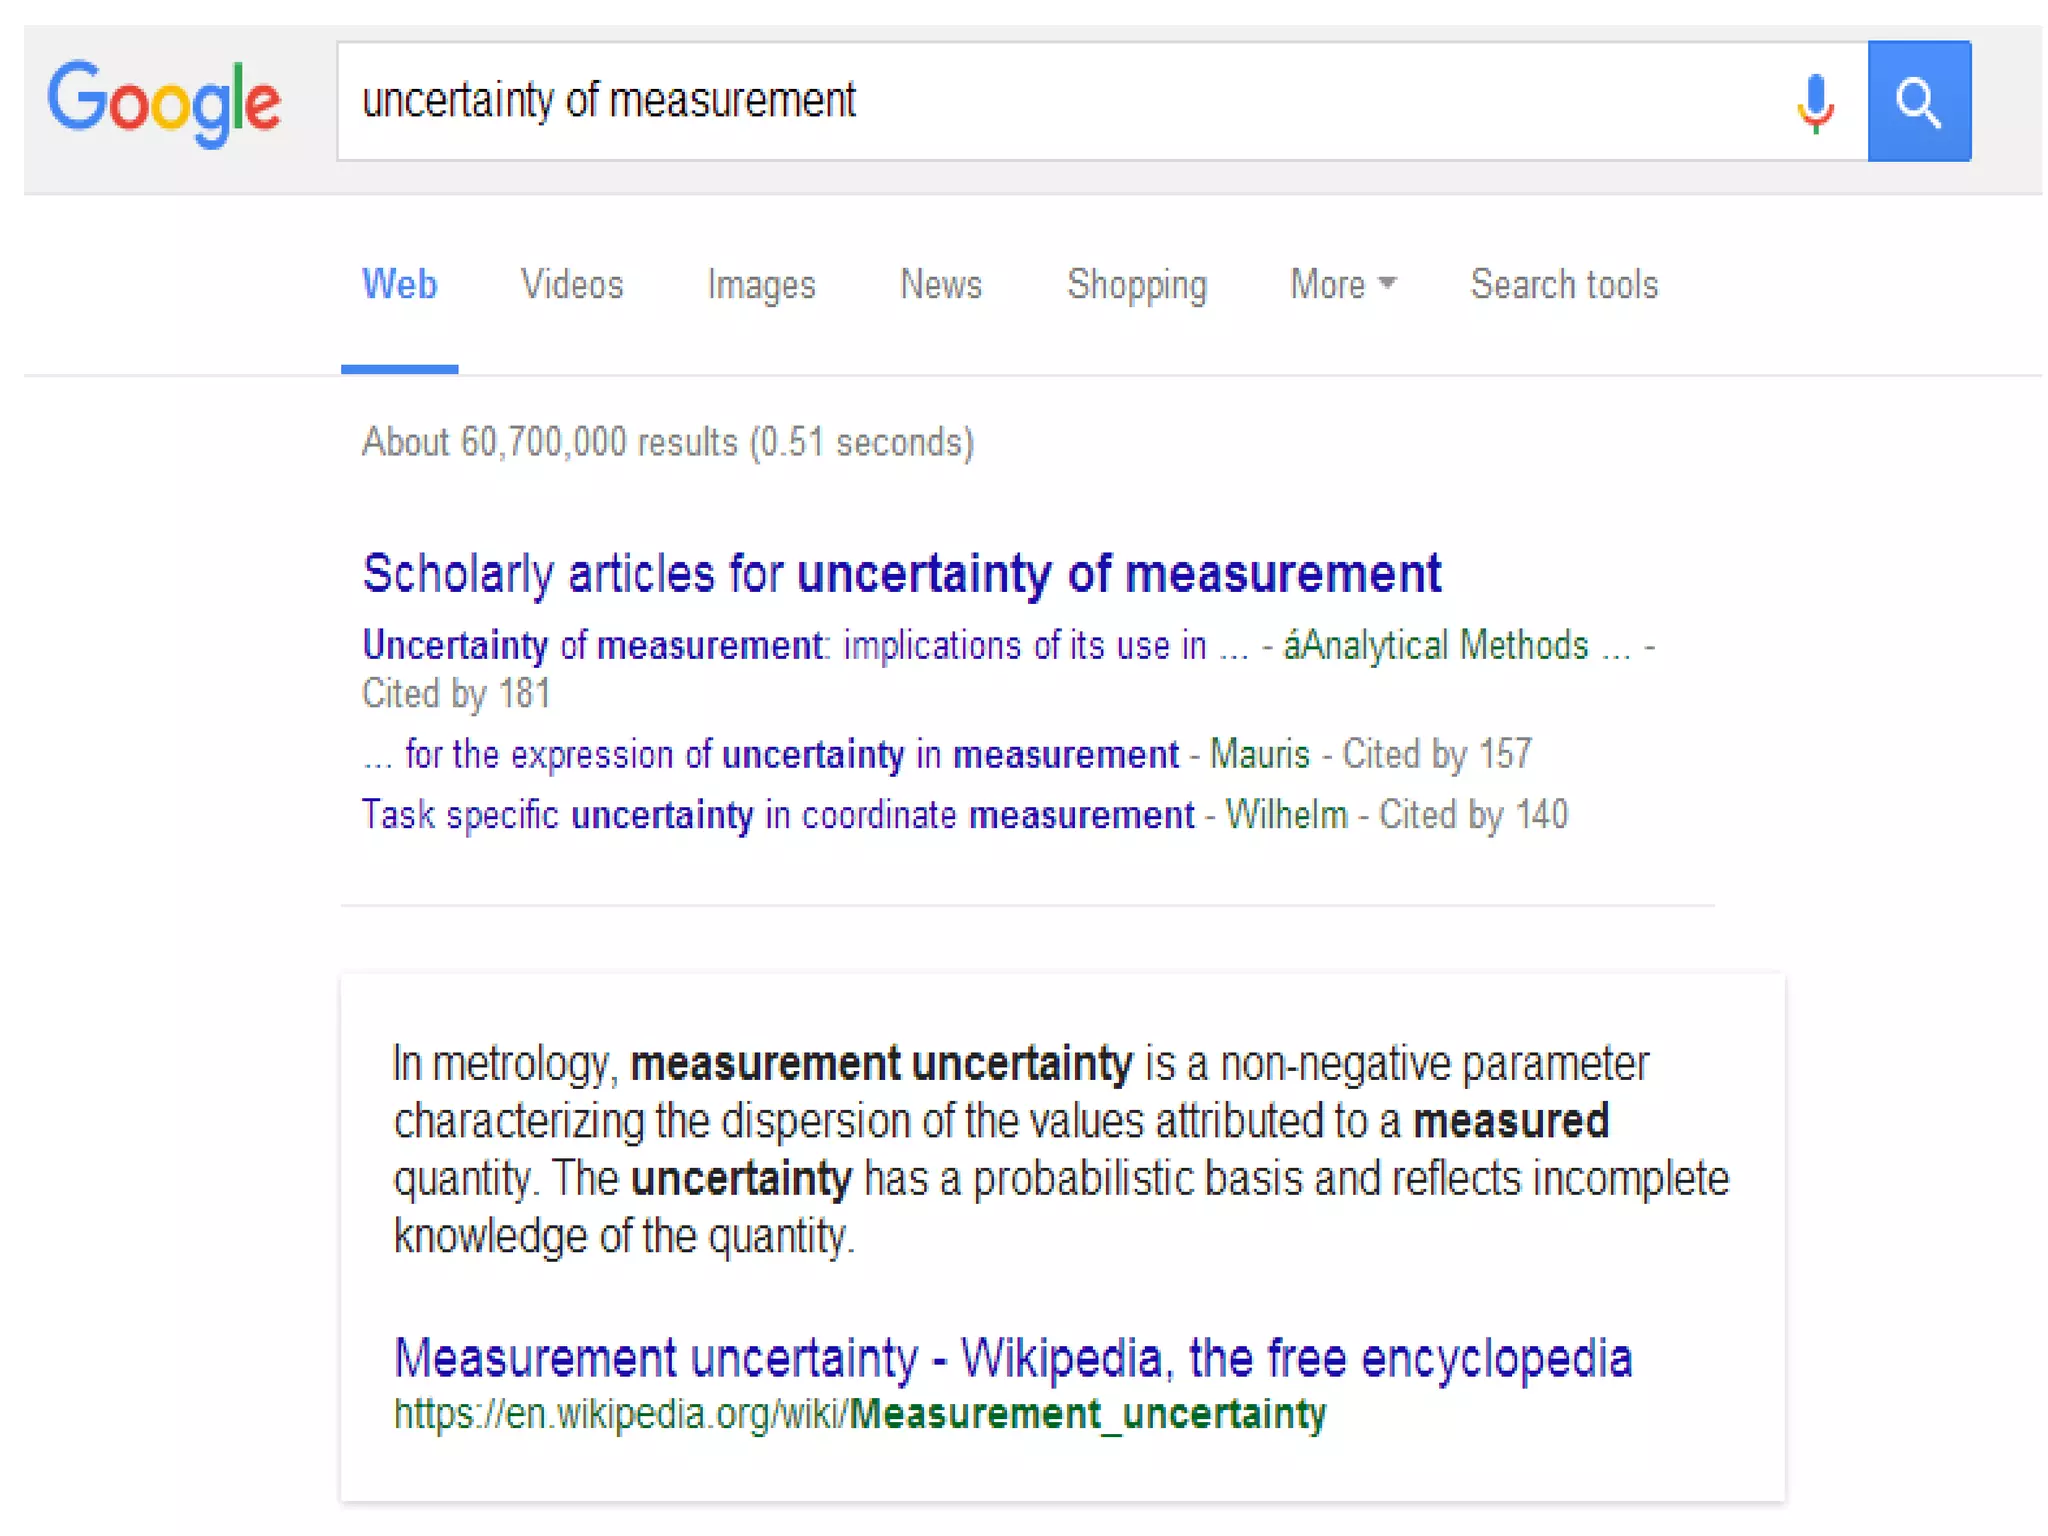
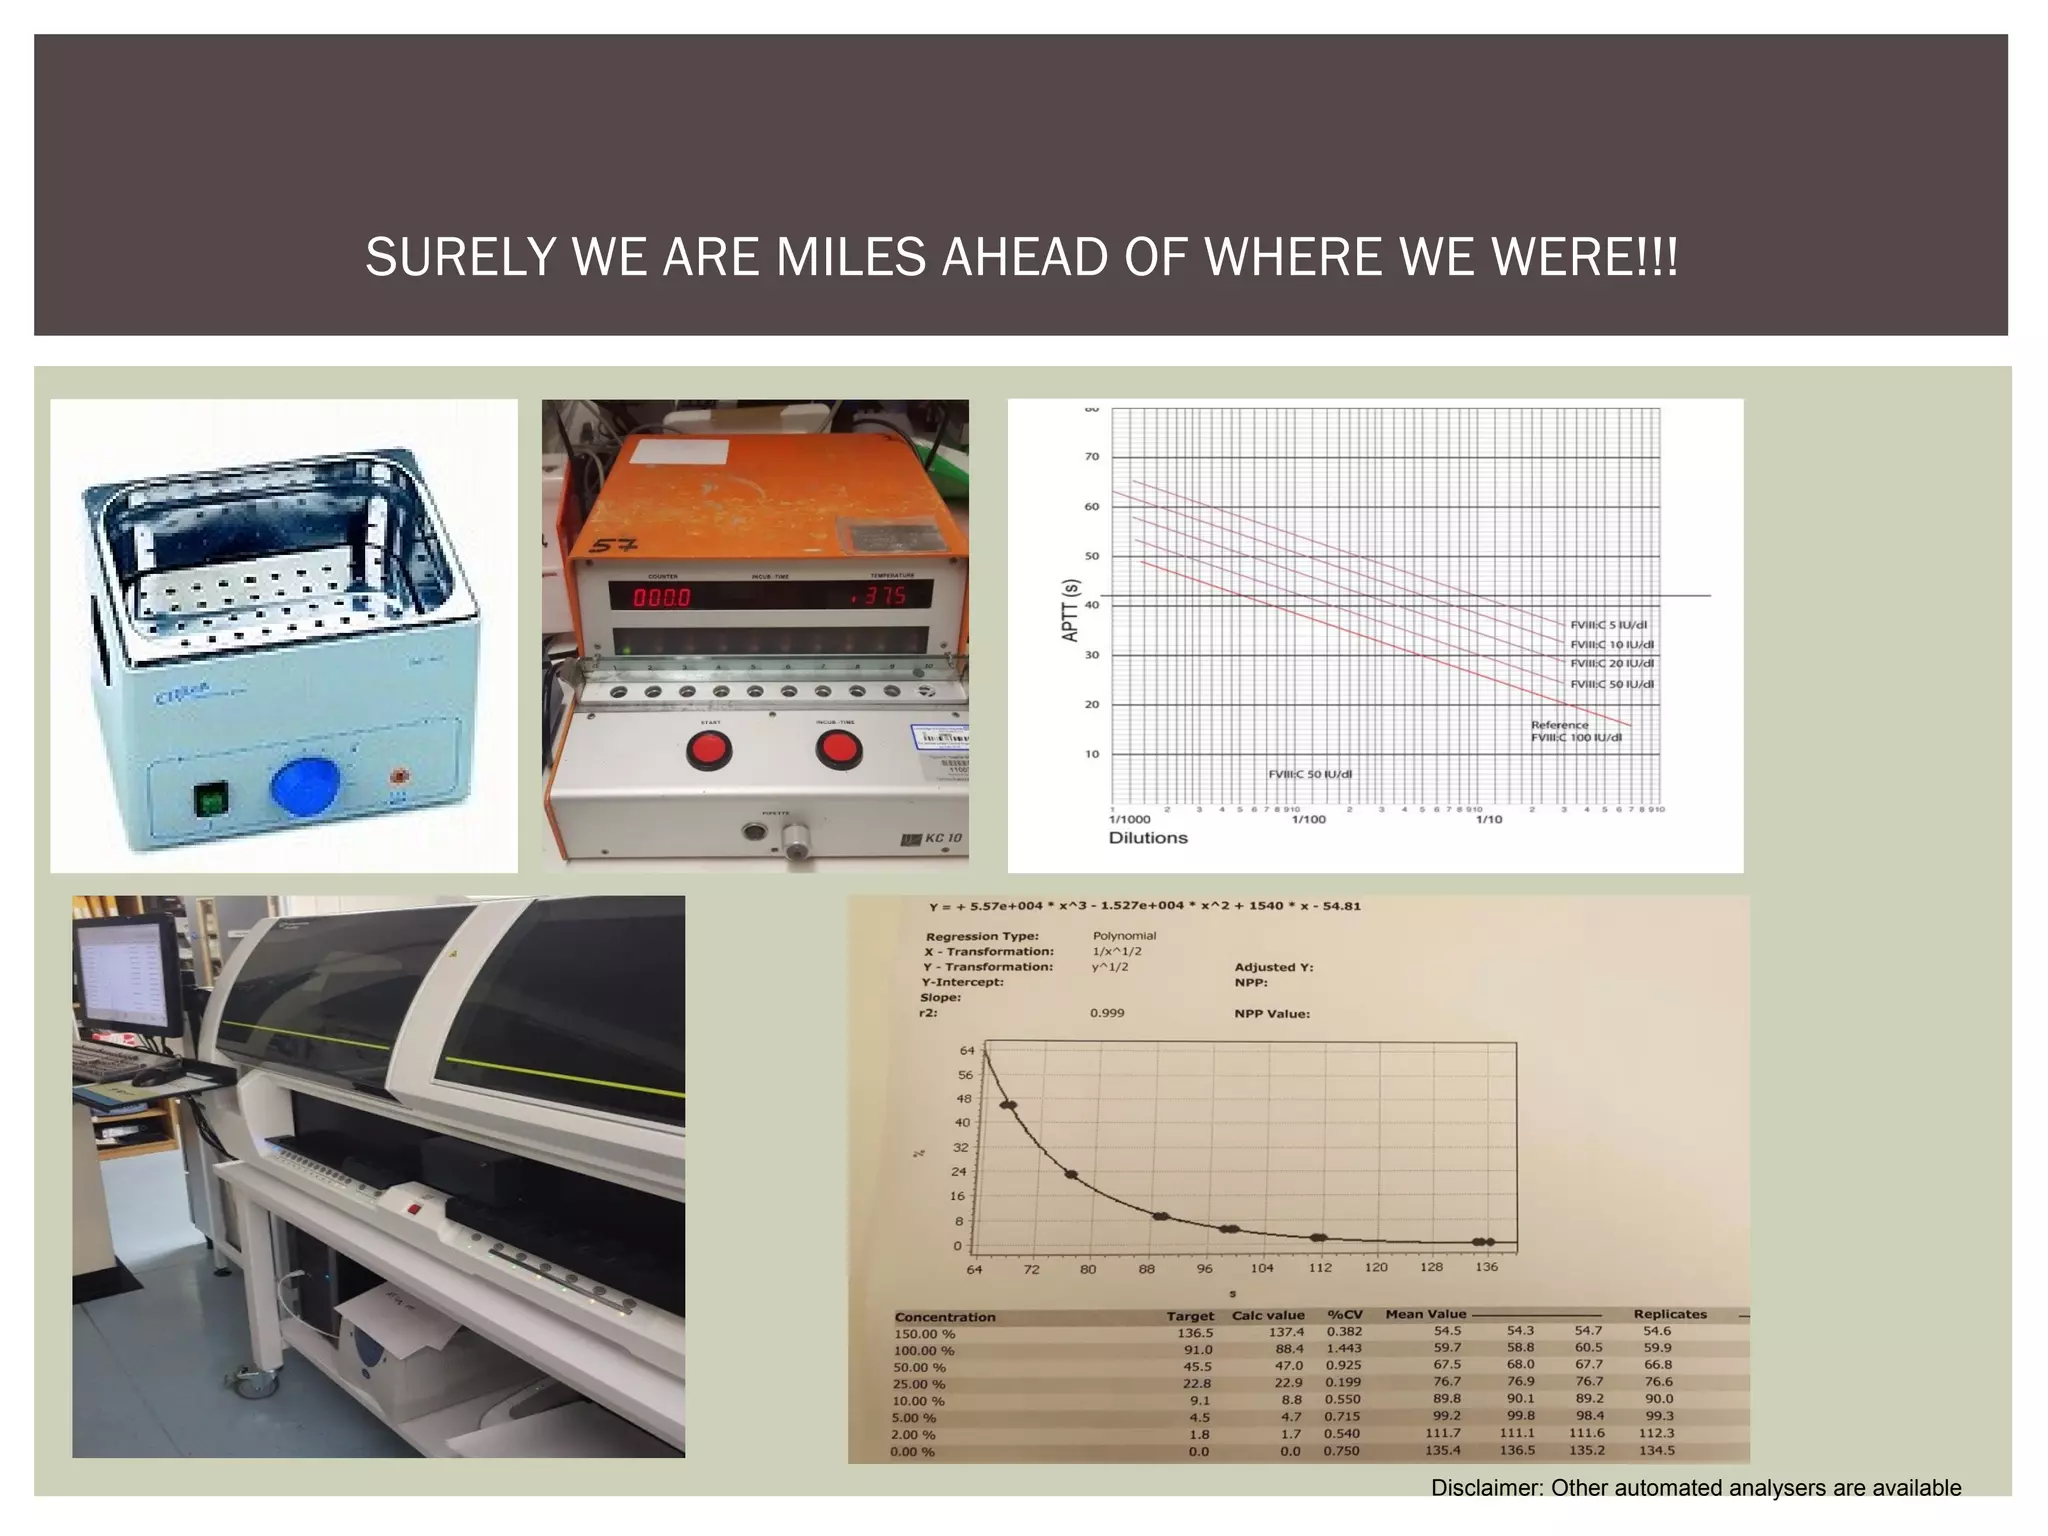
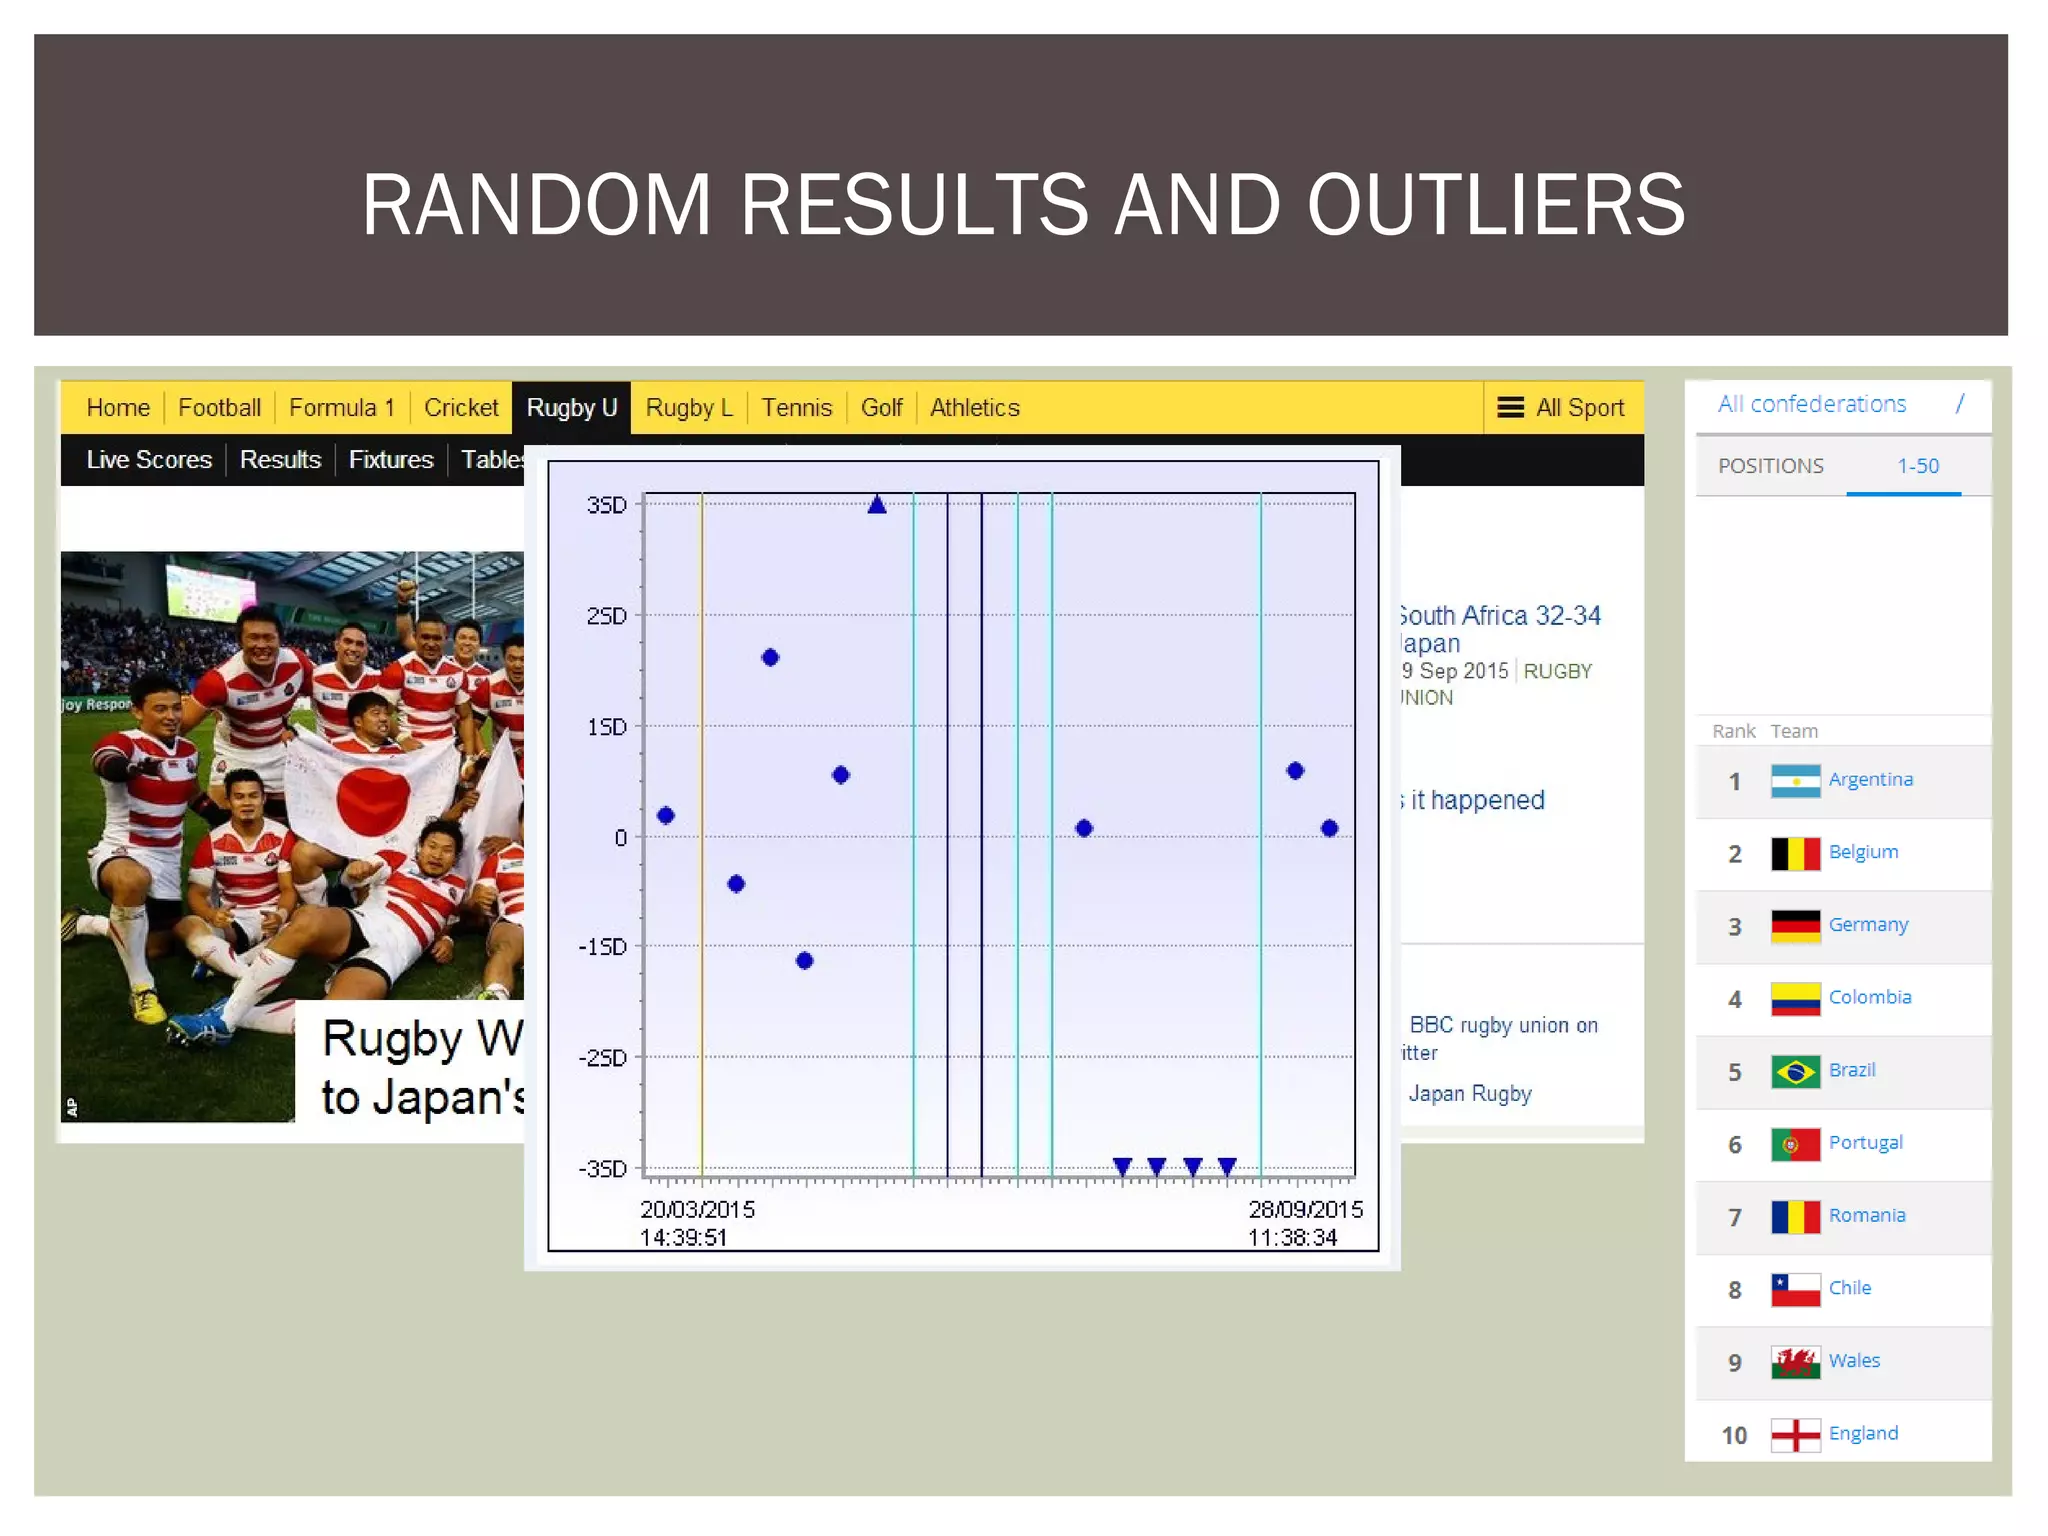
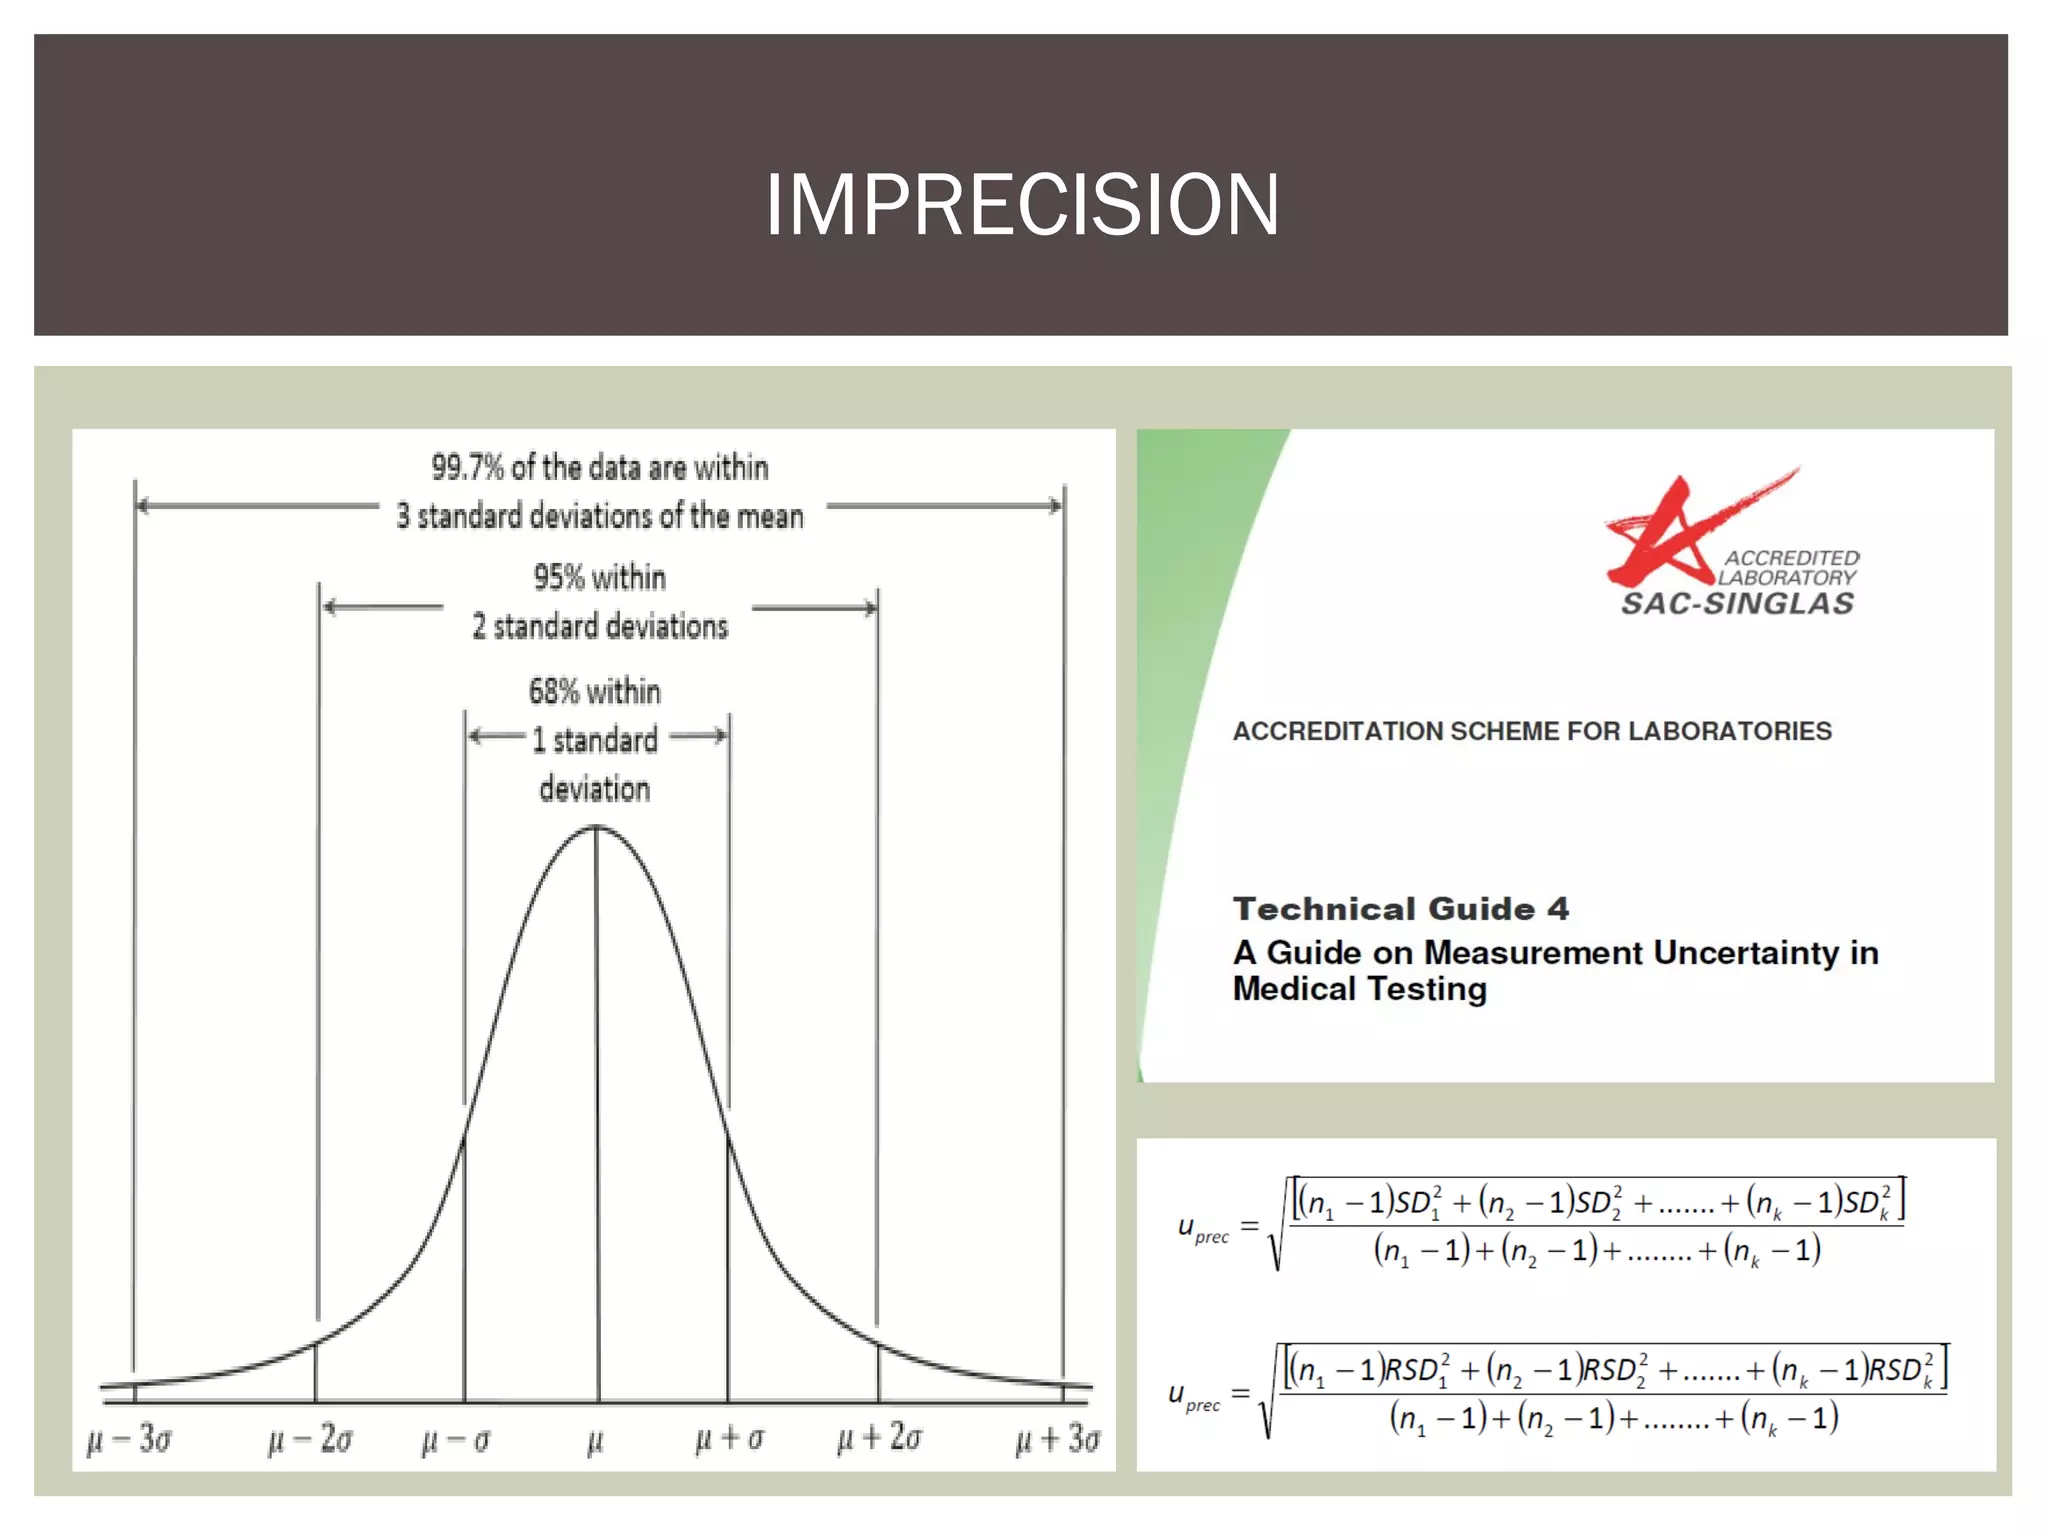
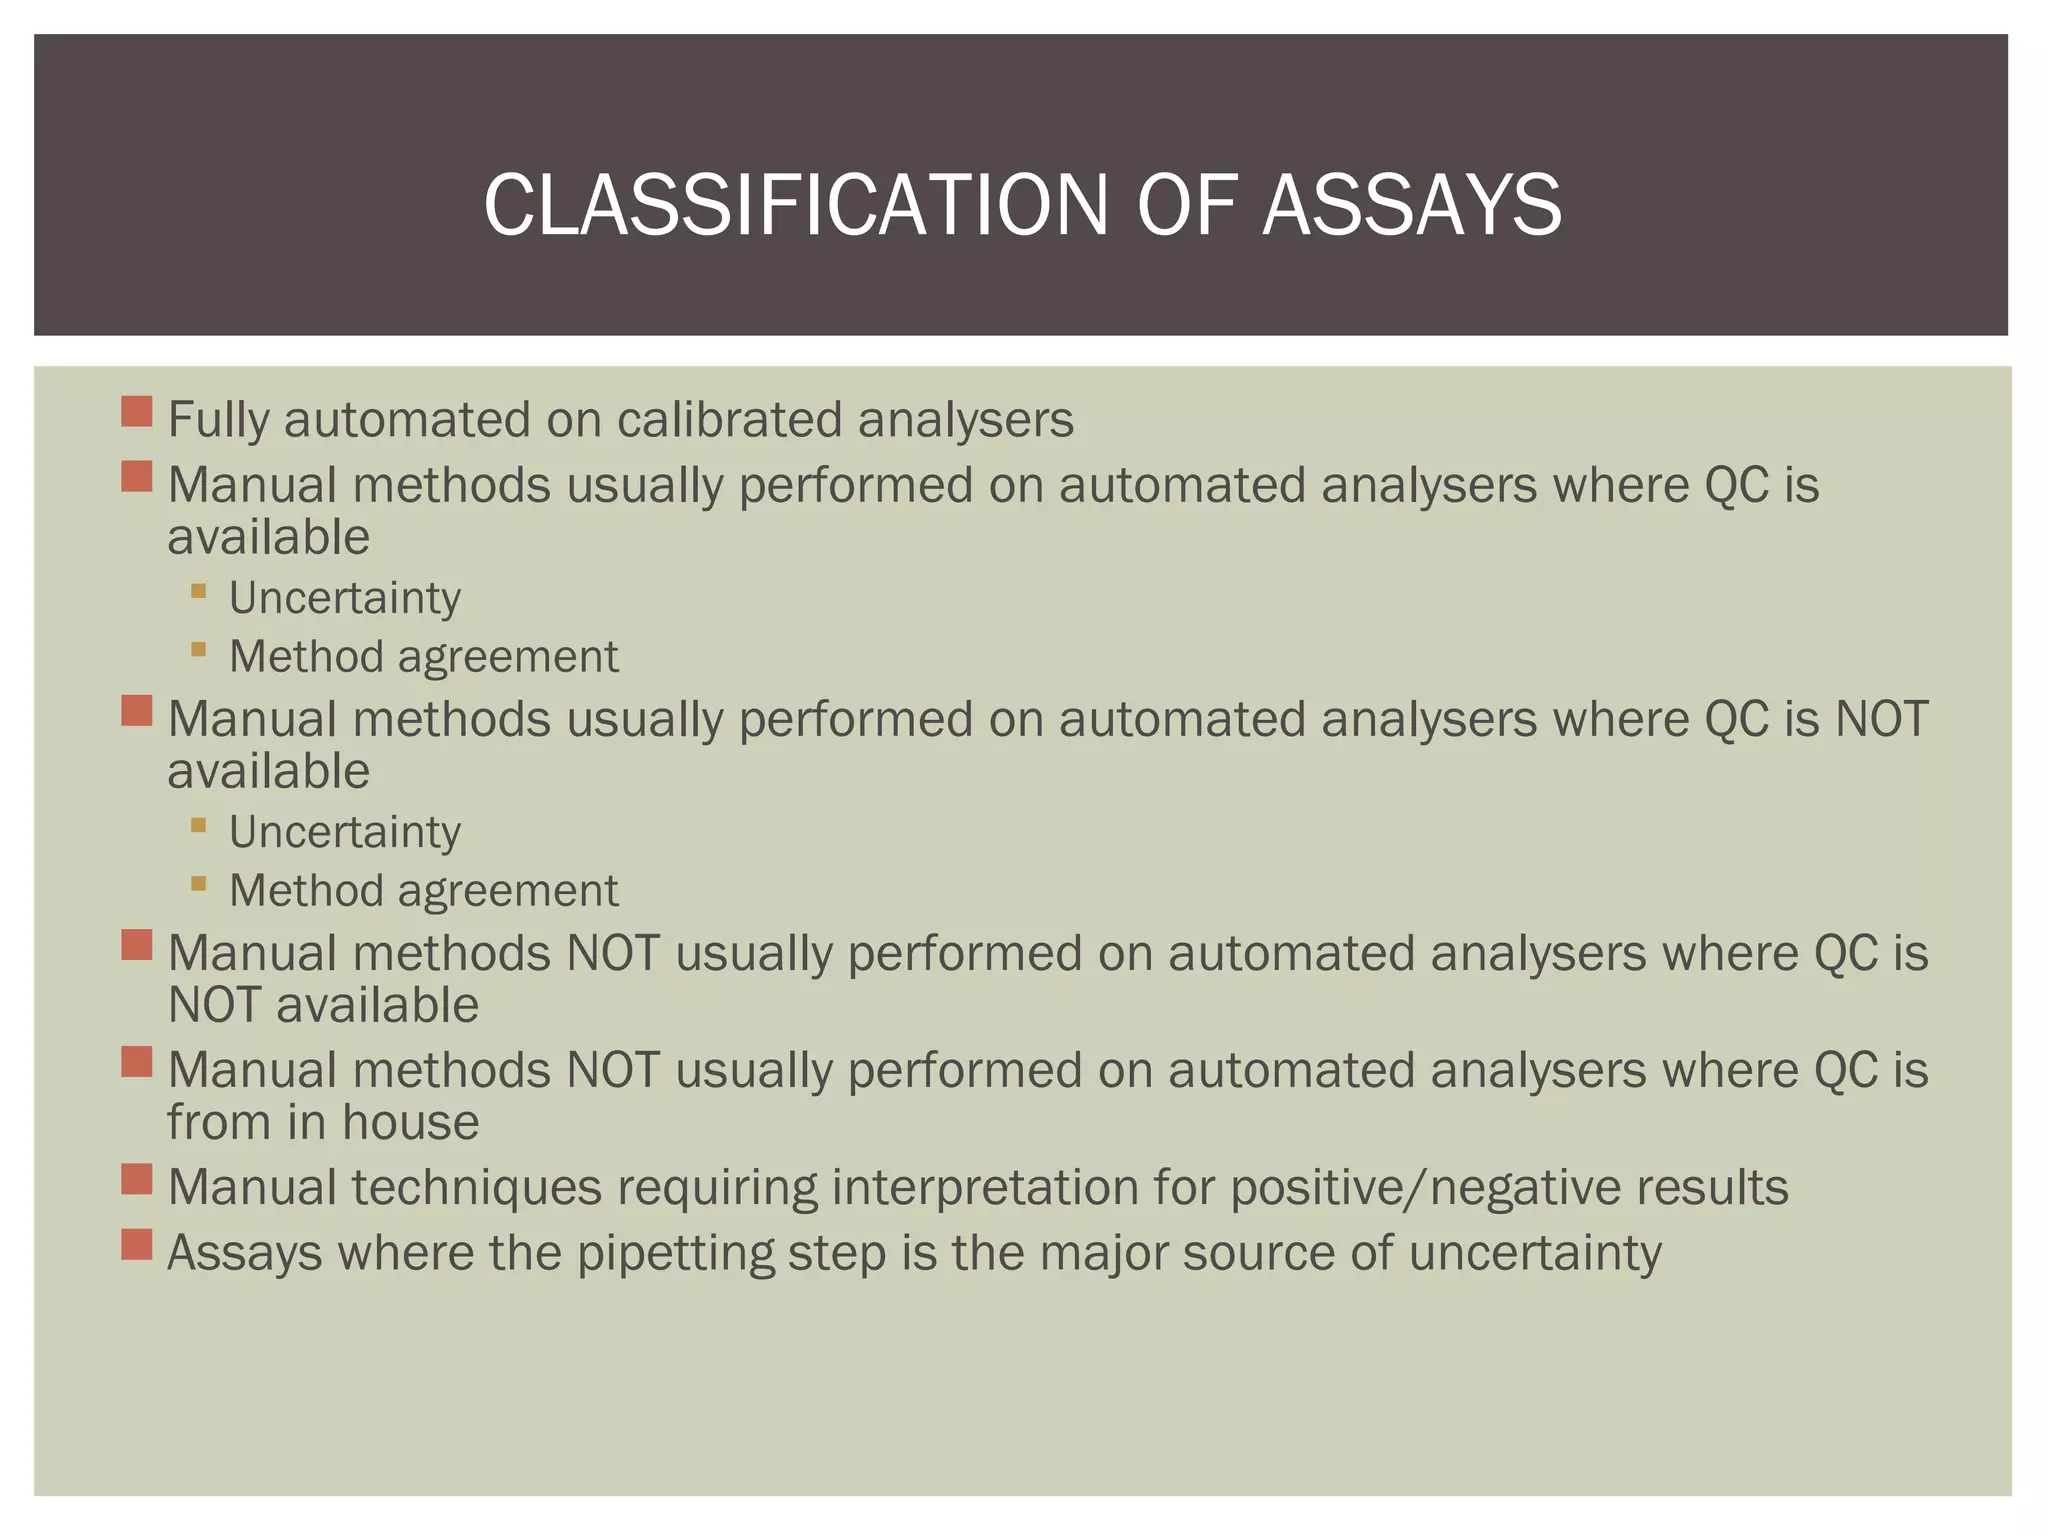
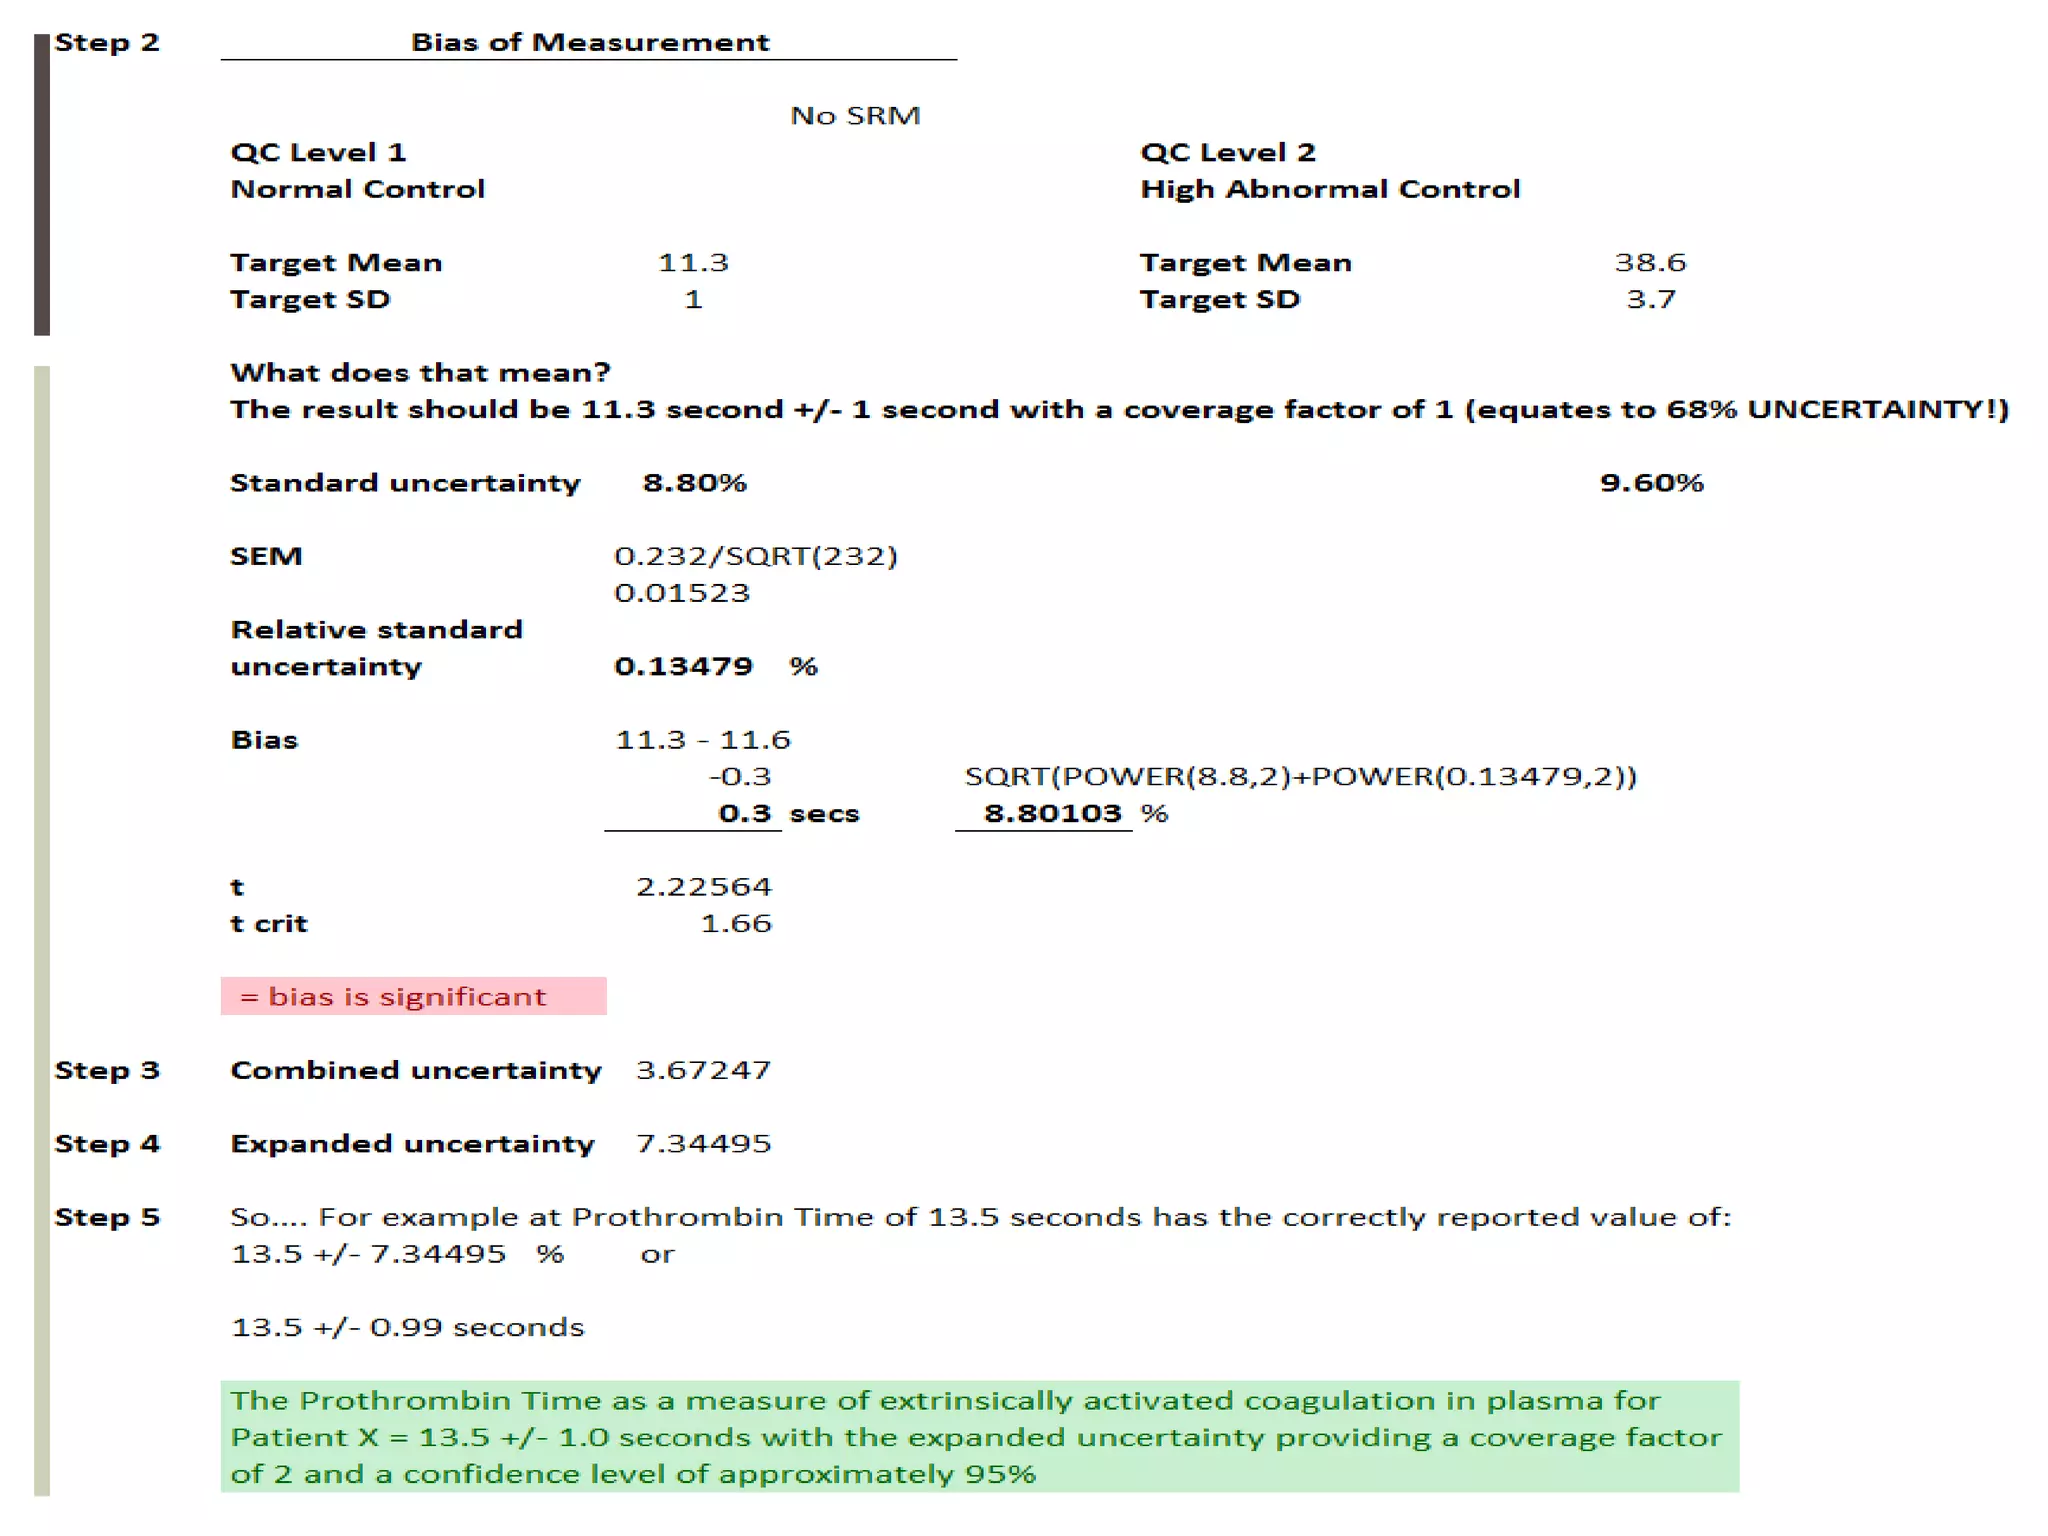
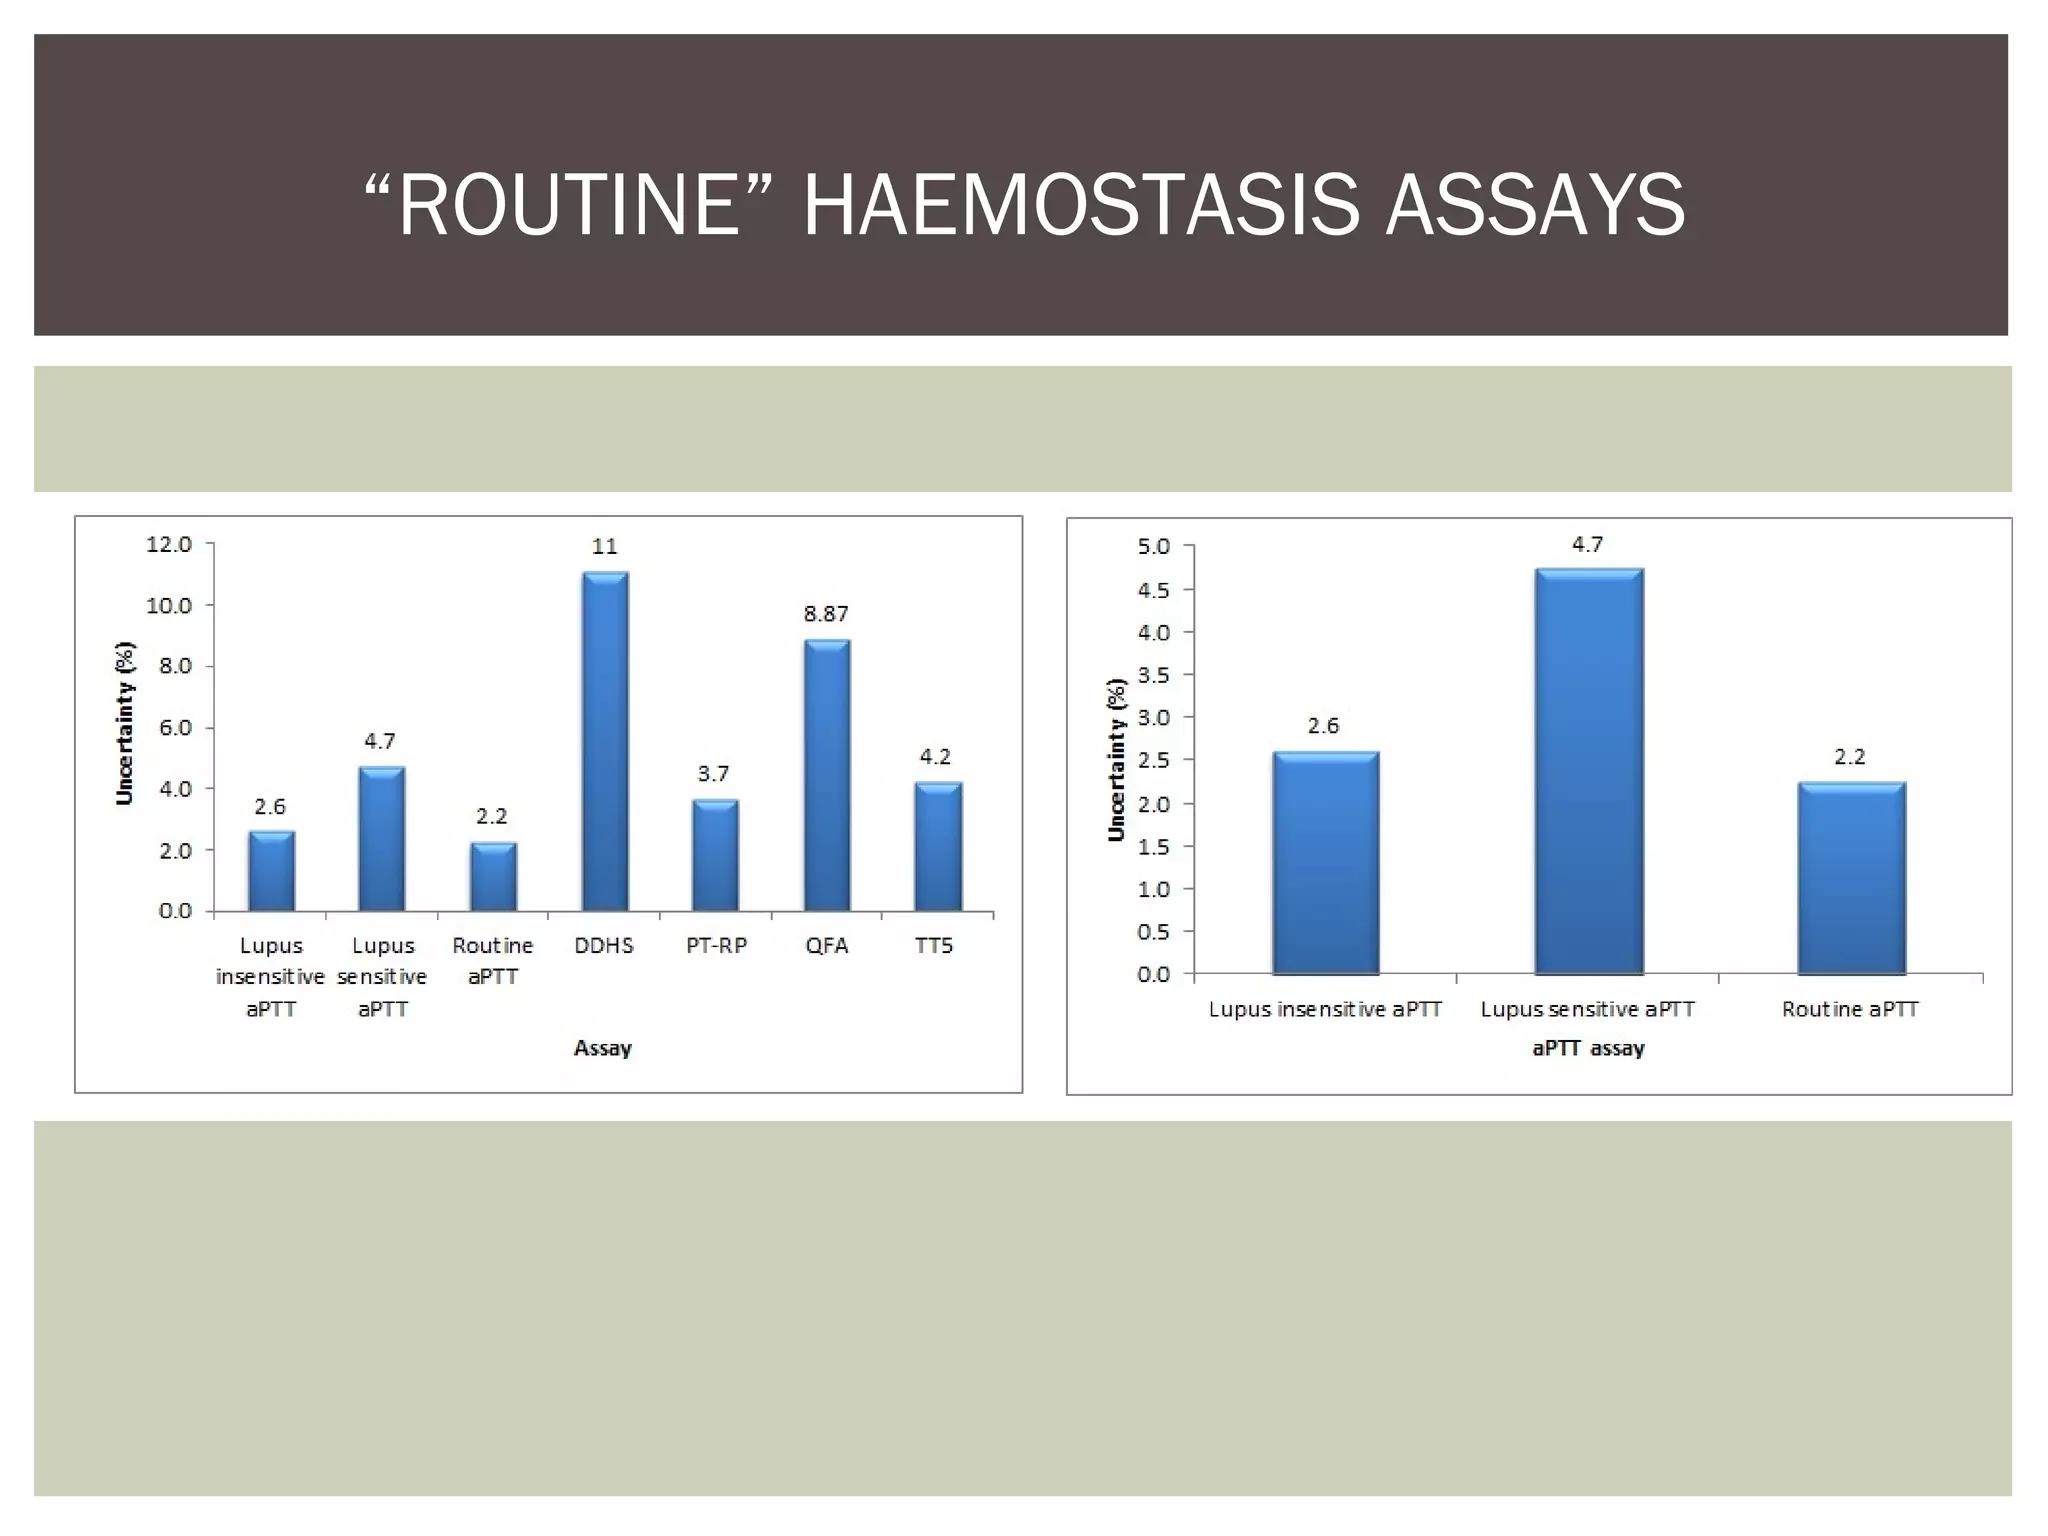
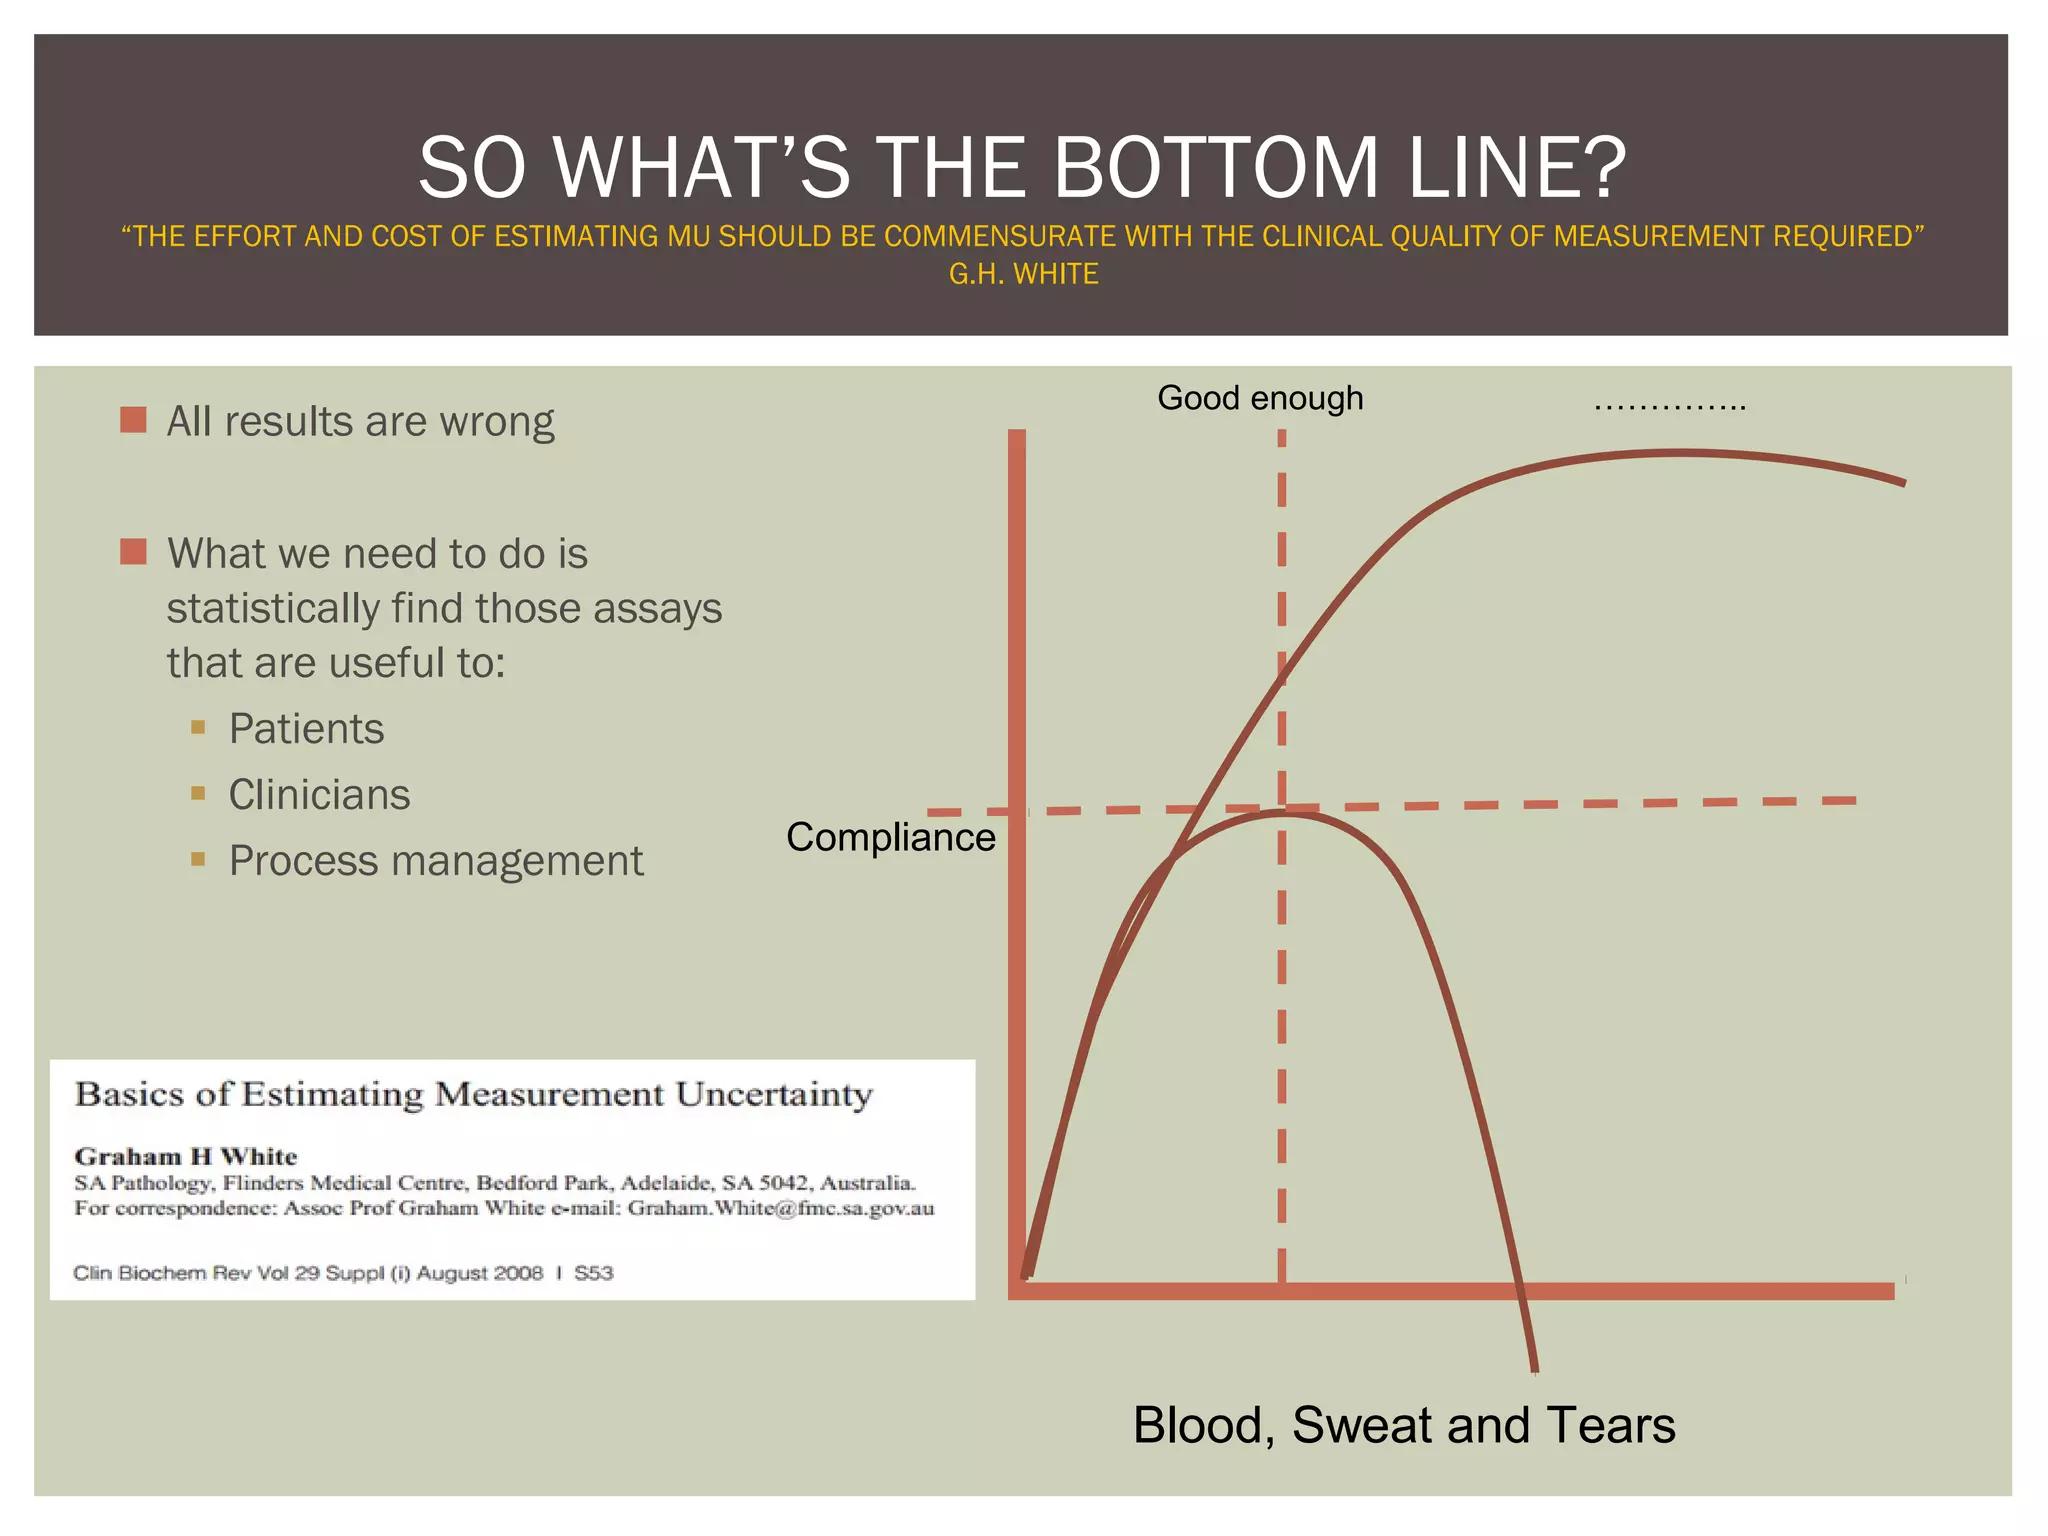
Stephen
MacDonald
Clinical Scientist
Cambridge
Wednesday 30th
September 2015
UNCERTAINTY OF
MEASUREMENT IN
HAEMOSTASIS
I have no conflicts of interest to declare
I have no affiliation whatsoever with UKAS
Any data presented is my own and is not specific to any individual vendor,
analyser or platform
I am not sure what any of this means!
I am not sure anybody really does!
This is entirely based on my interpretation and recent experience of a
UKAS inspection
DISCLOSURES
“I DON’T PRETEND WE HAVE ALL THE ANSWERS, BUT THE QUESTIONS ARE CERTAINLY WORTH THINKING ABOUT”
ARTHUR C. CLARKE
ACCURACY V PRECISION
“HOUSTON, WE HAVE A PROBLEM”
APOLLO 13 - 1995
BIAS AND ERROR?
Figure modified from; http://www.cdc.gov/nchs/tutorials/Dietary/Basic/StatisticalConsiderations/Info2.htm
WHAT ARE ALL THESE ERRORS?
WHAT WE ALREADY “KNOW” – WE ARE HALF WAY THERE?
Random
error
Systematic
Error
Slide courtesy of Dr. Roger Luddington
But we need a number!!!!!!!
ISO15189:2012 5.5.1.4
Measurement uncertainty of measured quantity values
The laboratory shall determine measurement uncertainty for each
measurement procedure in the examination phase used to report
measured quantity values on patients’ samples. The laboratory shall
define the performance requirements for the measurement
uncertainty of each measurement procedure and regularly review
estimates of measurement uncertainty.
NOTE 1 The relevant uncertainty components are those associated
with the actual measurement process, commencing with the
presentation of the sample to the measurement procedure and ending
with the output of the measured value.
NOTE 2 Measurement uncertainties may be calculated using quantity
values obtained by the measurement of quality control materials
under intermediate precision conditions that include as many routine
changes as reasonably possible in the standard operation of a
measurement procedure, e.g. changes of reagent and calibrator
batches, different operators, scheduled instrument maintenance.
NOTE 3 Examples of the practical utility of measurement uncertainty
estimates might include confirmation that patients’ values meet quality
goals set by the laboratory and meaningful comparison of a patient
value with a previous value of the same type or with a clinical decision
value.
The laboratory shall consider measurement uncertainty when
interpreting measured quantity values. Upon request, the laboratory
shall make its estimates of measurement uncertainty available to
laboratory users.
Where examinations include a measurement step but do not report a
measured quantity value, the laboratory should calculate the
uncertainty of the measurement step where it has utility in assessing
the reliability of the examination procedure or has influence on the
reported result.
SURELY WE ARE MILES AHEAD OF WHERE WE WERE!!!
Disclaimer: Other automated analysers are available
STEP ONE – COLLECT
YOUR DATA
“It is a capital
mistake to
theorize before
one has data.”
Sir Arthur Conan
Doyle
 The amount of data
 The sources (analysers, manual)
 The amount of data
 Format – excel, csv, handwritten……..
 Statistical know how
 The amount of data
 Presentation of results
 Use of the results
 Reporting and availability to users
 The amount of data
DATA COLLECTION
“Measure what
is measurable,
and make
measurable
what is not”
Galileo Galilei
STEP TWO – DEFINE WHAT
YOU ARE MEASURING
The Measurand is procedure dependant
 Definition should have sufficient detail e.g. FVIII:C v
Chromogenic FVIII
 Must include the system containing the component e.g.
plasma
 “Kind of quantity” e.g. amount of substance concentration,
amount of substance activity…..”
The definition in itself can give rise to uncertainty!
THE MEASURAND
“Get your
facts first,
then you can
distort them
as you
please”
Mark Twain
1835-1910
STEP THREE –
ACCOUNTING FOR
RESULTS THAT ADVERSELY
INFLUENCE CALCULATIONS
RANDOM RESULTS AND OUTLIERS
“I can calculate the
motion of heavenly
bodies, but not the
madness of people.”
Sir Isaac Newton
STEP FOUR –
CALCULATING
IMPRECISION
IMPRECISION
STEP FIVE – DEFINING
YOUR SIGNIFICANT
FIGURES
TELLING IF THINGS ARE DIFFERENT
The granularity of the measurement –
No valid measurement process is EVER expected to
generate perfectly reproducible results except under
wildly improbably conditions
ROUNDING ERRORS AND THE “BUTTERFLY
EFFECT”
“Delay is
preferable to
error.”
Thomas
Jefferson
STEP SIX – ACCOUNTING
FOR BIAS
QUICK AND EASY “LOOK” AT BIAS
“If the facts
don't fit the
theory, change
the facts.”
Albert Einstein
STEP SEVEN – ASSESSING
YOUR DATA
WHEN AND HOW OFTEN
TREES DON’T GROW LIKE THEY USED TO
THE PROBLEM WE FACE WITH INDIRECT MEASUREMENT
Problem
 No guidance (or even requirement) for a
budget
?Solution
 ISO and NIST recommendations (FOR
INDUSTRY!)
 Spec. Interval/Uncertainty>=4
 Define the interval?
 Reference range
 Reporting range
 Linearity of assay
 QC acceptance range………
 Biological variation targets?
THE UNCERTAINTY BUDGET
“SOME EXAMPLES”
 Fully automated on calibrated analysers
 Manual methods usually performed on automated analysers where QC is
available
 Uncertainty
 Method agreement
 Manual methods usually performed on automated analysers where QC is NOT
available
 Uncertainty
 Method agreement
 Manual methods NOT usually performed on automated analysers where QC is
NOT available
 Manual methods NOT usually performed on automated analysers where QC is
from in house
 Manual techniques requiring interpretation for positive/negative results
 Assays where the pipetting step is the major source of uncertainty
CLASSIFICATION OF ASSAYS
PT
The most exciting
phrase to hear in
science, the one that
heralds new
discoveries, is not
'Eureka!' but 'That's
funny...'
Isaac Asimov
SO WHAT DOES THIS ALL
DO FOR US? – THE
FINDINGS
“ROUTINE” HAEMOSTASIS ASSAYS
ANYTHING INTERESTING - IMPRECISION
PT-based Factor assays
aPTT-based Factor assays
SUMMARY OF UNCERTAINTY IN HAEMOSTASIS
FACTOR ASSAYS
THROMBOPHILIA AND THE APC RATIO
LET’S MAKE IT A WHOLE LOT WORSE!!
A WORK IN PROGRESS
http://www.itl.nist.gov/div898/handbook/mpc/section5/mpc552.htm
A. Ratio – Patient dRVVT screen/NPP dRVVT screen
B. Ratio – Patient dRVVT confirm/NPP dRVVT confirm
% correction = A-B/A x 100
Lupus aPTT ratio = Lupus sensitive aPTT/Lupus insensitive aPTT
“MANUAL” TESTS
ELECTRONIC QC INTER OBSERVER
VARIATION AND COMPETENCY TESTING
 All results are wrong
 What we need to do is
statistically find those assays
that are useful to:
 Patients
 Clinicians
 Process management
SO WHAT’S THE BOTTOM LINE?
“THE EFFORT AND COST OF ESTIMATING MU SHOULD BE COMMENSURATE WITH THE CLINICAL QUALITY OF MEASUREMENT REQUIRED”
G.H. WHITE
Blood, Sweat and Tears
Compliance
Good enough …………..
USEFUL RESOURCES
Acknowledgements:
The entire Specialist Haemostasis team for listening to me drone on
about this for what seems like forever
Alan Morgan - Chief Data compiler
stephenmacdonald1@nhs.net
Thank you for listening
“IN CONDITIONS OF UNCERTAINTY, HUMANS, LIKE OTHER ANIMALS, HERD TOGETHER FOR PROTECTION”
JAMES SUROWIECKI – US JOURNALIST (2013)

MU IBMS 2015

  • 1.
  • 2.
    I have noconflicts of interest to declare I have no affiliation whatsoever with UKAS Any data presented is my own and is not specific to any individual vendor, analyser or platform I am not sure what any of this means! I am not sure anybody really does! This is entirely based on my interpretation and recent experience of a UKAS inspection DISCLOSURES “I DON’T PRETEND WE HAVE ALL THE ANSWERS, BUT THE QUESTIONS ARE CERTAINLY WORTH THINKING ABOUT” ARTHUR C. CLARKE
  • 3.
    ACCURACY V PRECISION “HOUSTON,WE HAVE A PROBLEM” APOLLO 13 - 1995
  • 4.
    BIAS AND ERROR? Figuremodified from; http://www.cdc.gov/nchs/tutorials/Dietary/Basic/StatisticalConsiderations/Info2.htm
  • 5.
    WHAT ARE ALLTHESE ERRORS? WHAT WE ALREADY “KNOW” – WE ARE HALF WAY THERE? Random error Systematic Error Slide courtesy of Dr. Roger Luddington But we need a number!!!!!!!
  • 6.
    ISO15189:2012 5.5.1.4 Measurement uncertaintyof measured quantity values The laboratory shall determine measurement uncertainty for each measurement procedure in the examination phase used to report measured quantity values on patients’ samples. The laboratory shall define the performance requirements for the measurement uncertainty of each measurement procedure and regularly review estimates of measurement uncertainty. NOTE 1 The relevant uncertainty components are those associated with the actual measurement process, commencing with the presentation of the sample to the measurement procedure and ending with the output of the measured value. NOTE 2 Measurement uncertainties may be calculated using quantity values obtained by the measurement of quality control materials under intermediate precision conditions that include as many routine changes as reasonably possible in the standard operation of a measurement procedure, e.g. changes of reagent and calibrator batches, different operators, scheduled instrument maintenance. NOTE 3 Examples of the practical utility of measurement uncertainty estimates might include confirmation that patients’ values meet quality goals set by the laboratory and meaningful comparison of a patient value with a previous value of the same type or with a clinical decision value. The laboratory shall consider measurement uncertainty when interpreting measured quantity values. Upon request, the laboratory shall make its estimates of measurement uncertainty available to laboratory users. Where examinations include a measurement step but do not report a measured quantity value, the laboratory should calculate the uncertainty of the measurement step where it has utility in assessing the reliability of the examination procedure or has influence on the reported result.
  • 7.
    SURELY WE AREMILES AHEAD OF WHERE WE WERE!!! Disclaimer: Other automated analysers are available
  • 8.
    STEP ONE –COLLECT YOUR DATA “It is a capital mistake to theorize before one has data.” Sir Arthur Conan Doyle
  • 9.
     The amountof data  The sources (analysers, manual)  The amount of data  Format – excel, csv, handwritten……..  Statistical know how  The amount of data  Presentation of results  Use of the results  Reporting and availability to users  The amount of data DATA COLLECTION
  • 10.
    “Measure what is measurable, andmake measurable what is not” Galileo Galilei STEP TWO – DEFINE WHAT YOU ARE MEASURING
  • 11.
    The Measurand isprocedure dependant  Definition should have sufficient detail e.g. FVIII:C v Chromogenic FVIII  Must include the system containing the component e.g. plasma  “Kind of quantity” e.g. amount of substance concentration, amount of substance activity…..” The definition in itself can give rise to uncertainty! THE MEASURAND
  • 12.
    “Get your facts first, thenyou can distort them as you please” Mark Twain 1835-1910 STEP THREE – ACCOUNTING FOR RESULTS THAT ADVERSELY INFLUENCE CALCULATIONS
  • 13.
  • 14.
    “I can calculatethe motion of heavenly bodies, but not the madness of people.” Sir Isaac Newton STEP FOUR – CALCULATING IMPRECISION
  • 15.
  • 16.
    STEP FIVE –DEFINING YOUR SIGNIFICANT FIGURES
  • 17.
    TELLING IF THINGSARE DIFFERENT The granularity of the measurement – No valid measurement process is EVER expected to generate perfectly reproducible results except under wildly improbably conditions
  • 18.
    ROUNDING ERRORS ANDTHE “BUTTERFLY EFFECT”
  • 19.
  • 20.
    QUICK AND EASY“LOOK” AT BIAS
  • 21.
    “If the facts don'tfit the theory, change the facts.” Albert Einstein STEP SEVEN – ASSESSING YOUR DATA WHEN AND HOW OFTEN
  • 22.
    TREES DON’T GROWLIKE THEY USED TO THE PROBLEM WE FACE WITH INDIRECT MEASUREMENT
  • 23.
    Problem  No guidance(or even requirement) for a budget ?Solution  ISO and NIST recommendations (FOR INDUSTRY!)  Spec. Interval/Uncertainty>=4  Define the interval?  Reference range  Reporting range  Linearity of assay  QC acceptance range………  Biological variation targets? THE UNCERTAINTY BUDGET
  • 24.
  • 25.
     Fully automatedon calibrated analysers  Manual methods usually performed on automated analysers where QC is available  Uncertainty  Method agreement  Manual methods usually performed on automated analysers where QC is NOT available  Uncertainty  Method agreement  Manual methods NOT usually performed on automated analysers where QC is NOT available  Manual methods NOT usually performed on automated analysers where QC is from in house  Manual techniques requiring interpretation for positive/negative results  Assays where the pipetting step is the major source of uncertainty CLASSIFICATION OF ASSAYS
  • 26.
  • 27.
    The most exciting phraseto hear in science, the one that heralds new discoveries, is not 'Eureka!' but 'That's funny...' Isaac Asimov SO WHAT DOES THIS ALL DO FOR US? – THE FINDINGS
  • 28.
  • 29.
    ANYTHING INTERESTING -IMPRECISION PT-based Factor assays aPTT-based Factor assays
  • 30.
    SUMMARY OF UNCERTAINTYIN HAEMOSTASIS
  • 31.
  • 32.
  • 33.
    LET’S MAKE ITA WHOLE LOT WORSE!! A WORK IN PROGRESS http://www.itl.nist.gov/div898/handbook/mpc/section5/mpc552.htm A. Ratio – Patient dRVVT screen/NPP dRVVT screen B. Ratio – Patient dRVVT confirm/NPP dRVVT confirm % correction = A-B/A x 100 Lupus aPTT ratio = Lupus sensitive aPTT/Lupus insensitive aPTT
  • 34.
    “MANUAL” TESTS ELECTRONIC QCINTER OBSERVER VARIATION AND COMPETENCY TESTING
  • 35.
     All resultsare wrong  What we need to do is statistically find those assays that are useful to:  Patients  Clinicians  Process management SO WHAT’S THE BOTTOM LINE? “THE EFFORT AND COST OF ESTIMATING MU SHOULD BE COMMENSURATE WITH THE CLINICAL QUALITY OF MEASUREMENT REQUIRED” G.H. WHITE Blood, Sweat and Tears Compliance Good enough …………..
  • 36.
  • 37.
    Acknowledgements: The entire SpecialistHaemostasis team for listening to me drone on about this for what seems like forever Alan Morgan - Chief Data compiler stephenmacdonald1@nhs.net Thank you for listening “IN CONDITIONS OF UNCERTAINTY, HUMANS, LIKE OTHER ANIMALS, HERD TOGETHER FOR PROTECTION” JAMES SUROWIECKI – US JOURNALIST (2013)

Editor's Notes

  • #3 I have aimed to make this as general as possible, there are some parts that are specific to the platforms and software available to us but nothing that is contained in here is specific for our institution We had an inspection in what was probably the busiest week possible. We were implementing a hospital wide integrated computer system to replace all out IT that weekend. From the Tuesday to the Thursday we had an inspection So what my approach to this going to be? I aim to give my perspective of: where the demands have come from, where we are going and how we are going to get there
  • #4 Quote is neither accurate nor precise as there was a problem (very vague) but also the quote itself was not stated at the time, hollywood dramatisation To determine accuracy you need to be able to determine how close a result is to a known value. We are already starting form a standing start as we do not directly measure anything in haemostasis. We use indirect measurement by analysis the effect a variable has on an entire system. We are unable to do that as we are using indirect measurement techniques and are susceptible to under determination – that’s a different philosophical question. We have a better fee for what our assays are doing rather than merely churning out numbers. Anaecdote about getting FVIII control to pass by putting them in numerical order To assess precision statistical tool and techniques can be used irrespective of the actual true value. Precision is a measure of the data itself rather than having any external reference Shaquille o neal has the second highest NBA field goal accuracy of 0.582. mainly due to him being 7’1” and 23 stone and nobody being able to get near him at the basket for his famous dunk shot. In free throws he was one of the lowest success rates 52.7% despite being the 3rd most fouled player of all time – the Hack a Shaq. He would regularly hit the rim at the back of the ring and it would bounce out, very precise but not accurate for what he was aiming at
  • #6 In the laboratory stats are not new to us. But we need to be carful about what we are comfortable with and what we already know. QC charts or Levy-Jennings charts are used regularly. The were proposed in 1950 as a modification for the commonly used shewhart charts used in engineering We use westgard rules as a measure of the asays performance. They are derived statistically and are meant to detect both random errors and systematic errors and it is here that the frst concepts of uncertainty become clear to us. Anyone who has performed a platelet ricof knows the feeling of a CV that is very high, but the phrase of – “that’s the way the assay is” tends to be used
  • #7 When asked for a title for this presentation I replied with what, why, how, when as these are the questions that are most commonly asked This document seems to answer that quite succinctly Important points Note 1 –This is the what Measurement procedures Performance requirements Review of these performance requirements Note 2 –This is the when Note 2 - How – by using QC Note 3 – the why For clinicians, decision values and changes in results in a patient 2 problems The bit at the end that seems to vaguely tell you that you need to do everything on everything The information on how is pretty vague Time for our old friend google – all biochemistry
  • #8 Mention polynomial regression to remove error associated with the best line of fit for a curve
  • #9 Haemostasis is as much art as science Without working in other biomedical science labs I don’t know but certainly as scienticst in haemostasis we have a feel for how our assays perform, and especially what the results mean The clotting system is very multi part with many different systems influencing the entire clotting ability in a variety and sometimes contradictory way It is a strange concept to us to have to be so incredibly prescriptive and very detiled with the results we give It could be suggested a simple traffic light system would work for bleeding, likely to bleed, wont bleed
  • #11 Tis quote struck a chord with me as it is a common misconception that what is widely termed u of m is only needed for our automated tests that run on analyser and give a numerival result Reports from UKAS inspections have clearly stated that there is a much wider scope for what is quantified using u of m
  • #13 Despite what is sayd in this quote I am in no way advocating fiddling results However, there are results that will be contained within our data set that will be false and will influence our results These may be the default 9999999 given or 0.0000001 in Hb analysers Without adequate checking of the source data any further results we produce will be themselves completely invalid by virtue of the fact that rubbish results were put in at the beginning This is a problem with computerised software that doesn’t have the “experience” to spot a bad result to a result that doesn’t mean anything There are also the fact that many systems of data collection may sstill require manual input of result. It happens very often where a decimal point is put in the wrong place or missed out ……
  • #15 Sometimes this will drive you mad Mathematician are worse than haematologists for using excessively complicated terms and symbols to explain concepts
  • #16 Click one brings up guide Imprecision is based upon the simple concept of how much the results are spread out. That is the spread around what we measure as the “average” or mean value. This does not equate to how close it is to the true value. This is not new to us, we are used to using standard deviation for construction of reference ranges. The spread can also be expressed as the relative standard deviation which is effectively the CV It is important to note that the graph above depicts the normal distribution. It is worth checking to see that your data does fit this, if it doesn’t we need to seriously re evaluate the statistics we use Click 2 bring up formulae Cancellation if only one level. This formula gives us a simple method to combine the SD or RSD at different levels to be able to give us a combined result for the impresicion across the range tested – BUT ONLY THAT RANGE!
  • #18 GUM states that all measurements should be reported to the number of significant figures that are reported in the uncertainty. The maximum number of significant figures should be 2 However, in medical laboratories it is thought more appropriate to quote the uncertainty to the same number of digits to that used in the reported result
  • #19 Click one – jeff goldblum Beware of excel and other computerised models Machines round up, some places round down on .5 etc… 0.35 rounded to 0.4 0.45 rounded to 0.4 to avoid going to 0.5 Depends on analyser software and specific language used Particularly Java Weather simulation Computer rounding Propagation of errors German Elections Surely this brings an uncertainty into the uncertainty we are reporting!!!
  • #20 Although many sources tell you that bias can be forgotten about, or not considered if it is <10% of the imprecision this is for systems vastly different from ours It takes time but is vital for accurate reporting of uncertainty
  • #21 Beware – actually the Z-score NOT the measure of spread of the results New software upgrades are continually becoming available The progress in software design is so fast we will have all this done for us in only a matter of time?!!........
  • #22 The common question is how often should I reevaluate this and what should drive this?
  • #23 Under determination Holistic – nothing is falsifiable Contrastive – nothing is verifiable The uncertainty budget is based on the hypothesis that our assays are performing acceptably based on being within a predefined budget Windmill Working backwards Analogous to an aPTT Average seasonal temperature measured by width of growth rings on trees – compare to amount of factor VII measured by the degree of shortening of the aPTT An indirect measure using a direct measure Underdetermination https://books.google.co.uk/books?id=uDSKn0AyhvIC&pg=PA8&lpg=PA8&dq=indirect+measurement+throughout+history&source=bl&ots=LAG3TWPXQi&sig=M97cOcXUPVPpxSqV6yO09LYdBJQ&hl=en&sa=X&ved=0CEoQ6AEwB2oVChMI4d-l2PT2xwIVQekUCh06_ARj#v=onepage&q=indirect%20measurement%20throughout%20history&f=false  Quality control material should approximate the same matrix as patient specimens, taking into account properties such as viscosity, turbidity, composition, and color
  • #24 The myth of what is an acceptable “uncertainty budget” in haemostasis testing There is an inherent uncertainty initially involved with the assumption that our samples represents the “population” sample This cannot be prevented other than by increasing into very large sample numbers. But, we don’t have that luxury due to the nature (matrix effect) of our QC and also the frequent lot number changes we have. Not only that but it is clear, or will, that the influence of many different reagents and lot number changes will have on our results. By retesting and re-evaluating every time there is a change, we automatically reduced our sample size and introduce more uncertainty due to our sampling The biological variation can be used with goals set as a comparison of the imprecision with regards to the intra assay CV i.e. biological variation between individuals so that the optimum are <25%, desirable, 50% and minimum 75%
  • #27 The limit of this is that the uncertainty is only evaluated at these two given points We can confidently get a feel for what the uncertainty is between these points as we can look at the change in CV between each level BUT, below the bottom point and ABOVE the top point are unknown to us
  • #30 The massive issue with the dabigatran uncertainty is by virtue of the fact that the assay needed to be tweeked to get a reliable and reproducible result. The sensitivity of the assay at different wavelengths influenced the Qc value. As did the quality of the control material. It was found to be slightly lipaemic as it was a spiked normal plasma. By not removing the “set up phase” QC there is an undue and excessive influence on the imprecision quoted which is in fact not inherent to the assay itself (QC lipaemia) and some that was (Wavelength issues).
  • #31 Doesn’t seem to be an proportional change in uncertainty – some assays will group together so that they have the same imprecision, and the same uncertainty Some do not and show a difference in the results when the QCs are ranked. This shows an influence of the assay on the uncertainty at different levels. This makes the % uncertainty more appropriate for certain – and maybe all assays However, that means that if we are to quote results +/- uncertainty we need a way of applying that calculation for all results
  • #36 The results need to be clinically useful for clinicians How useful this will be is debatable. They struggle to come to terms with the maths behind a reference range Staistics of protein c abnormal results, normal range calculations and uncertainty