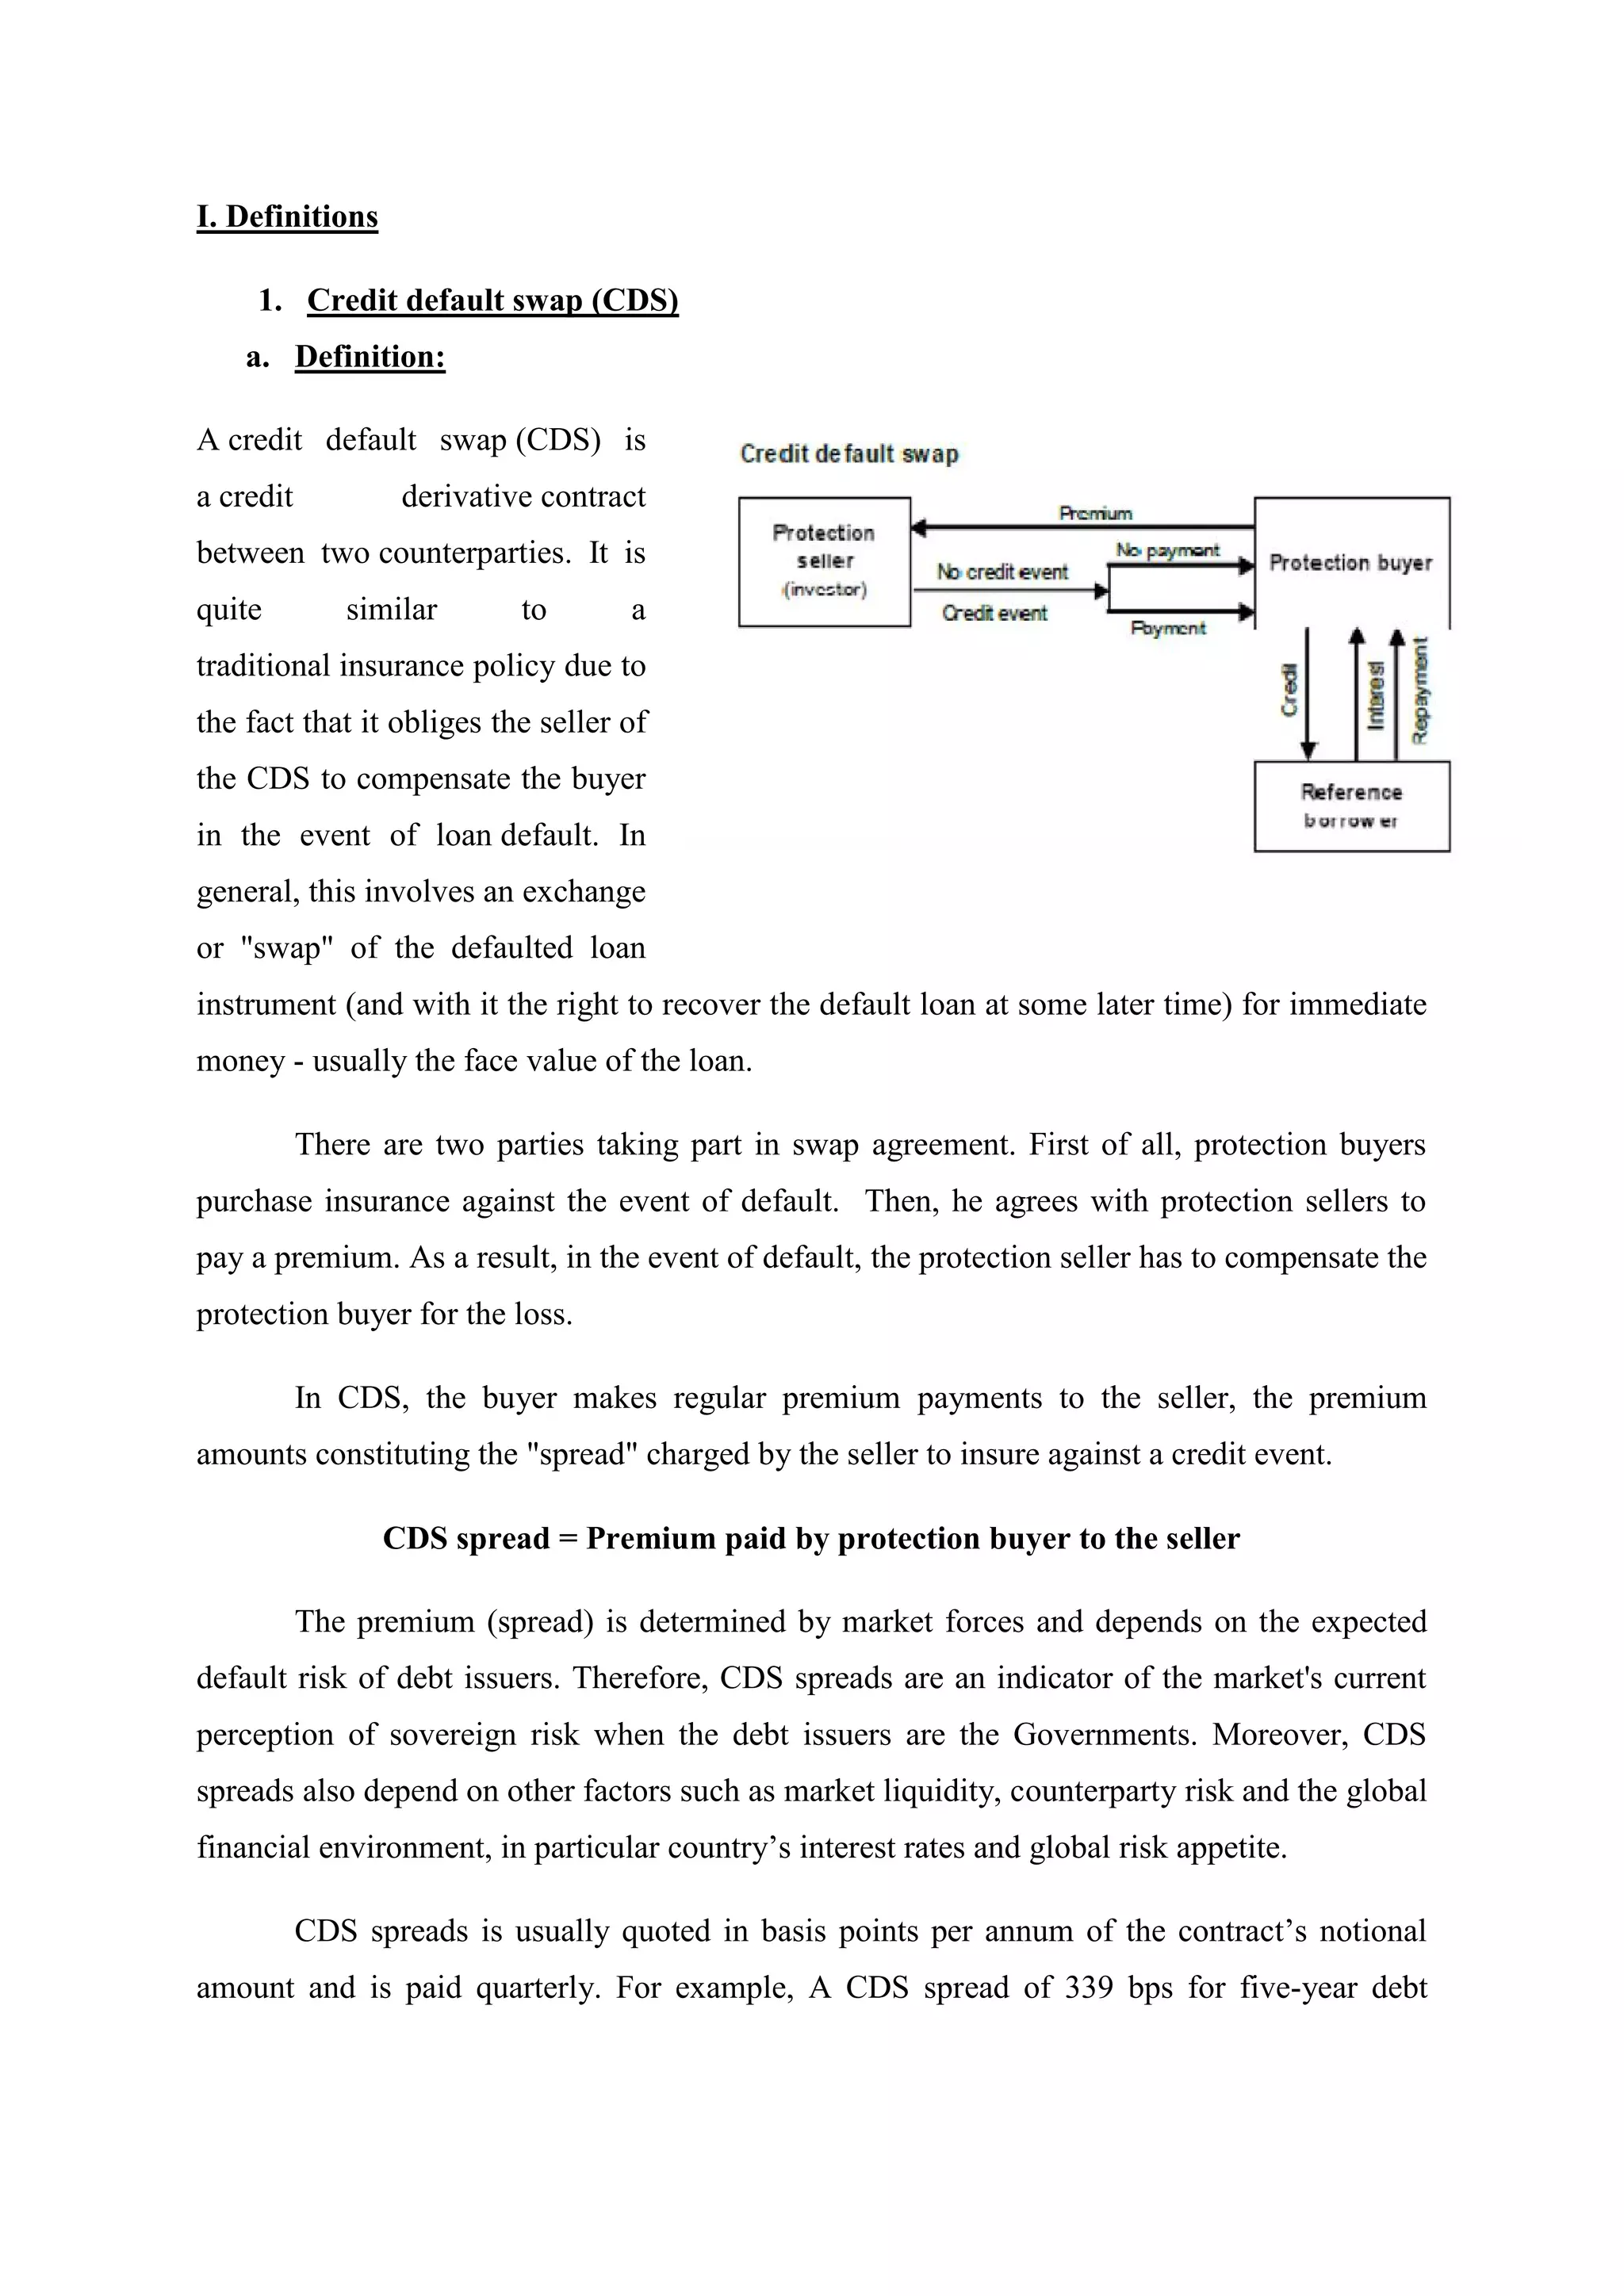
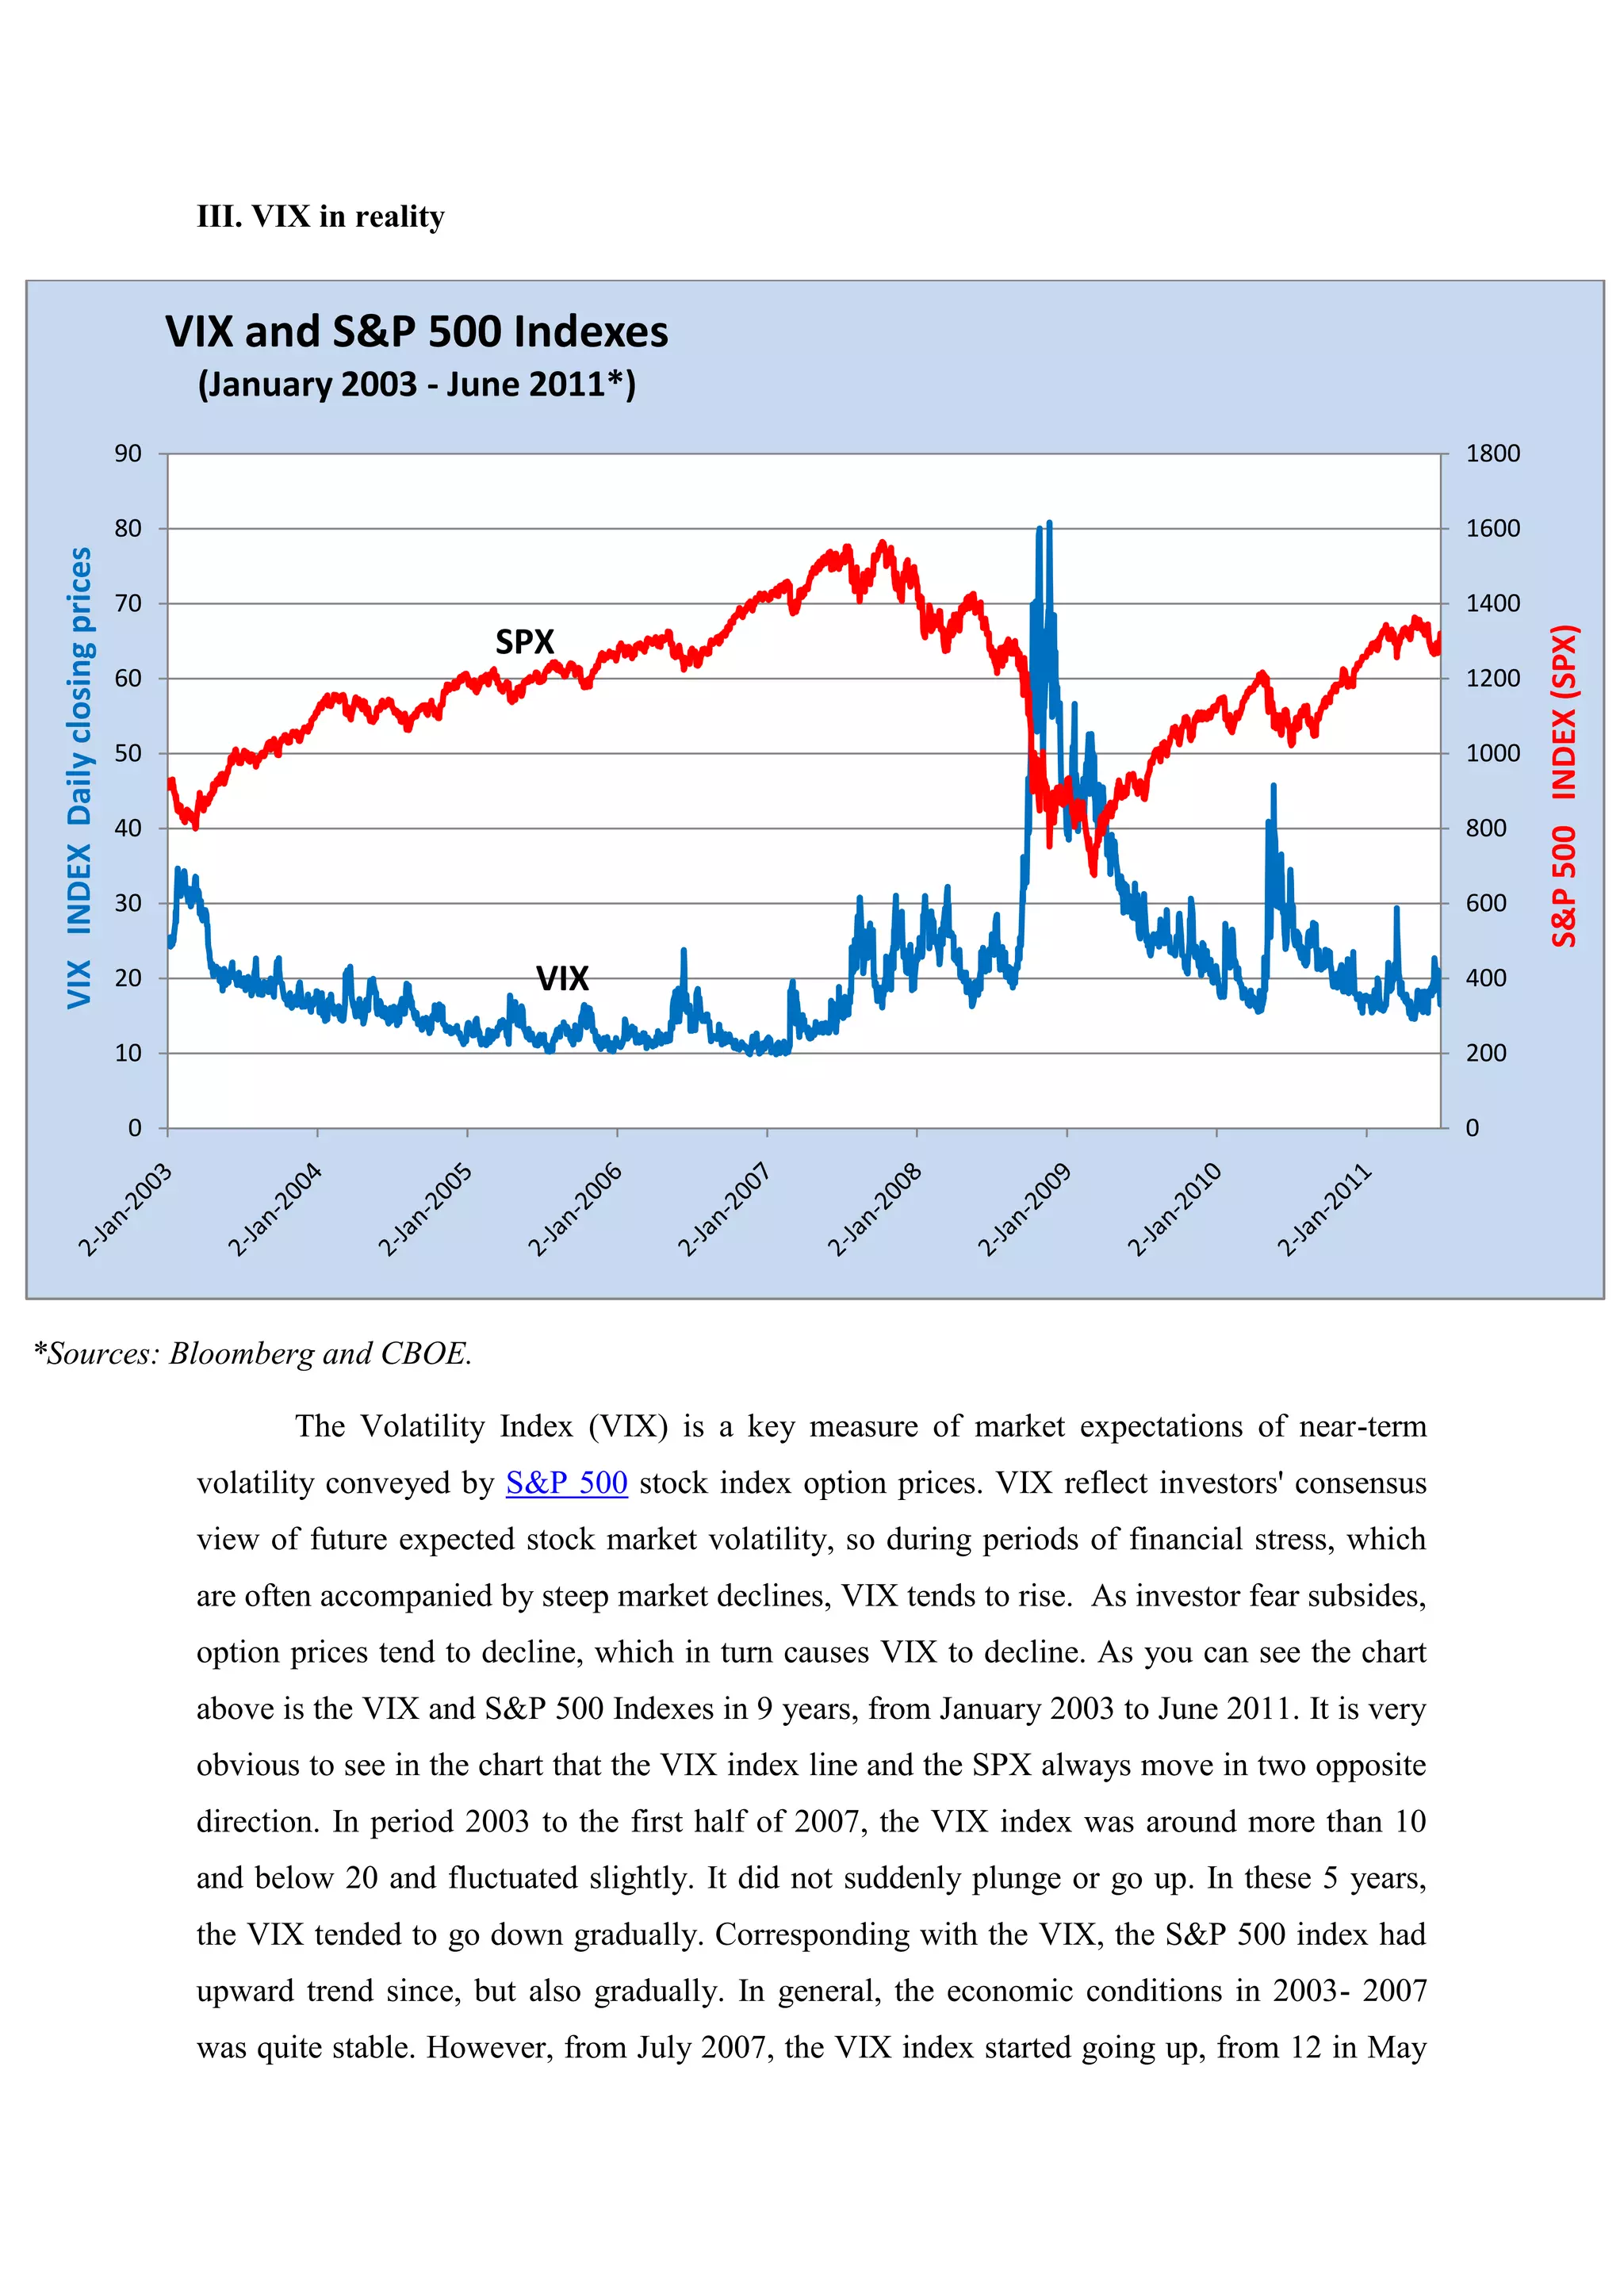
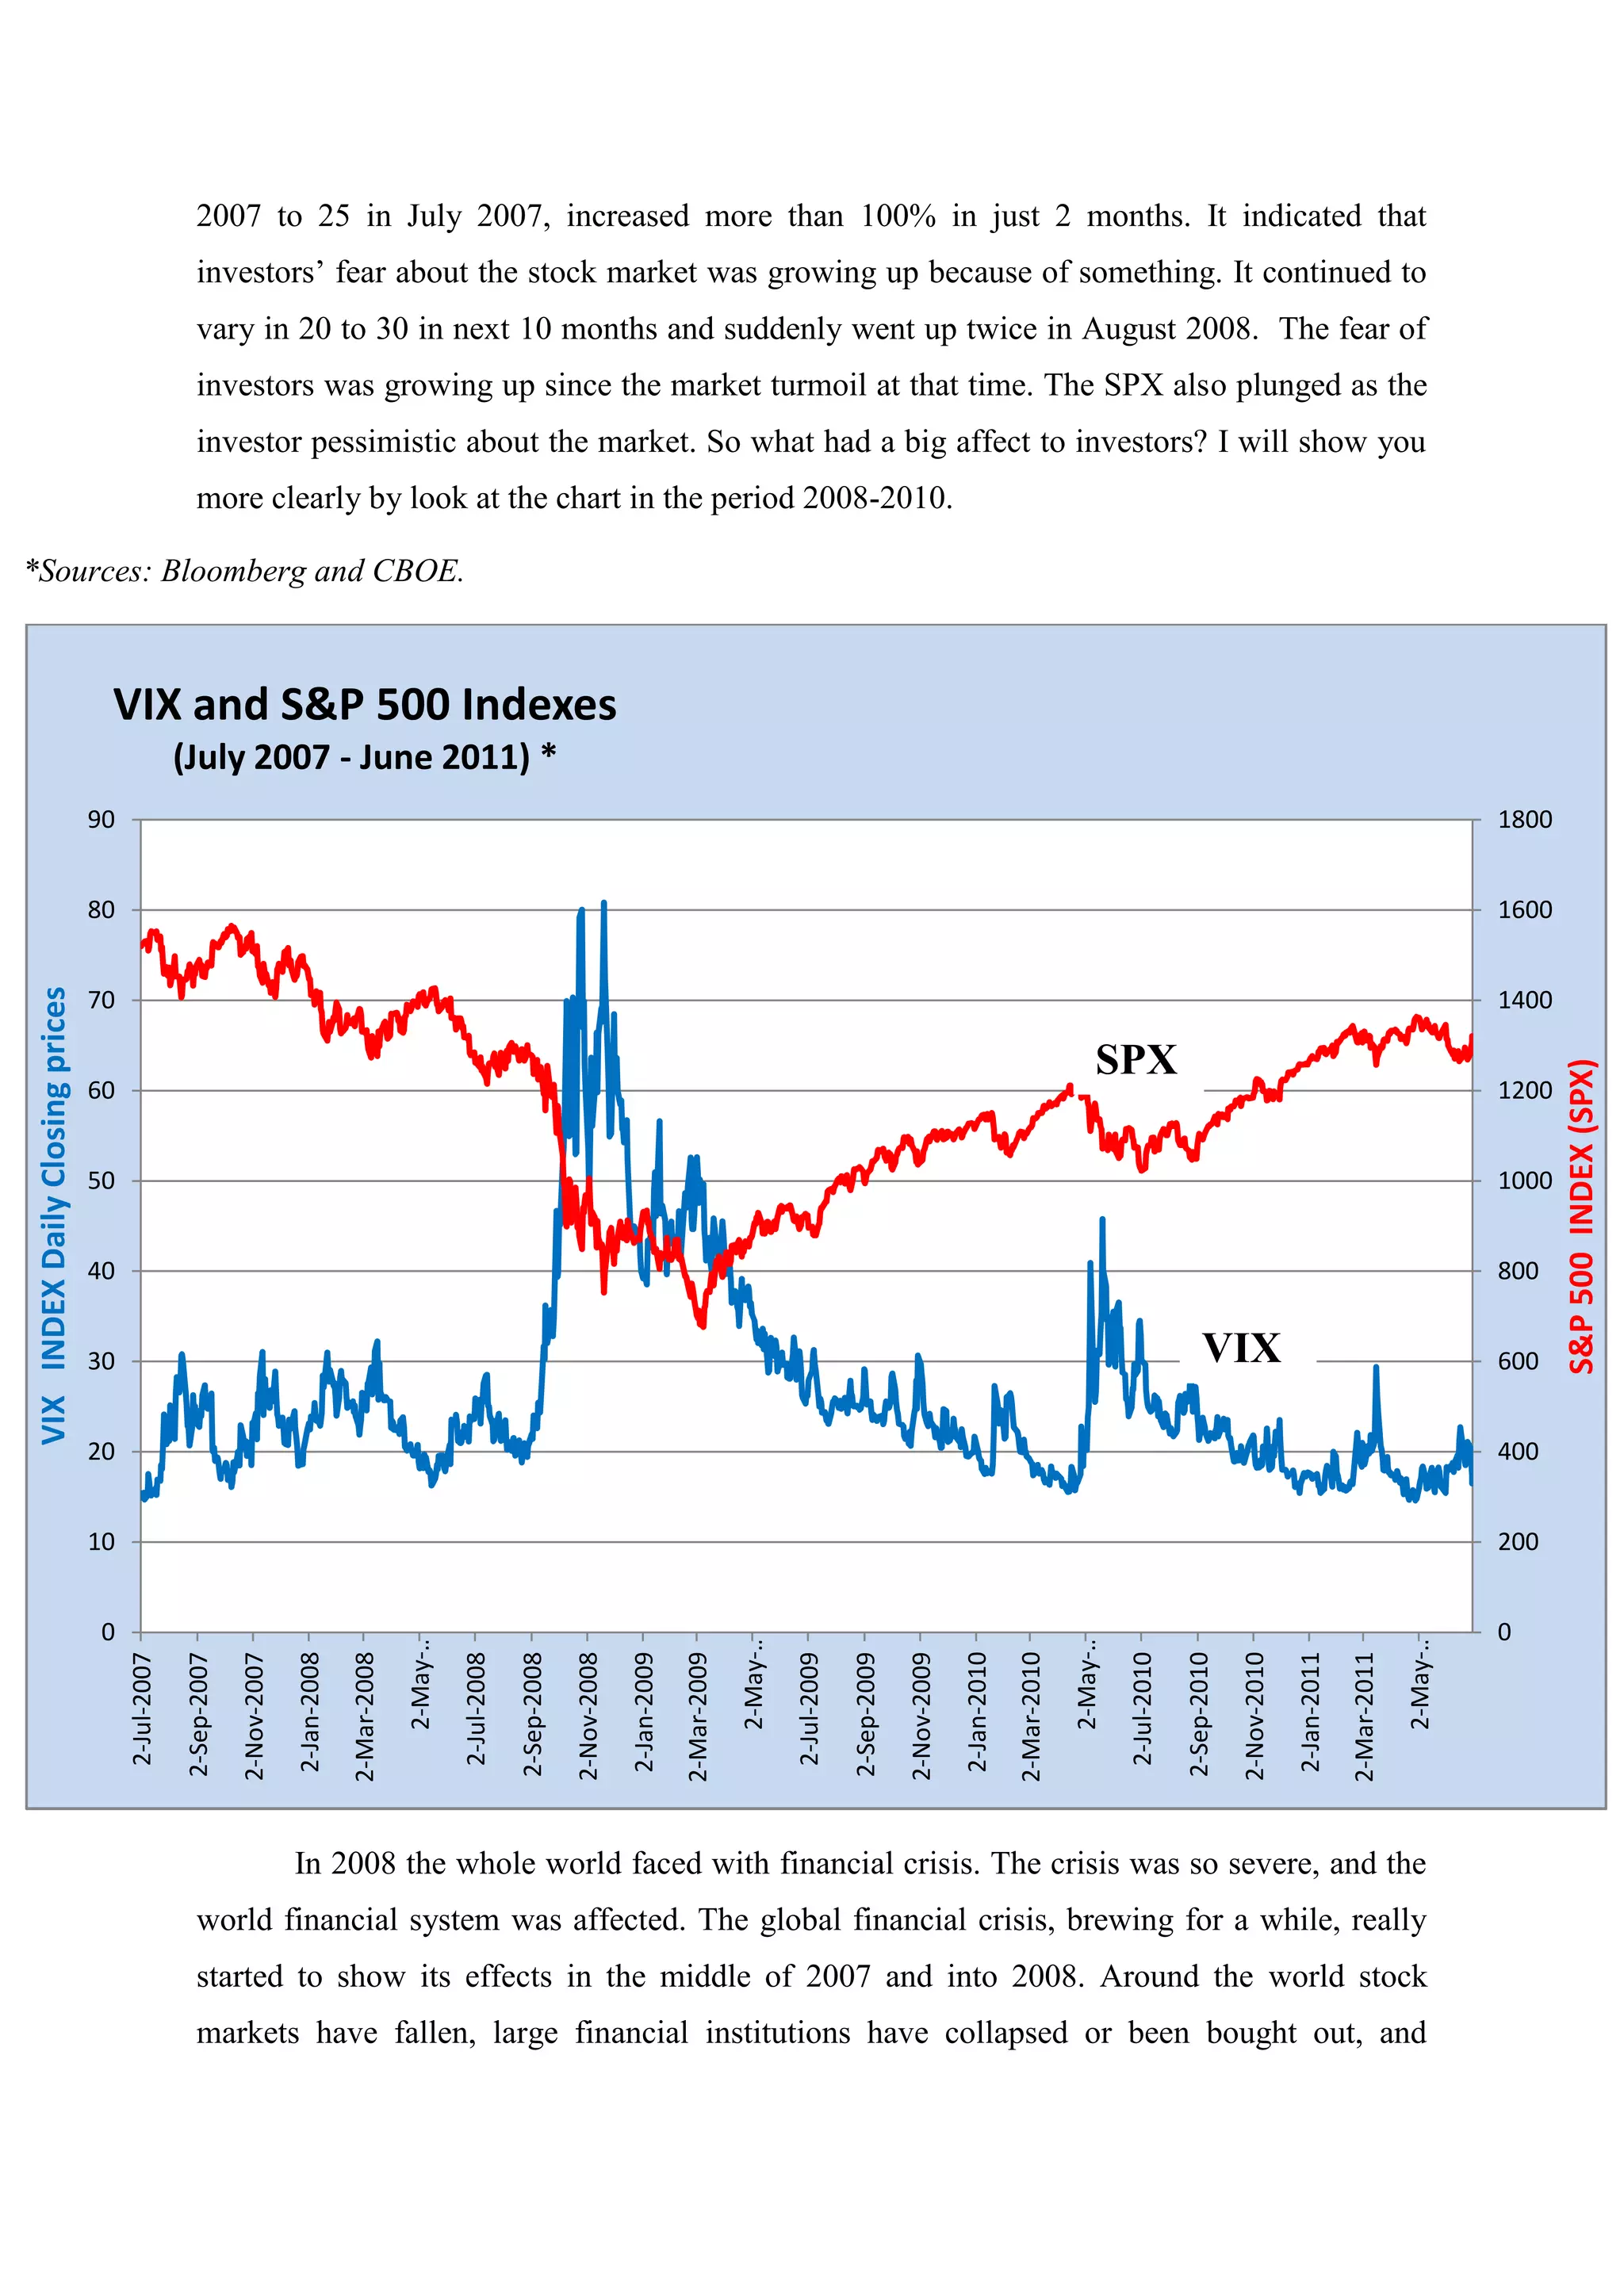
The document discusses the VIX index and credit default swap (CDS) spreads. It provides definitions and background information on both. Regarding the VIX index, it notes that the VIX represents the implied volatility of S&P 500 index options and is often called the "fear index" because high values correspond to periods of uncertainty and falling stock prices. The document then charts the VIX index and S&P 500 from 2003-2011, showing that the VIX rises during financial crises as stock prices fall, such as during the 2008 global financial crisis when the VIX reached record highs above 80. It also discusses how CDS spreads relate to default probabilities.
The document provides an overview of chapter 6 from a lecture on money, banking, and financial markets. It discusses:
1) The risk structure of interest rates, explaining three facts about differences in interest rates for bonds with varying levels of risk. Default risk, liquidity, and tax considerations can explain these facts.
2) The term structure of interest rates, identifying three facts about differences in rates for bonds of varying maturity. Expectations hypothesis and segmented markets theory aim to explain these facts, but each has limitations.
3) Liquidity premium and preferred habitat theories combine elements of the above theories to more fully explain the term structure facts, recognizing bonds are neither perfect substitutes nor completely segmented.
This document provides an overview of fixed income securities such as bonds. It defines what a bond is, noting that a bond represents a loan where the issuer pays interest to the investor. It describes the key characteristics of bonds like the issuer, coupon rate, maturity date, and ratings. It also distinguishes bonds from equities, explaining that bonds are lower risk but provide fixed income while equities provide ownership and potential share of profits. The document outlines the major issuers of bonds and provides background on how bond markets evolved. It discusses risks associated with bonds and how bonds are valued and traded on exchanges.
This document discusses interest rate risk for banks. It defines interest rate risk as the risk that changes in market interest rates could negatively impact a bank's financial condition. It notes that banks are exposed to interest rate risk whenever the interest rate sensitivity of their assets does not match that of their liabilities. The document outlines various sources of interest rate risk for banks, including repricing risk, yield curve risk, basis risk, and optionality risk. It also discusses how changes in interest rates can affect both a bank's earnings and economic value.
Signs of an impending stock market crashSwapnilRege2
Stock Markets Greed Fear market Pyschology Sotck market Fluctuations Signs of Stock market reaching the top Initial signs of bear market beginning Market fluctuations
The document discusses the term structure of interest rates, which refers to how interest rates vary with the maturity or term of a bond. Specifically:
1) It examines why practically homogeneous bonds of different maturities have different interest rates, which is significant for both borrowers and lenders when deciding whether to invest in short-term vs long-term bonds.
2) It defines the yield curve as a graphical depiction of the relationship between yield and maturity for bonds of the same credit quality. The term structure of interest rates shows this relationship for zero-coupon bonds.
3) To construct the term structure, theoretical spot rates must be derived from yields on actual Treasury securities, since zero-coupon Treasuries only
The prospect of rising interest rates continues to pose a risk to bond investors, but how a rise
in interest rates impacts investors depends on multiple factors.
This document discusses interest rate risk and how it can affect businesses. It is divided into income risk and capital risk. Income risk refers to the risk of changes in cash flows from fixed and floating interest rates. Capital risk is the reduction in the value of long-term financial assets due to changes in interest rates. The document also discusses asset-liability structure risk for banks, financial swaps, and the different types of swaps including currency swaps, cross-currency interest rate swaps, and interest rate swaps.
This chapter discusses factors that cause interest rates to change over time. It examines the forces that move interest rates using a supply and demand framework for bonds. The demand for bonds depends on wealth, expected returns, risk, and liquidity. The supply depends on expected profitability, expected inflation, and government activities. Changes in these factors can shift the supply and demand curves for bonds and change the equilibrium interest rate. The chapter analyzes examples like the Fisher effect and business cycle expansions to demonstrate how interest rates are determined.
IOSR Journal of Business and Management (IOSR-JBM) is an open access international journal that provides rapid publication (within a month) of articles in all areas of business and managemant and its applications. The journal welcomes publications of high quality papers on theoretical developments and practical applications inbusiness and management. Original research papers, state-of-the-art reviews, and high quality technical notes are invited for publications.
Prudent approach to bond investing part 2Paul Escobar
The document summarizes the risks of bond investing in the current market environment. It notes that while bonds have historically provided stable returns, bond prices can decline when interest rates rise. A 3% increase in rates could result in a 12.7% total loss for bond funds. However, bonds continue to play an important role in diversifying equity risk in balanced portfolios. Their low correlations to stocks mean they do not react similarly to events that cause stock market declines. The document advocates maintaining balanced exposure to bonds for their diversification benefits and higher long-term yields, despite short-term volatility from rising rates.
Chapter 03_What Do Interest Rates Mean and What Is Their Role in Valuation?Rusman Mukhlis
This chapter discusses interest rates and their role in valuation. It defines key terms like yield to maturity, which is the most accurate measure of interest rates. It examines how to measure and understand different interest rates, the distinction between real and nominal rates, and the relationship between interest rates and returns. It also covers how the concept of present value is used to evaluate debt instruments and how duration is used to measure interest rate risk.
Fixed Income - Arbitrage in a financial crisis - Swap Spread in 2008Jean Lemercier
Group 15 submitted their coursework for the MSc in Finance module "Fixed Income". Their submission analyzed a proposed fixed income arbitrage trade by Albert Mills at Kentish Town Capital to take advantage of abnormally low swap spreads in November 2008 following the financial crisis. The trade involved going long 30-year interest rate swaps and shorting 30-year Treasuries to match duration. Key risks included counterparty risk, changes in Treasury yields requiring more collateral, and the ability to renew short-term repo agreements over 30 years. The group analyzed why swap spreads had fallen so low and could potentially become negative.
An interest rate is the cost of borrowing money expressed as a percentage of the total amount borrowed. Interest rates are not directly determined by supply and demand but are indirectly set by the Reserve Bank of Australia through its impact on the cash rate. There are different types of interest rates depending on whether an institution is borrowing or lending funds and the term of the financial assets. Factors like the demand for capital goods, savings levels, inflation expectations, and international rates can affect general interest rate levels in Australia. The Reserve Bank uses domestic market operations like buying and selling government securities to influence the cash rate and monetary policy.
Commodities can be useful diversifiers for inflation risk when included in a portfolio, but the shape of the futures curve is important. When the spot price is lower than deferred futures prices (contango), changes are likely due to demand, while a backwardated market suggests supply issues. Evaluating the term structure allows investors to better understand if commodities will diversify portfolio risk from inflation.
This document discusses inflation, deflation, yield curves, and duration and how they impact interest rates and asset prices. It defines key terms like inflation, nominal and real interest rates, and explores theories on the relationship between inflation and interest rates. It also examines how yield curves are formed and used, and introduces the concept of duration as a measure of a debt security's price sensitivity to interest rate changes.
This document summarizes a study on crash risk in currency markets associated with carry trades. The study finds that:
1) Currencies with high interest rate differentials (investment currencies) experience negative skewness in exchange rate movements, indicating crash risk, while currencies with low interest rates (funding currencies) experience positive skewness.
2) High interest rate differentials are associated with larger speculator positions in investment currencies and increased crash risk.
3) Losses from carry trades increase the price of crash risk protection but reduce speculator positions and future crash risk, similar to insurance markets.
4) Increased global risk or risk aversion as measured by equity volatility indexes leads to reductions in carry trade
This document discusses factors that affect the risk structure of interest rates. It introduces three theories of the term structure of interest rates: expectations theory, market segmentation theory, and liquidity premium theory. Expectations theory holds that long-term interest rates equal the average expected short-term rates. Market segmentation theory sees bond markets as completely separate. Liquidity premium theory combines features of the first two theories, asserting long rates equal expected short rates plus a liquidity premium to compensate for less liquidity of long bonds. It best explains the empirical facts about how short and long rates typically move together and yield curve slopes.
Opportunities for portfolio diversification GenePanasenko
The document discusses opportunities and risks associated with investing in public and private debt markets. It explains that individuals can invest in bonds, bond funds, and private loan funds, with each having different levels of liquidity and risk. It emphasizes the importance of understanding how factors like interest rates, duration, and the financial standing of borrowers can impact the performance of both public and private debt instruments.
This document recommends buying BCOCPE 5.75% 01/18/17 bonds based on an analysis of non-US bank bonds. It conducted an initial screening of over 600 bonds from over 40 countries and 150 issuers to identify investment grade, US dollar denominated bank debt between 3-30 years maturity. It found the strongest relative value in 3-5 year BBB rated European and South American bonds offering 220-250bps spreads. Specifically, it recommends the BCOCPE bonds while noting they are slightly richer than some comparable European issuances.
The document analyzes the investment performance of rare U.S. coins from 1979 to 2011. It finds that over this period, rare coins and stocks achieved the highest average annual returns despite being the most volatile assets. Rare coins had a stronger positive correlation with inflation than gold or other assets, suggesting coins may be a better hedge against inflation. Adding a modest allocation of rare coins to portfolios containing stocks, bonds and bills generally improved returns and reduced risk over the long term.
35 page the term structure and interest rate dynamicsShahid Jnu
The document discusses theories and models of the term structure of interest rates. It covers spot and forward rates, the swap rate curve, traditional theories like expectations theory and liquidity preference theory, modern term structure models like CIR and Vasicek, yield curve factor models, and measures of sensitivity to shifts in the yield curve like duration.
For the first time since 2009, 3-Month LIBOR has risen above 0.75%, which will impact corporate loan deals and potentially benefit investors. A rise in LIBOR means more loans will float off their floors, increasing coupon payments. The rise was likely caused by investors pulling money from prime funds due to impending money market reforms. With low yields across bonds, corporate loans may be preferable for their floating rates and higher yields with less volatility than high yield bonds.
• Spread sectors continued to rally as investors focused more on opportunities than on risks.
• The Fed maintained its stance, but new questions emerged about how much further influence the central bank can exert.
• With tax rates fixed for the near term, policymakers turned their attention to spending cuts.
• Despite tighter valuations in corporate credit, we foresee continued solid demand and fundamentals.
The BRIC thesis posits that China and India will become dominant suppliers of manufactured goods and services respectively, while Brazil and Russia will become dominant suppliers of raw materials. It's important to note that BRIC is an economic term referring to these four emerging economies and not a political or trade alliance. Many companies also cite BRIC as a source of foreign expansion opportunity due to lower costs.
1. The document analyzes data on repurchase agreements (repos) from money market funds and securities lenders to measure the repo funding extended to the shadow banking system.
2. The data suggests there was a run on repo backed by non-Agency MBS/ABS collateral as quantities contracted and prices (haircuts, rates, maturities) increased for this type of collateral, while the repo market for Treasury and Agency collateral was not significantly affected.
3. While the contraction in repo funding for non-Agency MBS/ABS was small relative to its outstanding stock, some dealer banks with larger exposures were more strongly affected and relied on the Fed's emergency lending programs for funding.
The document analyzes bankruptcy risk for three Vietnamese banks from 2008-2010 using four different methodologies: Moody's ratios, S&P ratios, Varizi's model, and Altman's Z-score. It begins with an introduction that provides background on financial risk management and describes the objectives and literature review. Chapter 2 explains the four methodologies to be used. Chapter 3 will provide qualitative and quantitative analysis of the banks using the various models and identify which model provides the most useful bankruptcy signals.
Explanations for the various aspects of an overall internet and digital marketing strategy, including search engine marketing, social media marketing, conversion-focused web design, email marketing, mobile marketing, and web analytics.
The document discusses Vietnam's stock market and interest rates. It provides information on:
1) Vietnam's declining interest rates from 2008-2011 and the effects on investments and the real estate/stock markets.
2) The VN-Index and HNX Index increasing from March-April 2012 following further interest rate cuts.
3) Analysis of specific company SAM's stock price increasing nearly 30% in April due to declining interest rates and expectations for real estate.
The document outlines a 12-week body transformation challenge with spaces to log weekly weight and measurements, daily meals and supplements, as well as cardio workouts and weight training notes. The challenge is broken into 12 weekly sections for participants to track their progress over the course of 3 months.
The document discusses the role of social media in politics and campaigns. It provides examples of how social media was used in the Arab Spring uprisings to organize protests and spread awareness. Examples are also given of how politicians like Barack Obama and social media were used effectively in political campaigns for fundraising, rallying supporters, and engaging voters. The document advocates for the use of social media in political contexts and online petitions.
WSI is a global digital marketing company with over 1,500 offices in 93 countries and a 100-person headquarters in Toronto, Canada. They have helped thousands of small and medium-sized businesses grow their online presence and profitability through innovative Internet technologies and advanced digital marketing strategies. WSI has held the top spot in Entrepreneur Magazine's Franchise 500 ranking in the technology category for 10 consecutive years. Their goal is to help end child poverty through their global outreach program.
All businesses should be taking advantage of the internet for marketing their brand, generating leads, nurturing their existing customers, and reducing expense. Find out what major components are important for an overall internet marketing strategy.
Search engines are the most commonly used resource for consumers looking for local businesses. Over 200 million people in the US conduct online searches each month for services like AC repair. However, many local businesses are missing out on these online customers if they do not have an online presence through search engine advertising. Having a strong online presence can drive significant offline sales and long-term customer value through repeat purchases and referrals.
Basel II has three pillars and aims to better align capital requirements with risks. Pillar 1 updates minimum capital requirements to use more risk-sensitive approaches for credit, market, and operational risk. Pillar 2 requires banks and supervisors to review risk management and capital adequacy. Pillar 3 promotes market discipline through disclosure. Vietnam is implementing Basel II in phases, with the goal of fully adopting the three pillar framework by 2018 to strengthen its banking system.
This document compares annuity certificates and bank certificates. It states that annuity certificates offer faster growth than bank certificates due to tax-deferred interest that compounds over time. An example shows $100,000 growing to $179,085 in 10 years with an annuity certificate compared to $146,607 with a bank certificate. It also argues that annuity certificates are safer investments than bank certificates because they are regulated by state insurance departments and have guaranty funds to protect deposits. The document strongly recommends annuity certificates over bank certificates for their investment returns and safety.
Social Media and Politics_lecture @FHNW BusinessBéatrice Wertli
This document discusses the role of social media in politics and campaigns. It provides examples of how social media was used in the Arab Spring uprisings to organize protests and spread awareness. Social media allows for real-time communication and coordination of political movements. Examples from Germany show how social media discussions influenced the decision to phase out nuclear power after the Fukushima disaster. Creating an online petition and effective social media campaign strategy are discussed as ways for individuals and groups to get involved in political issues.
Realizez o cercetare la desen despre " Importanţa desenului în ciclul primar" şi rog Doamnele învăţătoare să-mi completeze acest chestionar şi să îl trimită pe adresa mea de mail: roxy_tm89@yahoo.com. Multumesc. Documentul se deschide cu Microsoft word.
This document provides an introduction to major investment vehicles and concepts, focusing on fixed income securities. It defines different types of fixed income investments such as Treasury securities, agency bonds, municipal bonds, and corporate bonds. It discusses risks associated with fixed income investments like interest rate risk, price risk, liquidity risk, and reinvestment risk. The document also reviews historical returns of government bonds and notes that future returns are likely to be more subdued given current low interest rates.
The document discusses derivatives, including their growth and types. It provides examples of how derivatives like futures, forwards, options, and swaps work and how they can be used for hedging and speculation. The key types of derivatives are over-the-counter derivatives, which are privately negotiated between two parties, and exchange-traded derivatives, which are traded on organized exchanges.
Interest-rate risk substantially affect the values of the assets and liabilities of most corporations and is often a dominant factor affecting the values of pension funds, banks and many other financial intermediaries.
The document discusses three common myths about investing: 1) that bonds are always safe and investors cannot lose money, 2) that interest rates cannot stay low for long so investors should wait in cash, and 3) that volatility in equities is always bad. It argues that bonds face price risk, interest rates could remain low for many years, and short-term volatility in stocks presents opportunities for long-term investors to buy at lower prices. The commentary was used to explain investment decisions made in the DIAS Conservative Income portfolio in light of recent market declines.
Options on the VIX and Mean Reversion in Implied Volatility Skews RYAN RENICKER
Actionable trade ideas for stock market investors and traders seeking alpha by overlaying their portfolios with options, other derivatives, ETFs, and disciplined and applied Game Theory for hedge fund managers and other active fund managers worldwide. Ryan Renicker, CFA
This document discusses several economic indicators and their relationship to stock market performance:
- Margin debt levels and changes in speculative behavior can indicate market sentiment and impending tops.
- Secondary stock offerings usually have a bearish effect by increasing supply and signaling insider liquidation.
- Household liquidity declines in the 1990s contributed to rising consumer debt and stock market weakness later.
- Money supply expansions have historically coincided with economic and stock market growth.
- Bank loan growth above 13% may signal an overheated economy while below 5.5% indicates a healthier environment.
- Short and long-term interest rates often move inversely to stock prices, though relationships broke down during
Counterparty Risk in the Over-The-Counter Derivatives MarketNikhil Gangadhar
This paper discusses counterparty risk that may stem from the over-the-counter (OTC) derivatives market in the wake of the 2008 financial crisis. The paper aims to assess potential losses to the financial system if one or more major banks or brokers default on their OTC derivative contracts. To estimate counterparty risk, the paper calculates potential losses under different scenarios, taking into account the exposure of the financial system to institutions and the probability that other institutions may also default if a major counterparty fails. The results are discussed in the context of ensuring banking system stability.
The S&P 500 finished 2018 in negative territory for the first time since 2008, down -4.6% for the year. Volatility increased significantly across global markets as economic growth moderated and trade tensions rose. The CBOE Volatility Index increased 130% in 2018 compared to 78% in 2008, indicating a more turbulent decline. Investor unease over trade and monetary policy contributed to the rise in volatility, exemplified by an 8% market fall following the Federal Reserve's signal of slightly more aggressive rate hikes than expected in 2019.
Compared to equities, bonds at first glance can appear like a throwback to your grandparent's days, but this month we take a look at how bonds may help mitigate risk, and the role they play in a well-diversified portfolio.
This document summarizes lessons from the Great Recession regarding bonds and portfolio rebalancing:
1) Don't take unnecessary risks with bonds. Many investors took on more credit risk without understanding bonds fully and suffered losses. It's best to stick to high-quality, short-term bonds to reduce overall portfolio volatility.
2) Rebalance portfolios regularly. Markets move assets classes over time, shifting the original risk allocation. Rebalancing ensures the portfolio stays aligned with the investor's goals and risk tolerance.
3) Not rebalancing allows portfolios to take on more risk over time. One example showed a portfolio drifting from 50% stocks/50% bonds to 67%/33% over 20 years due
The document provides a recap and analysis of macroeconomic factors and their impact on the economy and financial markets from 2007 to 2009. It summarizes warnings in 2007 about the credit crisis, including rising lending standards, dependence on credit growth, and the bursting of the credit bubble. It describes shocks to the financial system in August 2007 and the Federal Reserve's response. While the stock market rallied on rate cuts, the document warns that the full economic impact was still unknown and that home prices and the economy remained at risk.
Private Asset Management Feb 2013 Inflation HedgingBrian Hahn
The document discusses how increasing inflation could impact investment portfolios and recommends that investors consider allocating to asset classes that can hedge against inflation, such as Treasury Inflation Protected Securities, floating rate bank loans, commodities, and certain stocks in industries like energy, materials, and industrials that tend to perform well during inflationary periods. It also notes that flexible bond management and adjusting bond portfolio durations can help mitigate the effects of rising interest rates that often accompany inflation.
Pam Article 2013 inflation and your portfolioBrian Hahn
The document discusses how increasing inflation could impact investment portfolios and recommends that investors consider allocating to asset classes that can provide protection against inflation, such as Treasury Inflation Protected Securities, floating rate bank loans, commodities, and certain stocks in sectors like energy, materials, and industrials that tend to perform well during periods of higher inflation. It also notes that flexible bond management strategies can help reduce interest rate risk for bond portfolios in an inflationary environment.
ASSIGNMENT 3
g
[Name of the Student]
[Name of the University]
Running Head: ASSIGNMENT 1
General Essay Questions (5pts each)
1. What are TIPs? How do these securities provide a hedge against inflation? Discuss the spread between traditionally-structured Treasury notes and TIPs. What factors influence this spread relationship?
TIPs are the Treasury Inflation Protected securities. These are the bonds issued by the government that offer return after the inflation which is also known as a real return. they are different from the nominal or traditional bonds in which the returns are specifically before inflation. This is the way for the investors for offsetting the risk that comes with the inflation. These TIPs offer the hedge against inflation by providing a return which is calculated after taking out the risk of inflation. This is the best way for investors to offset the risk that comes due to the inflation in society. With the strengthening of the economy, inflation can increase, and the return is not expected to increase in the high rate of inflation, so for affording protection against inflation in the economy, TIPs are used in the form of fixed income investment for the destruction of inflation. TIPs are backed by the government and they offer high attractiveness for the investors because the level of risk in these securities is less.
TIP spread is when the yield of TIPS and other US Treasury securities is compared having the same date for the maturity. The difference that exists between both of them is used as payment adjustment for the inflation. The traditionally structured treasury notes do not consider inflation at the start and the yield is used for compensating the investors for the expected future rate of inflation. This spread between both securities is the indication for the market about inflation. The most important factor in influencing the spread relation is inflation because this spread is basically dependent on the inflation rate change. The spread is basically the projection for the inflation and it cannot be predicted how it will change in the future. Comprehensively, the TIP spread is considered to be a reliable measure for predicting the appropriate level of inflation.
2. Fully describe the fixed-income instruments of the money and capital markets. Make sure you cover all the money and bond markets we discussed. Do not just list the instruments.
Among financial markets, there are two most commonly used concepts, one is a capital market and the other one is the money market. The money market is used by the corporate entities and government for lending and borrowing money for a short term. In contrast, capital market contains long term assets with having the maturity of more than a year. In the capital market, the bonds and stock options are available. The securities in the capital market which offer a fixed rate of return are called as fixed - rate capital securities and a combination of features for the comm.
ASSIGNMENT 4
g
[Name of the Student]
[Name of the University]
Running Head: ASSIGNMENT 1
General Essay Questions (5pts each)
1. What are TIPs? How do these securities provide a hedge against inflation? Discuss the spread between traditionally-structured Treasury notes and TIPs. What factors influence this spread relationship?
TIPs are the Treasury Inflation Protected securities. These are the bonds issued by the government that offer return after the inflation which is also known as a real return. they are different from the nominal or traditional bonds in which the returns are specifically before inflation. This is the way for the investors for offsetting the risk that comes with the inflation. These TIPs offer the hedge against inflation by providing a return which is calculated after taking out the risk of inflation. This is the best way for investors to offset the risk that comes due to the inflation in society. With the strengthening of the economy, inflation can increase, and the return is not expected to increase in the high rate of inflation, so for affording protection against inflation in the economy, TIPs are used in the form of fixed income investment for the destruction of inflation. TIPs are backed by the government and they offer high attractiveness for the investors because the level of risk in these securities is less.
TIP spread is when the yield of TIPS and other US Treasury securities is compared having the same date for the maturity. The difference that exists between both of them is used as payment adjustment for the inflation. The traditionally structured treasury notes do not consider inflation at the start and the yield is used for compensating the investors for the expected future rate of inflation. This spread between both securities is the indication for the market about inflation. The most important factor in influencing the spread relation is inflation because this spread is basically dependent on the inflation rate change. The spread is basically the projection for the inflation and it cannot be predicted how it will change in the future. Comprehensively, the TIP spread is considered to be a reliable measure for predicting the appropriate level of inflation.
2. Fully describe the fixed-income instruments of the money and capital markets. Make sure you cover all the money and bond markets we discussed. Do not just list the instruments.
Among financial markets, there are two most commonly used concepts, one is a capital market and the other one is the money market. The money market is used by the corporate entities and government for lending and borrowing money for a short term. In contrast, capital market contains long term assets with having the maturity of more than a year. In the capital market, the bonds and stock options are available. The securities in the capital market which offer a fixed rate of return are called as fixed - rate capital securities and a combination of features for the comm.
- The document discusses teaching students about market volatility through activities that define volatility, research indicators of volatile markets, and explore investment strategies.
- Volatility refers to how much and how quickly the value of investments change. High volatility means dramatic price changes over short periods, while low volatility means steady price changes over longer periods.
- The activities examine market volatility through graphs of market indexes like the Dow Jones Industrial Average and S&P 500, analyzing their performance during volatile periods like 2008-2009 to understand how investors are affected.
This document provides background information and instructions for a lesson plan on market volatility. The lesson is intended for high school students and involves multiple activities to help students understand and analyze volatility. Key points covered include defining volatility, exploring indicators of volatile markets, ways to invest during volatility, and how economic news and market indexes can impact volatility. Students will interpret graphs of market indexes, analyze individual stocks, and examine how headlines can influence investor confidence and market movement.
This document discusses various financial risk concepts and instruments. It defines value at risk as a technique to measure financial risk over a time period. It also discusses credit value adjustment, liquidity risk, market risk, different types of financial instruments including money market funds, commercial paper, certificates of deposit, treasury bills, derivatives, yield curves, counterparty risk, and Basel regulations. It provides definitions and examples of these terms.
This document provides an overview of investments and financial markets. It discusses key concepts like financial intermediation, different types of financial markets and securities, interest rates, and the relationship between risk and return. The purpose of the financial system is to connect individuals and entities with surplus funds to those that need funds. Financial intermediaries like banks facilitate the flow of funds between these groups.
The portfolio manager discusses the Third Avenue Focused Credit Fund. They reiterate their commitment to maximizing value in the portfolio and returning capital to shareholders in a timely manner. Eight of the top ten holdings have restructured in the past two years, reducing debt levels. The manager believes the portfolio contains significant embedded value that will be realized as market conditions normalize and corporate events occur. They intend to provide transparency to shareholders through monthly fact sheets and quarterly commentary on the fund's website. The manager also discusses recent volatility in the high yield and distressed debt markets, noting that credit spreads spiked in 2015 but it is unclear if this will lead to recession or opportunity.
1. Project: VIX index
and CDS spread
National Economics University
Advanced Finance Program intake 50
2011
9/12/2011
Group students:
Nguyễn Thị Thu Hà
Nguyễn Thị Ngọc Hà
Phạm Quang Huy
Quản Thị Hạnh Mai
2. I. Definitions
1. Credit default swap (CDS)
a. Definition:
A credit default swap (CDS) is
a credit derivative contract
between two counterparties. It is
quite similar to a
traditional insurance policy due to
the fact that it obliges the seller of
the CDS to compensate the buyer
in the event of loan default. In
general, this involves an exchange
or "swap" of the defaulted loan
instrument (and with it the right to recover the default loan at some later time) for immediate
money - usually the face value of the loan.
There are two parties taking part in swap agreement. First of all, protection buyers
purchase insurance against the event of default. Then, he agrees with protection sellers to
pay a premium. As a result, in the event of default, the protection seller has to compensate the
protection buyer for the loss.
In CDS, the buyer makes regular premium payments to the seller, the premium
amounts constituting the "spread" charged by the seller to insure against a credit event.
CDS spread = Premium paid by protection buyer to the seller
The premium (spread) is determined by market forces and depends on the expected
default risk of debt issuers. Therefore, CDS spreads are an indicator of the market's current
perception of sovereign risk when the debt issuers are the Governments. Moreover, CDS
spreads also depend on other factors such as market liquidity, counterparty risk and the global
financial environment, in particular country’s interest rates and global risk appetite.
CDS spreads is usually quoted in basis points per annum of the contract’s notional
amount and is paid quarterly. For example, A CDS spread of 339 bps for five-year debt
3. means that default insurance for a notional amount of $1 million costs $ 33,900 per annum;
this premium is paid quarterly (or $ 8,475 per quarter).
Features
There is negative correlation between a company stock price and its CDS spreads. If
the outlook for a company improves and its share price should go up then its CDS spread
should tighten. It can be explained that the company has less probability to default so the
CDS will decline. On the other hand, if company or market’s outlook deteriorates then CDS
spread should widen and its stock price will decline to reflect the bad situation. Thus, it can
be said that the worse the credit rating, the higher the CDS spread. Nevertheless, there is still
a special situation in which the inverse correlation between a company's stock price and CDS
spread breaks down. This is when the companies apply Leveraged buyout (LBO). Frequently
this leads to the company's CDS spread widening due to the extra debt. But at the same time,
the share price increases, since buyers of a company usually end up paying a premium.
How do CDS spreads relate to the probability of default? The simple case
For simplicity, consider a 1-year CDS contract and assume that the total premium is
paid up front.
Let S: CDS spread (premium), p: default probability, R: recovery rate
When two parties enter a CDS trade, S is set so that the value of the swap transaction is zero,
i.e.
S= (1-R) p
S/ (1-R) =p
Example: If the recovery rate is 40%, a spread of 200 bps would translate into an implied
probability of default of 3.3%.
So a spread of 200 basis points is equivalent to the notion that the market is pricing in an
annual chance of about 3% that the issuing government will default.
4. 2. VIX
In 1993, the first VIX, introduced by Prof. Robert Whaley at Vanderbilt
University, was a weighted measure of the implied volatility of eight S&P 100 at-the-money
put and call options. Ten years later, it expanded to use options based on a broader index, the
S&P 500, which allows for a more accurate view of investors' expectations on future market
volatility.
By definition, VIX is the ticker symbol for the Chicago Board Options Exchange
Market Volatility Index, a popular measure of the implied volatility of S&P 500 index
options. The index is calculated using the price of near-term options on S&P 500 index.
Because the value of an option is closely linked to the expected volatility of its underlying
security, options prices can be a useful indicator of investors' expectations of volatility. Thus,
people might call VIX as the "fear index" because a high VIX represents uncertainty about
future prices (over next 30 days period).
The VIX is quoted in percentage points and translates, roughly, to the expected
movement in the S&P 500 index over the next 30-day period, which is then annualized.
Given an example, if the VIX is 15 means an expected annualized change of 15% over the
next 30 days, it then can implies that the index option markets expect the S&P 500 to move
up or down (1.15%)1 / 12 = 1.17% over the next 30-day period.
By taking the weighted average of implied volatility for the Standard and Poor's
Index, this index can point out number of critical things to investor looking at the near future
market.
-A low VIX indicates trader’s confidence with low volatility of market.
-A high VIX indicates indicate that investors expect the value of the S&P 500 to fluctuate
wildly - up, down, or both - in the next 30 days.
In practice, VIX which is greater than 30 are generally implies a large amount
of volatility as a result of investor fear or uncertainty, while value below 20
generally corresponds to less stressful period in the markets.
5. III. VIX in reality
*Sources: Bloomberg and CBOE.
The Volatility Index (VIX) is a key measure of market expectations of near-term
volatility conveyed by S&P 500 stock index option prices. VIX reflect investors' consensus
view of future expected stock market volatility, so during periods of financial stress, which
are often accompanied by steep market declines, VIX tends to rise. As investor fear subsides,
option prices tend to decline, which in turn causes VIX to decline. As you can see the chart
above is the VIX and S&P 500 Indexes in 9 years, from January 2003 to June 2011. It is very
obvious to see in the chart that the VIX index line and the SPX always move in two opposite
direction. In period 2003 to the first half of 2007, the VIX index was around more than 10
and below 20 and fluctuated slightly. It did not suddenly plunge or go up. In these 5 years,
the VIX tended to go down gradually. Corresponding with the VIX, the S&P 500 index had
upward trend since, but also gradually. In general, the economic conditions in 2003- 2007
was quite stable. However, from July 2007, the VIX index started going up, from 12 in May
0
200
400
600
800
1000
1200
1400
1600
1800
0
10
20
30
40
50
60
70
80
90
S&P500INDEX(SPX)
VIXINDEXDailyclosingprices
VIX and S&P 500 Indexes
(January 2003 - June 2011*)
SPX
VIX
6. 2007 to 25 in July 2007, increased more than 100% in just 2 months. It indicated that
investors’ fear about the stock market was growing up because of something. It continued to
vary in 20 to 30 in next 10 months and suddenly went up twice in August 2008. The fear of
investors was growing up since the market turmoil at that time. The SPX also plunged as the
investor pessimistic about the market. So what had a big affect to investors? I will show you
more clearly by look at the chart in the period 2008-2010.
*Sources: Bloomberg and CBOE.
In 2008 the whole world faced with financial crisis. The crisis was so severe, and the
world financial system was affected. The global financial crisis, brewing for a while, really
started to show its effects in the middle of 2007 and into 2008. Around the world stock
markets have fallen, large financial institutions have collapsed or been bought out, and
0
200
400
600
800
1000
1200
1400
1600
1800
0
10
20
30
40
50
60
70
80
90
2-Jul-2007
2-Sep-2007
2-Nov-2007
2-Jan-2008
2-Mar-2008
2-May-…
2-Jul-2008
2-Sep-2008
2-Nov-2008
2-Jan-2009
2-Mar-2009
2-May-…
2-Jul-2009
2-Sep-2009
2-Nov-2009
2-Jan-2010
2-Mar-2010
2-May-…
2-Jul-2010
2-Sep-2010
2-Nov-2010
2-Jan-2011
2-Mar-2011
2-May-…
S&P500INDEX(SPX)
VIXINDEXDailyClosingprices
VIX and S&P 500 Indexes
(July 2007 - June 2011) *
SPX
VIX
7. governments in even the wealthiest nations have had to come up with rescue packages to bail
out their financial systems. Because American financial firms followed the Subprime
Mortgage loan which allowed the consumers could borrow money even with substandard
credit rating. It created the housing bubble crisis, and became the global financial crisis. Both
investors and mortgage companies were in trouble. On the 14th September 2008, it came to
light that the financial services firm, Lehman Brothers, would file for bankruptcy after being
denied support by the Federal Reserve Bank. Later the same day, the Bank of America
announced that it would be purchasing Merrill Lynch. On the 16th September, the American
International Group (AIG) suffered due to its credit rating being reduced. Over the next two
weeks, more banks failed and the two remaining banks-Goldman Sachs and Morgan Stanley
converted into 'bank holding companies' so that they had more access to market liquidity.
Due to the above factors, there was major instability on the global stock markets with
major decreases in market value between the 15th and 17th of September 2008. In 17th
September, the VIX index closed at 36.22, increasing more than 6 with 16th
.
In October 2008, the S&P 500 index fell from around nearly 1200 in September to hit
848.92, the lowest in the first 10 months of 2008. At the same time, the VIX also increased
rapidly to 80.06, the highest record until October 2008.
The situation was even worst in November when in 20th
Nov, the SPX index dropped
to 752.44, the lowest in 2008; and the VIX hit the record of 80.86, the highest number in 16
years (from 1995 to 2010) (VIX has 21 years of history).
The double tops in the VIX index in 2 months showed a very obvious message:
investors were losing their confidence about the future of economy. Investors were afraid of
the high volatility of market, not only in U.S but in all over the world. Numerous plans were
put forward with intent to solve the crisis and in the end President George W. Bush and the
Secretary of the Treasury announced a $700 billion financial aid package intended to limit the
damage that the previous few week's events caused. The plan was received well by investors
on Wall Street and around the world. Government gave some simulation packages to improve
the situation, along with other solutions, the stock market recovered in around June 2009. The
VIX index also decreased and became more stable.
Although we only show the VIX index until June 2011, but after that, especially from
August 2011, the debt crisis in U.S and Euro zone emerged which made the big affect to
expectation of investors. The problems that have weighed on investors - The European debt
8. and fear of a new recession in the United States, in addition the under-expected reports about
unemployment, economic growth, hammered the stock market. Traders fear that one of the
continent's heavily indebted economies could default, an event that would ripple through the
global banking system and make it difficult for other European countries to borrow money.
Moreover, the U.S. economic growth is already slowing, and unemployment is stuck above 9
percent. In 9 September 2011, the Standard & Poor's 500 closed down 32, or 2.7 percent, at
1,154. The VIX closed up 4.2 at 38.52 in 9 September. 1
IV. Credit Default Swap Spread
Market as of 2007
1
Source: finance.yahoo.com
Cboe.com
Bloomberg.com
Chart1: CDS index in 5 years
9. - After U.S. house sales prices peaked in mid-2006 and began their steep decline forthwith,
refinancing became more difficult. As adjustable-rate mortgages began to reset at higher
interest rates, mortgage delinquencies soared, and securities backed with mortgages lost
most of their value. Concerns about the soundness of U.S. credit and financial markets led
to tightening credit around the world and slowing economic growth in the U.S. and
Europe. Initial subprime concerns appeared made CDS spread began its trend of
increasing.
- In the second half of 2007, Bear Stearns, a global investment bank and securities trading
and brokerage experienced difficulties. The most significant outcome was the record of
61 percent drop in net profits due to their hedge fund losses reported on September 21 in
New York Time note. CDS spread was widen during the last quarter of 2007.
- Fed's dramatic action that lowered rates by 50 bps cheered investors, which CDS spread
declined in August and September. However, from the beginning of October, the news
that U.S brokers reported huge losses and write downs, plus the failure of Bear Stearns,
stimulated the growth of CDS spread.
Market as of 2008
- In March 2008, Bear Stearns went to debacle and eventually led to its forced sale to JP
Morgan. In the days and weeks leading up to Bear’s collapse, the bank’s CDS spread
widened dramatically, indicating a surge of buyer talking out protection on the bank.
- During the middle of 2008, the fears concerning about Lehman, Fannie/Freddie and
monoclines (such as MBIA, Ambac) downgrade continuously raised the spread of CDS.
- On September 7, 2008, the Federal Housing Finance Agency (FHFA) announced that
Fannie Mae and Freddie Mac were being placed into its conservatorship.
- In September 2008, the bankruptcy of Lehman Brothers caused a drastically fluctuation
of CDS spread.
- Also in September, American International Group AIG required a federal bailout because
it had been excessively selling CDS protection without hedging against the possibility
that the reference entities might decline in value, which exposed the insurance giant to
potential losses over $100 billion.
- Lehman Brother auction settled the CDS smoothly.
- In November, DTCC announced that it would release market data on the outstanding
notional of CDS trades on weekly basic, and Intercontinental Exchange was granted to
begin guaranteeing credit default swaps.
10. Market as of 2010
- Stable due to recover of economy, improvement of investor expectation
- Some fluctuate and still high due to high deficit level of US government budget
Market as of 2011
- Still high due to Government deficit of Greece, Portugal, and many other countries in
Euro zone and US.
- Lower credit rating for US
V. Correlation and interpretation for VIX index and CDS spread
First of foremost, we will draw the route that our group will go through. To get the
ball rolling, we start by showing the correlation between VIX index and CDS spread in the
short term. Then we will pick up some key events over 6 years from 2007 to 2011, and
finally, we will show everything in long term and draw our conclusion about this relationship.
For all charts we present here, the VIX is the green line and the CDS spread is the orange
one.2
And here is the first technical analysis figure for the most recently 6 months from Apr
to Sep, 2011:
2
All charts were taken snapshot on Bloomberg.com
Chart2: VIX & US. Bank CDS for 6 months Apr – Sep 2011
11. As you can see via the chart, both VIX and CDS are moving quite similar to each
other over 6 months. The trend is fluctuating consistently between the two from Apr to at the
end of July. Significantly, we should focus on the 2 circle in the chart as we marked. As
looked at the violet circle, both VIX and CDS were raised incredibly, almost double
compared to four previous months (approximately 100 points). Indeed, this peak point was on
5 Aug, 2011, this day was considered as the first day in history the US was lowered down
credit rating by S&P. This news impacted a lot on investors and the economy as a whole, not
only US but also any countries which hold the US Government bonds. The VIX was high
also means that other basic indices decreased. That’s true when the DJIA, S&P500,
NASDAQ and other indices in Europe and Asia were so low the past few days. At the same
time, the CDS spread soared from 16.7 to 77.2 points.
The same story is for the second circle, the blue one. At the beginning of Sep, it was
time for US announced its unemployment report. In fact, the unemployment rate keeps level
up from the beginning of 2011 until now, about 9.1% recently. The bad news one more time
affected the market that forced president Obama had to take action. He also announced his
proposal 447 billion USD to create job and social stability. To react to the news, both VIX
and CDS spread immediately responded by the dropping more than 50 points for VIX and 20
points for CDS. As here we also disclose the relationship between the two in one year.
3/29/11 S&P kept
lowering the credit rating
of Greece & Portugal
Chart3: VIX & US. Bank CDS in one year
12. Take a glance over one year, the two indices move closely to each other, except for
the brown circle, the time when S&P lowered credit rating of both Greece (BB-) and Portugal
(BBB-).
Lastly, we will look at the whole picture over 6 years from 2007 to 2011 in order to
draw key conclusion:
In long term, we can see the whole picture it’s the different story compared to the
short run as we concerned above. We can pay attention to the divergence between the two is
bigger and bigger especially after the global financial crisis 2008 – 2009. At this time, the
CDS spread fluctuated significantly due to the bubble of subprime mortgage was burst and it
created the domino effect that spread all over the world. That formed two CDS’s peaks in
these years and also led the VIX soared drastically. Due to the wide gap amongst them, it also
implicates the instability of the economics especially when the confidence of investors is
eroded and the economics is facing with a lot of obstacles such as outstanding public debts,
the unemployment and inflation and so on.
In short, we can draw conclusion that both VIX and CDS could be considered as one
of useful toolkits to forecast the financial crisis, especially via the crisis 2008 – 2009 and the
Chart4: VIX & US. Bank CDS in 5 years
13. national debts issue, the two shows us something in expectation toward the market and near
future. Or in other word, we can say about the relation amongst them is positive correlation.
Even no one what will happen to the market and no unique tool is perfect for forecasting, we
just use VIX and CDS like a referent ones before making any final conclusion.