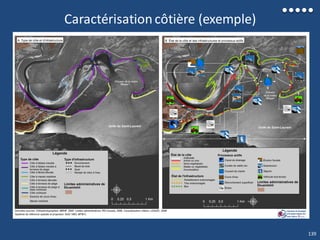
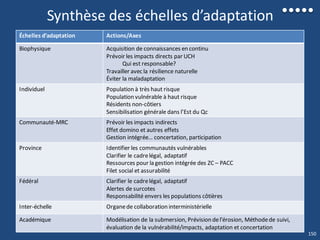
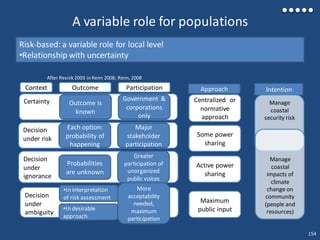
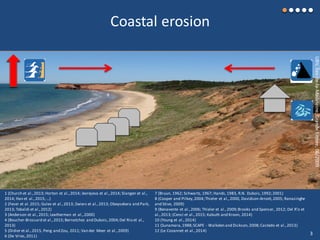
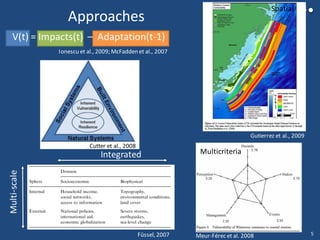
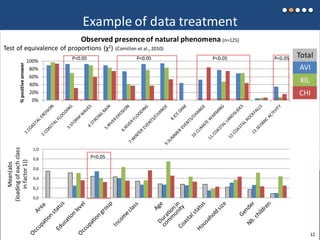
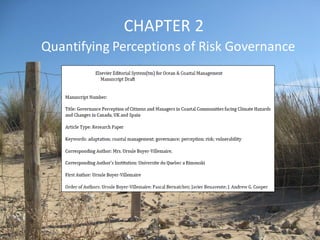
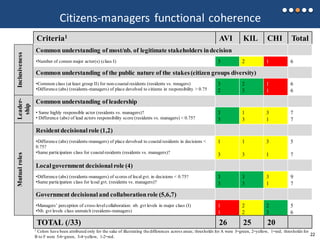
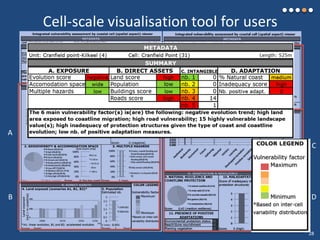
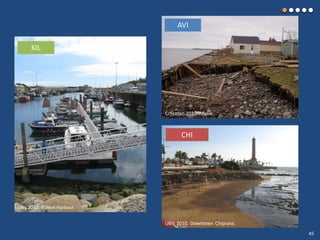
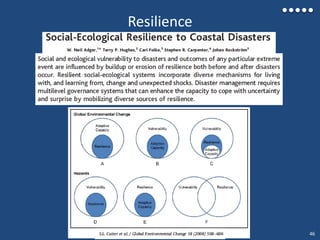
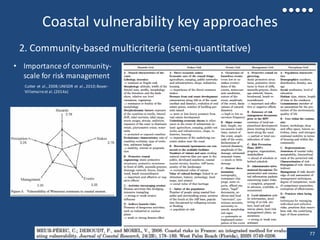
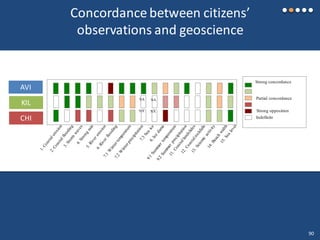
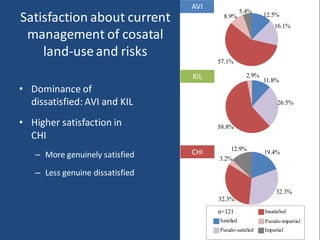
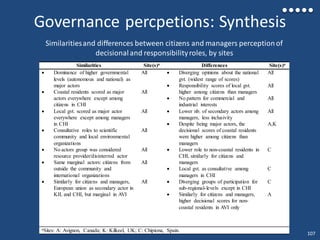
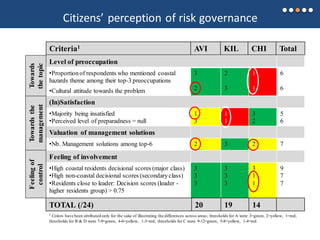
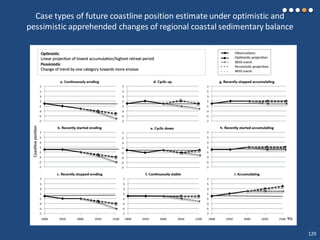
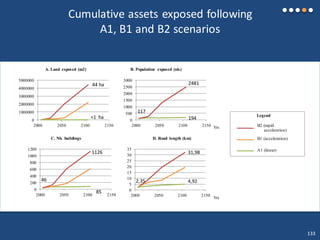
1. The document presents the results of a study that assessed risk awareness and perceptions of risk governance in three coastal communities: Avignon, Canada; Kilkeel, UK; and Chipiona, Spain.
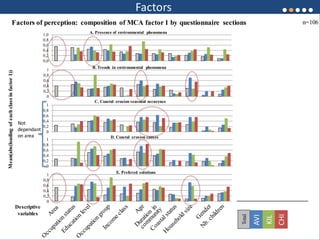
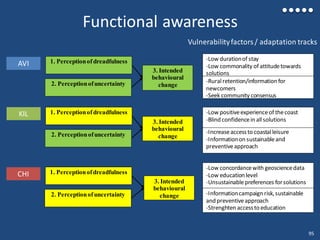
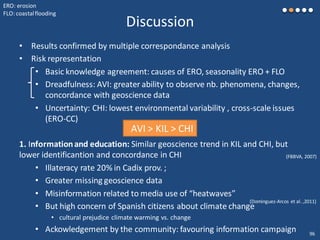
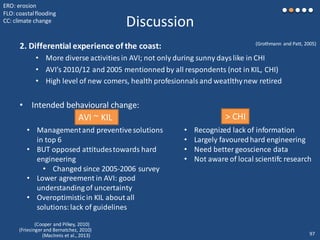
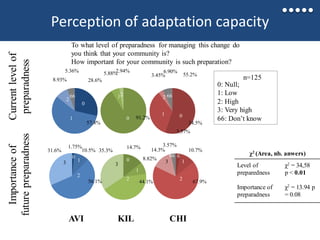
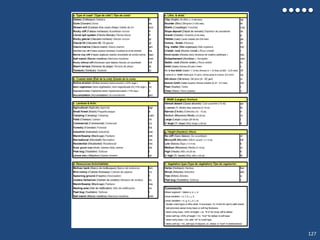
2. To quantify risk awareness, the author examined perceptions of dreadfulness, uncertainty, and intended behavioral change. Functional awareness was highest in Avignon and lowest in Chipiona, likely due to differences in education levels and access to information across communities.
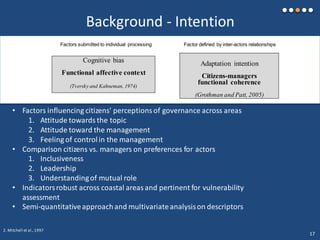
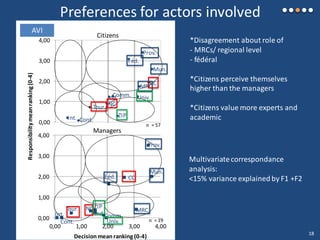
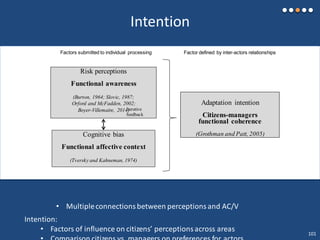
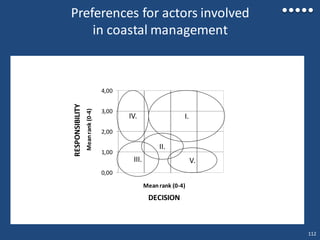
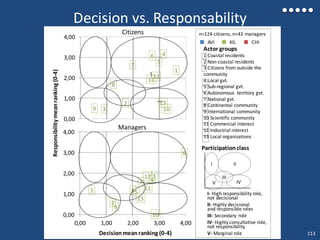
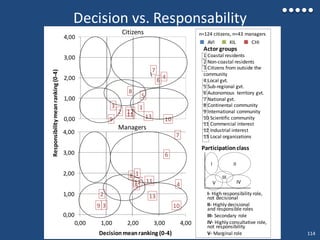
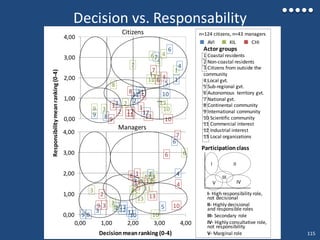
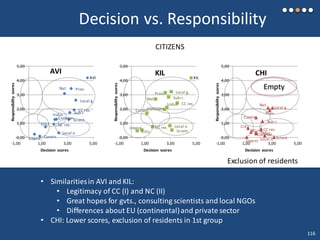
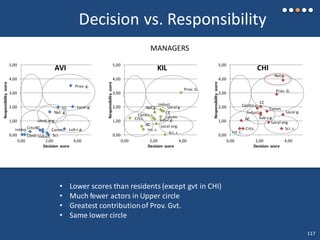
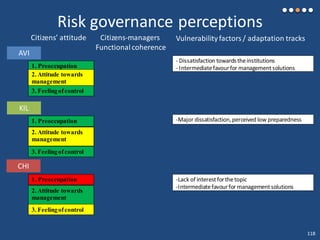
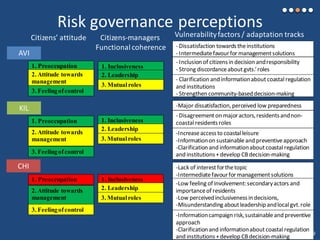
3. When quantifying perceptions of risk governance, the author compared citizens' and managers' preferences for decision-making actors and roles. Coherence between citizens and managers was highest in Avignon and lowest in Chipiona. Differences included perceptions of appropriate government levels of

![Vulnerability to coastal hazards
"The characteristics and circumstancesof a
community, system or asset that make it susceptible to
the damaging effects of a hazard […] arising from
various physical, social, economic, and environmental
factors"
UN International Strategy for Disaster Reduction (UNISDR, 2009)
(IPCC CZCS, 1992; UNISDR et al., 2010)
(ADEME, 2013; MDDELCC, 2015)
• Prescribed by UNISDR, IPCC and governments
4](https://image.slidesharecdn.com/d975a07f-0ed2-4183-bd8b-e270efa14881-160309194544/85/UBV_soutenance_v5-4-320.jpg)
![Main Literature Gaps
1. A "just" use of vulnerability assessment with erosion
• predictive + inductive; internal vs. external
2. Adaptation structures : adequacy and maladaptation
3. Risk perceptions
4. Risk governance perceptions in a CC context
5. Institutional context as a factor of vulnerability
6. Intangible landscape values
1. Hinkel,2013
2. Bernatchez et al.,2011; Cooper and Pilkey,(2012)
3. Meur-Férec et al,2008;Orford and McFadden, 2002
4. Lemieux et al.,2013
5. Meur-Férec et al,2008;Armitage et al.,2009; Billé,2006;Watts and Bohle, 1993
6. Tunstall and Tapsell,2007;Brown and Reed, 2009
7. Cutter et al,2008 ; Van Alstet al,2008
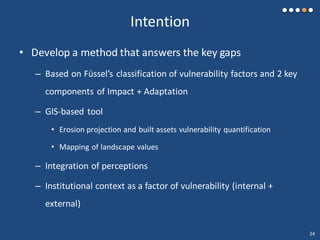
7. Operationalization challenge
General objective:Develop a diagnosis method based on factors of
vulnerability to improve the integration of [the 6 previous components]into
coastal vulnerability assessements
•Just (scientific validity)
•Operational
6](https://image.slidesharecdn.com/d975a07f-0ed2-4183-bd8b-e270efa14881-160309194544/85/UBV_soutenance_v5-6-320.jpg)
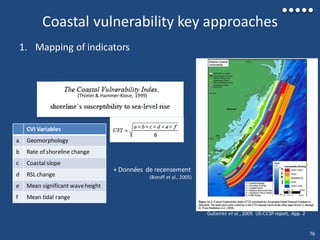
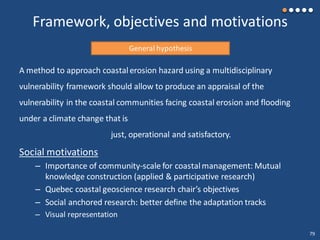
![•Climate grading
•Similarities: gemorphology, erosion
and submersion hazards, meso-tidal
•Similarities: socio-economical
Approach: Comparisonof small communities
aroundNorth Atlantic
Avignon (Carleton-Maria), Baie des
Chaleurs, Québec, Canada
Cold maritimetemperate
AVI
Kilkeel,Co. Newry & Mourne,
Irlandedu Nord (UK)
Maritime temperate
KIL
Chipiona,Cádiz, Spain
Oceanic mediterranean
CHI
AVI: Bernatchez et al.,2012a.Bernatchez et al.,2011;Gehrels et al.,2004; Koohzare et al.,
2006; Koohzare et al.,2008) + Han et al.,(2014); James et al.(2015)
KIL: Orford and McFadden, 2002; Woodworth et al,2009b
CHI: Del Rio et al.,2013; Dominguez et al.,2004;Gomez-Pina et al.,2012; Del Rio et al.,
2012; Marcos et al.,2011
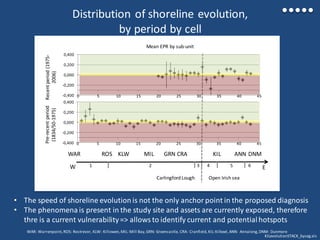
AVI KIL CHI
Erosion rate -0.3 to 0 m/yr -0.1 to 0.5 m/yr -3 to -0.75 m/yr
Events
Erosion/Flood
Dec. 2010
[Erosion; Flood]
Feb. 2002
[Flood]
Wint. 2009-10
[Flood]
Sea level
(period)
+1.09 mm/yr
(1964-2003)
Stable
(20th century)
+0.1 mm/yr
(1880-2009)
77](https://image.slidesharecdn.com/d975a07f-0ed2-4183-bd8b-e270efa14881-160309194544/85/UBV_soutenance_v5-7-320.jpg)

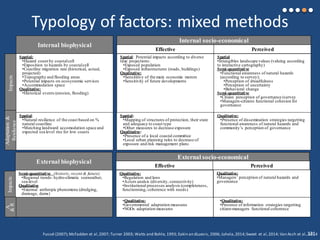
![Internal biophysical
External biophysical
Internal socio-economical
Impacts
Adaptation&
Reislience
Effective Perceived
ImpactsA
&R
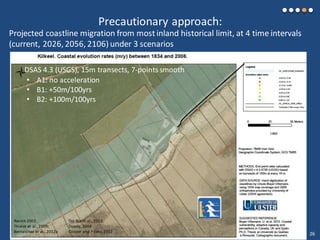
Synthesis for Kilkeel
No monitoring of erosion, no cliff
management strategy
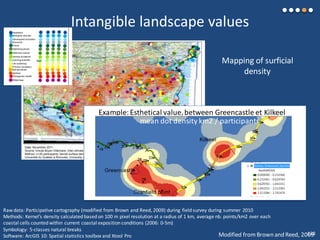
Cranfield Bay and Point hotspot:
• Highly exposed location (-0.15 m/y)
• Sensitive TC
• High level of assets concerned
• Key hotspots of intangible landscape
values: esthetical, recreational and
economic
• Weak accomodation space
• Weak natural coastline
Other vulnerable population nucleus
Power station
Land: <1 [1-44] ha
Population: >100 [200-2500]
Buildings: 46 [86-1126] power station,
sewage station
Roads: 2.5 [5-32] km of road
Key touristic attraction, esthetical values
No public participation mechanism
Cultural tensions
Clear regional trend towards hazard
intensification
Diversity of perceived landscape values
Low positive experience of the coast
Blind confidence in all solutions
Major dissatisfaction, perceived low
preparedness
Disagreement on major actors, residents
and non-coastal residents roles
No dissemination strategy from local
authorities
Wetland protection status
Low adequacy of protection structures
No soft engineering
No erosion in local planning
Active Mourne Heritage Trust
Local environmental leader
Narrow inclusiveness and disciplinary
efforts, but leadership of DoENI
No monitoring program, no erosion maps
Absence of civil-security actors
Promising coastal forum
Effective flood hazard management
Expected coastal law
No dissemination strategy from central
authorities
Low perception of risk and vulnerability
from managers
Low perceived performance
Distance bias from managers (planning)
Low inclusiveness from managers
Effective Perceived
External socio-economical
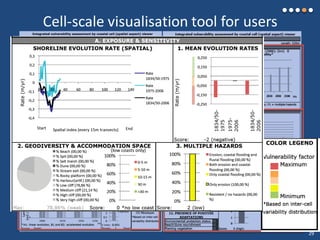
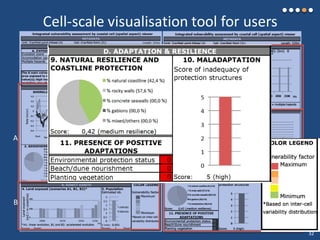
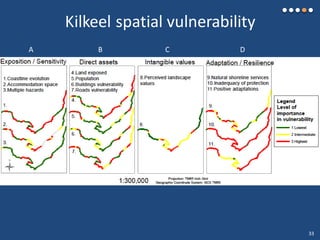
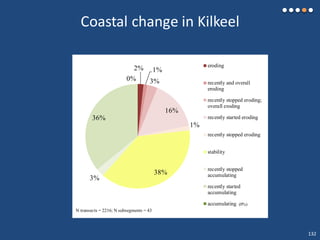
Kilkeel’s vulnerability diagnosis: after 4 decades of silence 36](https://image.slidesharecdn.com/d975a07f-0ed2-4183-bd8b-e270efa14881-160309194544/85/UBV_soutenance_v5-36-320.jpg)


![Impacts directs: augmentation des risques naturels
• Érosion: 60%
- événements >10m
• Submersion: 43%
- difficulté de
prédiction
- interaction:érosion
• Facteur humain:
- Structures de
protection inadéquates
- Absence d’unités
côtières de gestion
(permis, cadastre)
Impacts indirects: augmentation de la vulnérabilité
Comment évaluer la vulnérabilité au Québec?
69%
-0,30 m/an
63%
-0,63 m/an
65%
-0,73 m/an35%
-1,17 m/an
32%
-0,39 m/an
-0,48 m/an
Légende
Côte active en 2006
- %
- [m/an]
Côtes totales suivies: 3570km
Avignon (Carleton-Maria)
54](https://image.slidesharecdn.com/d975a07f-0ed2-4183-bd8b-e270efa14881-160309194544/85/UBV_soutenance_v5-54-320.jpg)
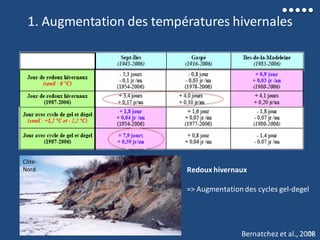
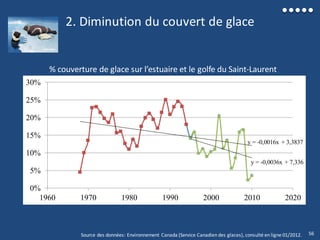
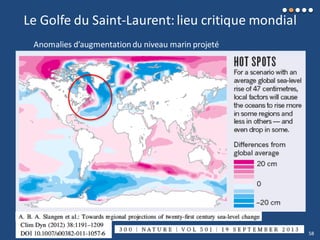
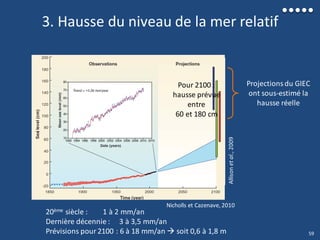
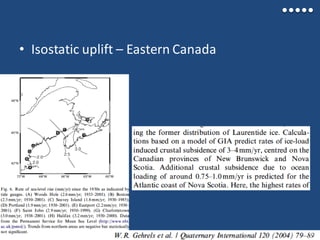
![3. Hausse du niveau de la mer relatif
Koohzare et al., 2010
Niveau marin relatif (NMR) = Isostatisme(I) + Eustatisme(E)
Mouvement isostatiqueverticaldans l’Est
du Canada(mm/an)
Sept-Îles:
I = -1,3 mm/an (rebond)
E = +0,19 mm/an (subsidence)
NMR = -1,11 mm/an (émersion)
Projection 2100: E = [6-18] mm/an
Hausse NMR= + [4,7-16,7] mm/an
Belledune:
I = [2-3] mm/an (submersion)
E = +1,09 mm/an (subsidence)
NMR = +[3,09-4,09] mm/an (subsidence)
Projection 2100: E = [6-18] mm/an
Hausse NMR= + [19,09-22,09] mm/an
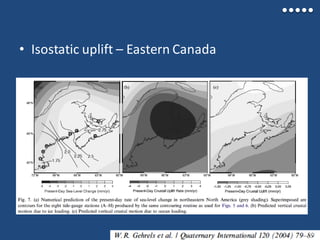
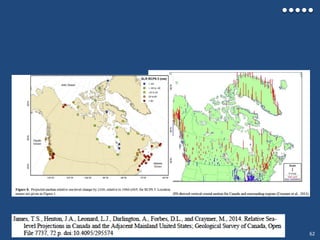
Bernatchez et al., 2008 57](https://image.slidesharecdn.com/d975a07f-0ed2-4183-bd8b-e270efa14881-160309194544/85/UBV_soutenance_v5-57-320.jpg)
![Vulnerability to coastal hazards
How to maintain the quality of life of communities
despite coastal landscape modification?
"The characteristicsand circumstancesof a community, system or asset
that make it susceptible to the damaging effects of a hazard […] arising from
various physical,social, economic, and environmentalfactors"
UN International Strategy for Disaster Reduction(UNISDR, 2009)
1. Evolving resilience, ecological losses
2. Landloss and builtassets
3. Perceptions (risk + governance)
4. Intangiblevalues
5. Adaptation/Maladaptation
6. Institutional context (process + capacity)
for adaptivemanagement of hazards
under multi-stakeholderapproach
From an social-ecological perspective (Anderies et al, 2004; Décamp, 2007)
1. Holling,1973,Adger et al.,2005b; Décamps, 2007; Wasson et al.,2013;Hansen and
Nestlerode, 2014; Arkema et al.,2013
2. Dawson et al.,2009; Sanchez-Arcilla etal.,2007; Bernatchez et al.,2015
3. Burton and Kates, 1964; Peters and Slovic,1996;Swim et al.,2011a;Domingez-
Arcos,et al,2011;Lemieux et al,2013;Warren, 2010.
4. Tunstall and Tapsell,2007;Brown and Reed, 2009
5. Bernatchez and Fraser,2012;Cooper and Pilkey,2012; Lemmen et al.,2008
6. Klein et al.,2001; Adger et al.,2005a;Armitage et al.,2009; Billé,2006;Engle, 2011;
Juhola,2014; Frazier et al.2010;Cutter et al.,2003; Eakin and Lemos, 2006; Moser
and Ekstrom, 2010…
(IPCC CZCS, 1992; UNISDR et al., 2010)
ADEME, 2013; MDDELCC, 2015)
• Balance between assessments of impacts and of adaptations
• Vulnerability: a framework prescribed by UNISDR, IPCC…
(McFadden et al., 2007)
78](https://image.slidesharecdn.com/d975a07f-0ed2-4183-bd8b-e270efa14881-160309194544/85/UBV_soutenance_v5-78-320.jpg)
![Risk governance perception framework
102
Functional awareness
[name removed, sub.]
Accurate risk represenation and
desire to manage risks
and changes sustainably
•Dangersouness
•Uncertainty
•Intended behaviroural change
Functional affective context
An engaged community willing to
participate constructively
•Attitude towards the issue
•Attitude towards of management
•Feeling of involvement
Functional coherence
A common understanding of governance
shared by citizens & managers
•Conceptiosn of inclusiveness
•Conception of leadership
•Conception of mutual roles
Riskappraisal
(Burton,1964
Slovic,1987)
Cognitivebias
(Tverskyand
Kahneman,1974)
Adaptation intention
(Grothman and Patt, 2005)
Perception domain
Reality domain
Factors broader than community
•Exposure to natural hazards
•Socio-economical-cultural-institutional
contexts
•Climate discourse
•Etc.
Factors intra-community of
adaptive capacity
•Perceptions
•Resources (social, economical,
institutional capitals)
Community-scale adaptive capacity
Founding concepts Ability & sub-dimensions
Iterative
feedback
Factors submitted to individual processing Factor defined by inter-actors scale
Governance perception (this article)](https://image.slidesharecdn.com/d975a07f-0ed2-4183-bd8b-e270efa14881-160309194544/85/UBV_soutenance_v5-102-320.jpg)
![Environmental preoccupations
Kilkeel Chipiona Avignon
Citation 1 "The sea is taking away the bank,
[which brings] less field surface"
(KIL023)
"There is not any [environmental
problem], it is conserved well
enough, I don’tsee any"
(CHI09)
"We don’tlike to see the coast
retreating; we Wonder what is
going to happen" (AVI045)
Citation 2 "There is a significant problem
about coastal erosion […] lack of
recognized strategy to deal with
that problem" (KIL027)
“An NGO is watching and
paying attention to the
environmental themes, the clubo
CANS]” (CHI027)
"An event like the one in 2010, it
makes you reflect a lot; the
warming of the planet, it is not us
until [the nature] takes its right
back; I understood [the
message] : I am going, I am
moving [soonmy house]"
(AVI051)
Attitude Rationalproblem
acknowledgement
"Disinvolvement", denial or
lack of observation
Emotionalexperience of the
problem
Representativecitationsamong environmentalpreoccupations
about coastal hazards, conservation,management,
0) Leiserowitz, 2006
1) Reser and Swim, 2011; Leiserowitz 2006;
1A) Giddens, 1993; Wakefield and Elliot,2000 108](https://image.slidesharecdn.com/d975a07f-0ed2-4183-bd8b-e270efa14881-160309194544/85/UBV_soutenance_v5-108-320.jpg)

![Ho: Only for segments with current artificial structure or measure
Theoretical adequacy (T/F)
(based on theoretical judgement:
See table of referenceby type of
coast)
Current adequacy
to coastal erosion
Future adequacy
to coastal erosion
Empiricaladequacy (T/F)
(observed/measured)
To coastal erosion: (by sea OR slope/subarieal processes)
[type of coast] AND
[type of structure/measure]2
[observed/measured recentstateof
the shoreline& coastline4
] OR
[other proofs]
Idemthan above, with respectto
futuretrends of hazards
&
= &
&= Idem than above
To submersion (sea flooding): (only low lying coasts, with respect to height not resistance)
Current adequacy
to submersion
Future adequacy
To submersion
[type of coast] AND
[type of structure/measure]2
[observed/measured recentstateof
the shoreline& coastline4] OR
[other proofs]
Idemthan above, with respectto
futuretrends of hazards
= &
&= Idem than above
Adequacy
to hazard =
T = (T, T) F = (F, T) F = (T, F) F = (F, F)
Adequacy is true if and only true if theoretical AND empirical adequacy are both true
Determinationof adequacy of coastal defense structure or measure
=> Limit (submersion): no respect for resistance, only height, may lead to under-estimation of adequacy
A(e,c)
A(e,f)
A(s,c)
A(s,f)](https://image.slidesharecdn.com/d975a07f-0ed2-4183-bd8b-e270efa14881-160309194544/85/UBV_soutenance_v5-134-320.jpg)