Download as PDF, PPTX

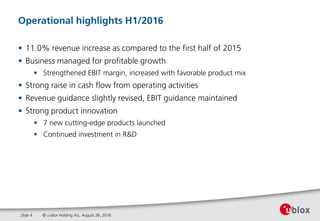
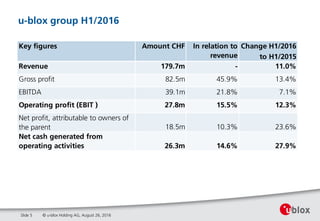
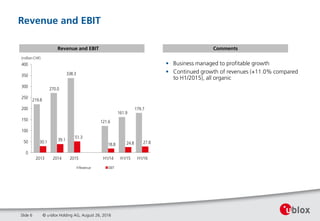
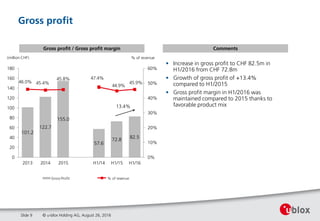
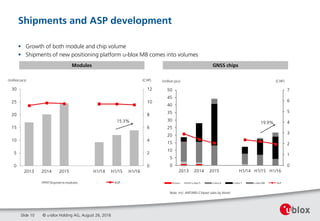
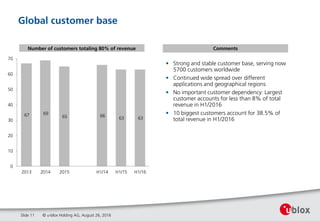
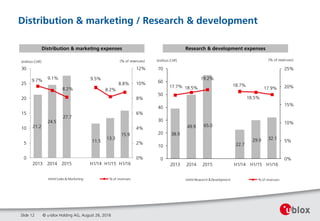
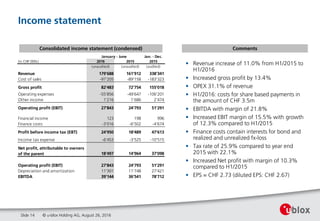

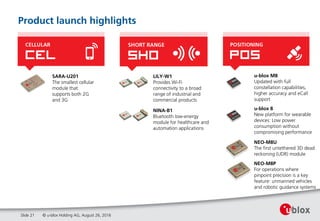


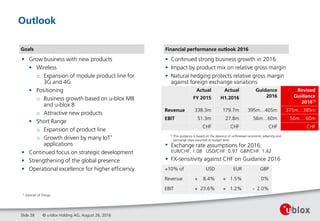

u-blox holding AG reported an 11.0% revenue increase to CHF 179.7 million for H1 2016 compared to H1 2015, alongside a 13.4% rise in gross profit. The company maintained its EBIT margin at 15.5% and achieved a net profit of CHF 18.5 million. Additionally, u-blox launched seven new products and strengthened its cash flow from operating activities.


