Download as PDF, PPTX


![References
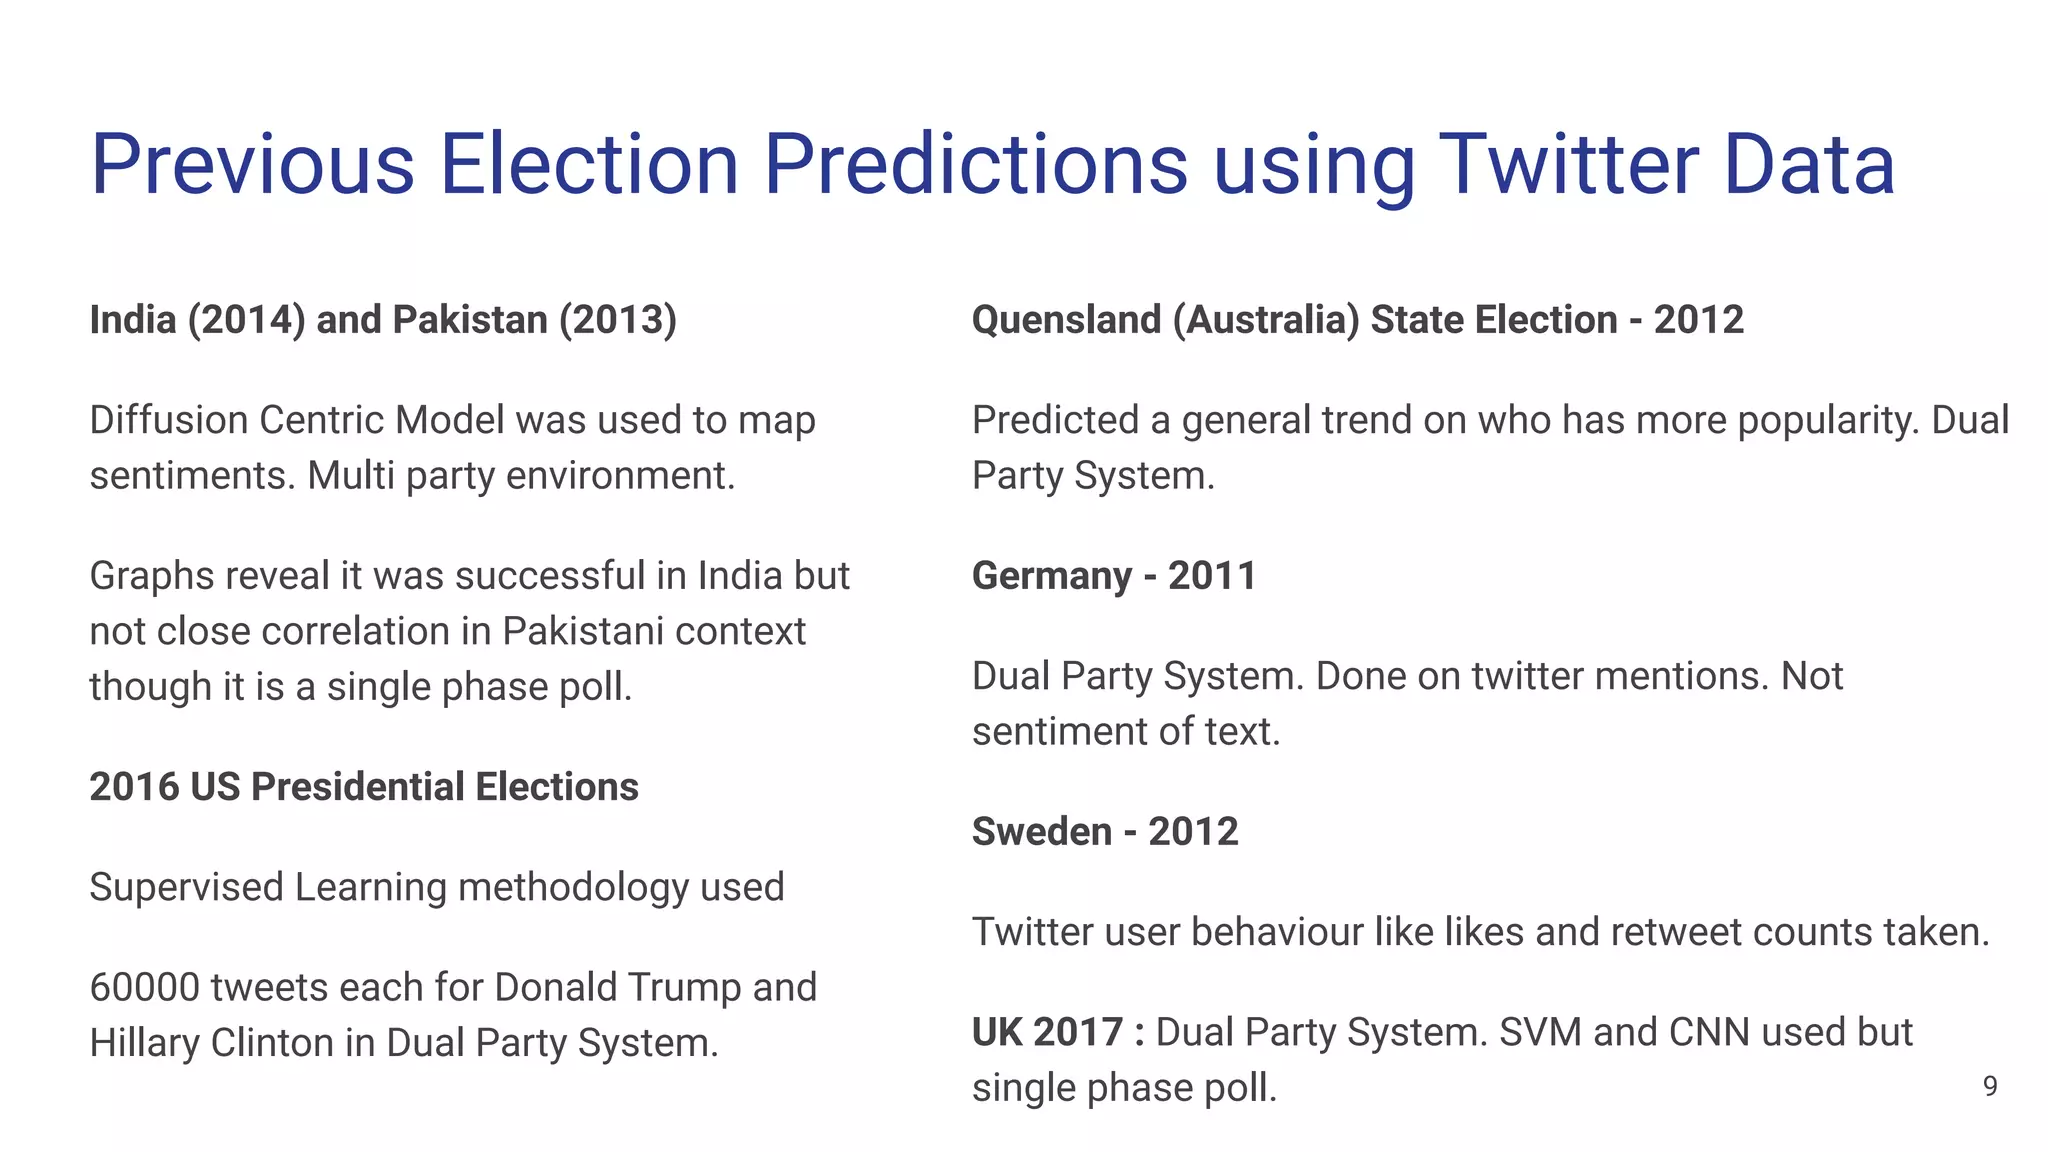
[1] J. Burgess and A. Bruns, “(Not) the Twitter election: the dynamics of the#
ausvotes conversation in relation to the Australian media ecology,” Journal. Pract.,
vol. 6, no. 3, pp. 384–402, 2012.
[2] V. Kagan, A. Stevens, and V. S. Subrahmanian, “Using twitter sentiment to
forecast the 2013 pakistani election and the 2014 indian election,” IEEE Intell.
Syst., vol. 30, no. 1, pp. 2–5, 2015.
[3] J. Ramteke, S. Shah, D. Godhia, and A. Shaikh, “Election result prediction using
Twitter sentiment analysis,” in 2016 international conference on inventive
computation technologies (ICICT), 2016, vol. 1, pp. 1–5.
[4] A. O. Larsson and H. Moe, “Studying political microblogging: Twitter users in the
2010 Swedish election campaign,” New Media Soc., vol. 14, no. 5, pp. 729–747,
2012.
[5] X. Yang, C. Macdonald, and I. Ounis, “Using word embeddings in twitter election
classification,” Inf. Retr. J., vol. 21, no. 2–3, pp. 183–207, 2018.
[6] A. Tumasjan, T. O. Sprenger, P. G. Sandner, and I. M. Welpe, “Election forecasts
with Twitter: How 140 characters reflect the political landscape,” Soc. Sci. Comput.
Rev., vol. 29, no. 4, pp. 402–418, 2011.
[7] J. Roesslein, “tweepy Documentation,” Online] http://tweepy. readthedocs.
io/en/v3, vol. 5, 2009.
[8] A. Nayak, MongoDB Cookbook. Packt Publishing Ltd, 2014.
[9] F. J. John Joseph, R. T, and J. J. C, “Classification of correlated subspaces using
HoVer representation of Census Data,” in 2011 International Conference on
Emerging Trends in Electrical and Computer Technology, 2011, pp. 906–911.
[10] E. Loper and S. Bird, “NLTK: the natural language toolkit,” arXiv Prepr.
cs/0205028, 2002.
[11] S. Loria, “textblob Documentation,” 2018.
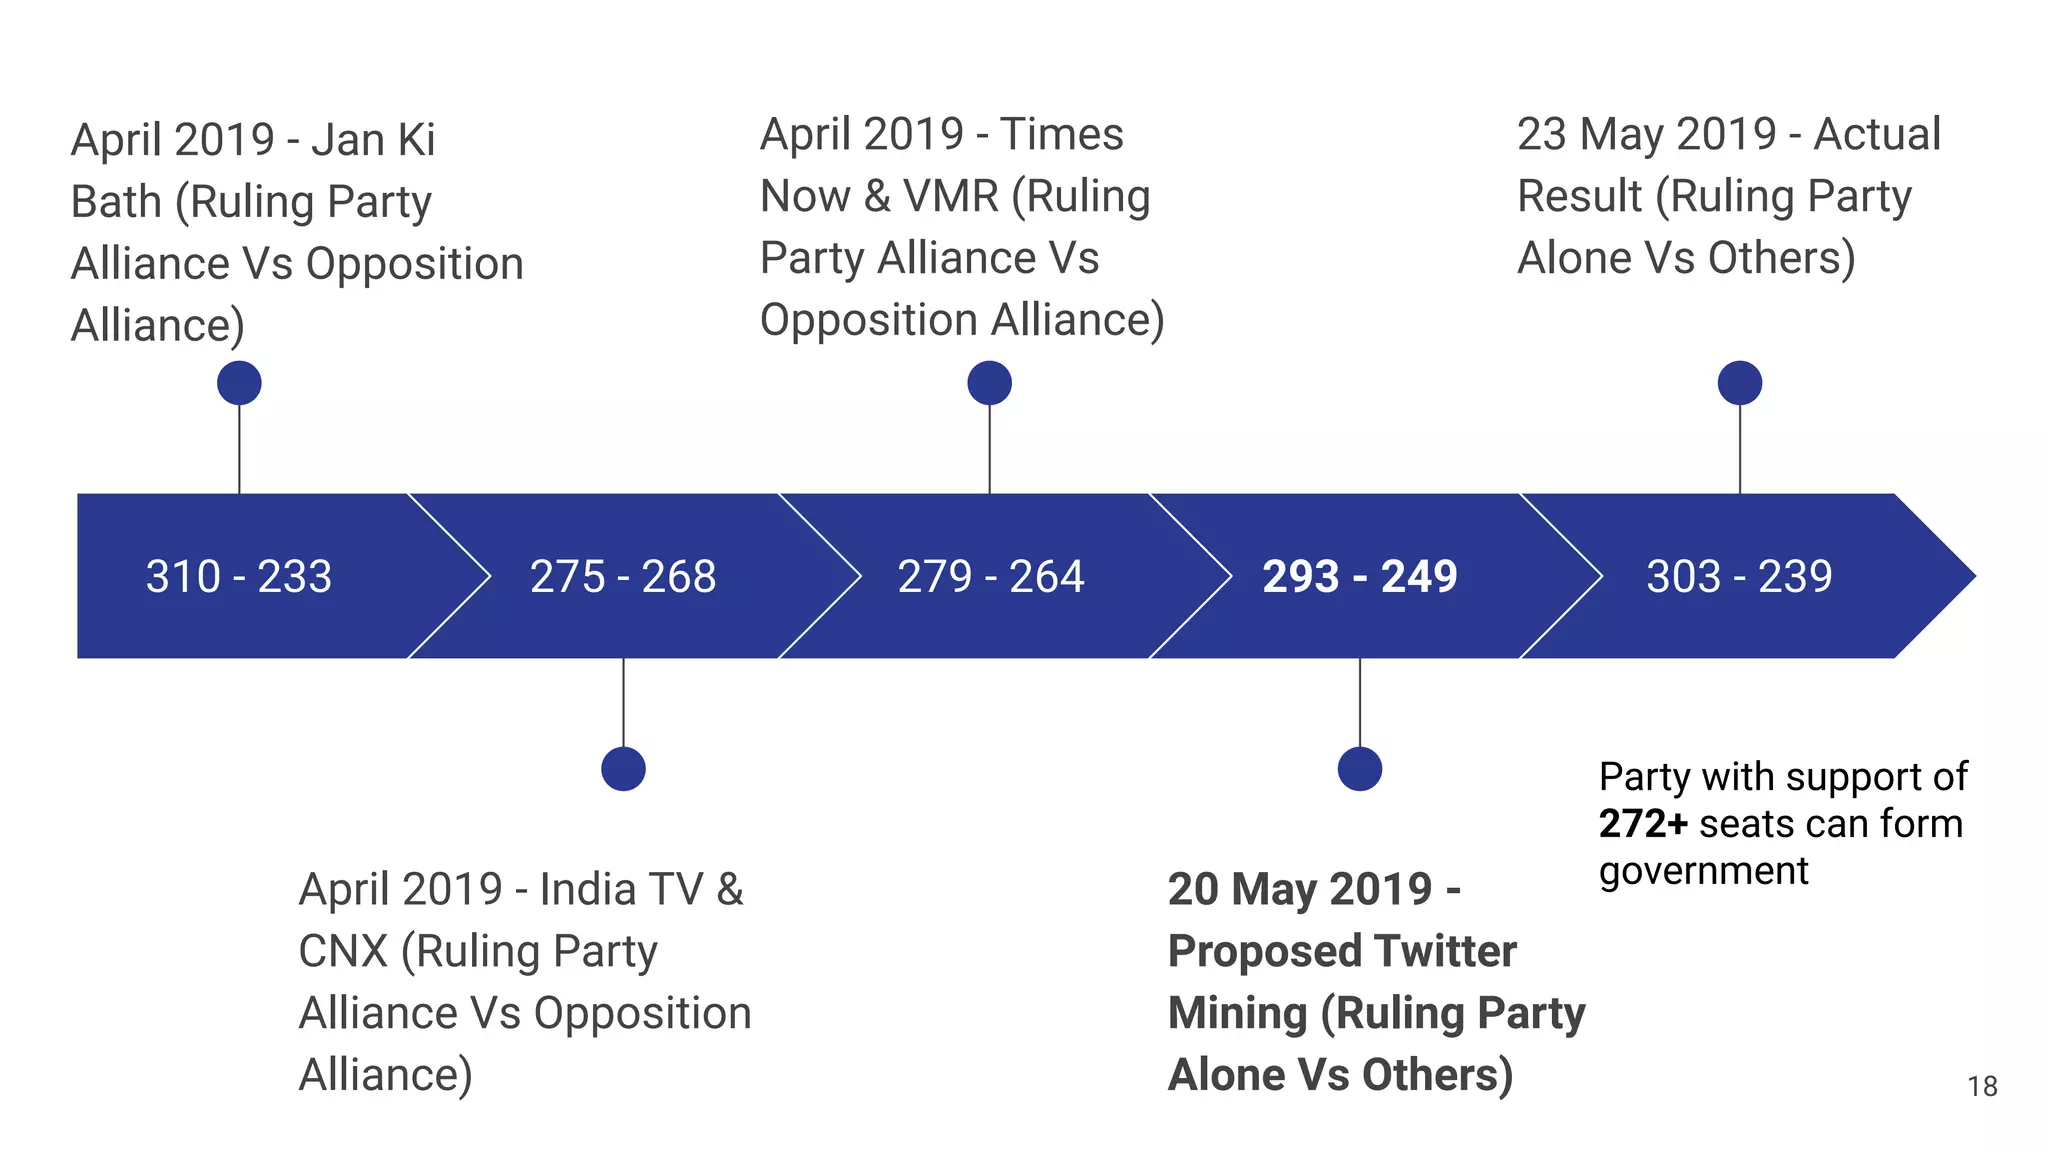
[12] T. N. Bureau, “Times Now-VMR Opinion Poll For Election 2019: PM Narendra
Modi-led NDA likely to get 279 seats, UPA 149,” Times Now News, New Delhi,
2019.
[13] I. T. News Desk, “Lok Sabha Election 2019: NDA may get thin majority with 275
seats, BJD may retain Odisha, YSR Congress may win Andhra, says India TV-CNX
pre-poll survey,” India TV, 2019.
[14] “2019 Indian General Election,” Wikipedia, 2019. [Online]. Available:
https://en.wikipedia.org/wiki/2019_Indian_general_election.
24](https://image.slidesharecdn.com/twitterincit2019-191106040431/75/Twitter-Based-Outcome-Predictions-of-2019-Indian-General-Elections-Using-Decision-Tree-24-2048.jpg)


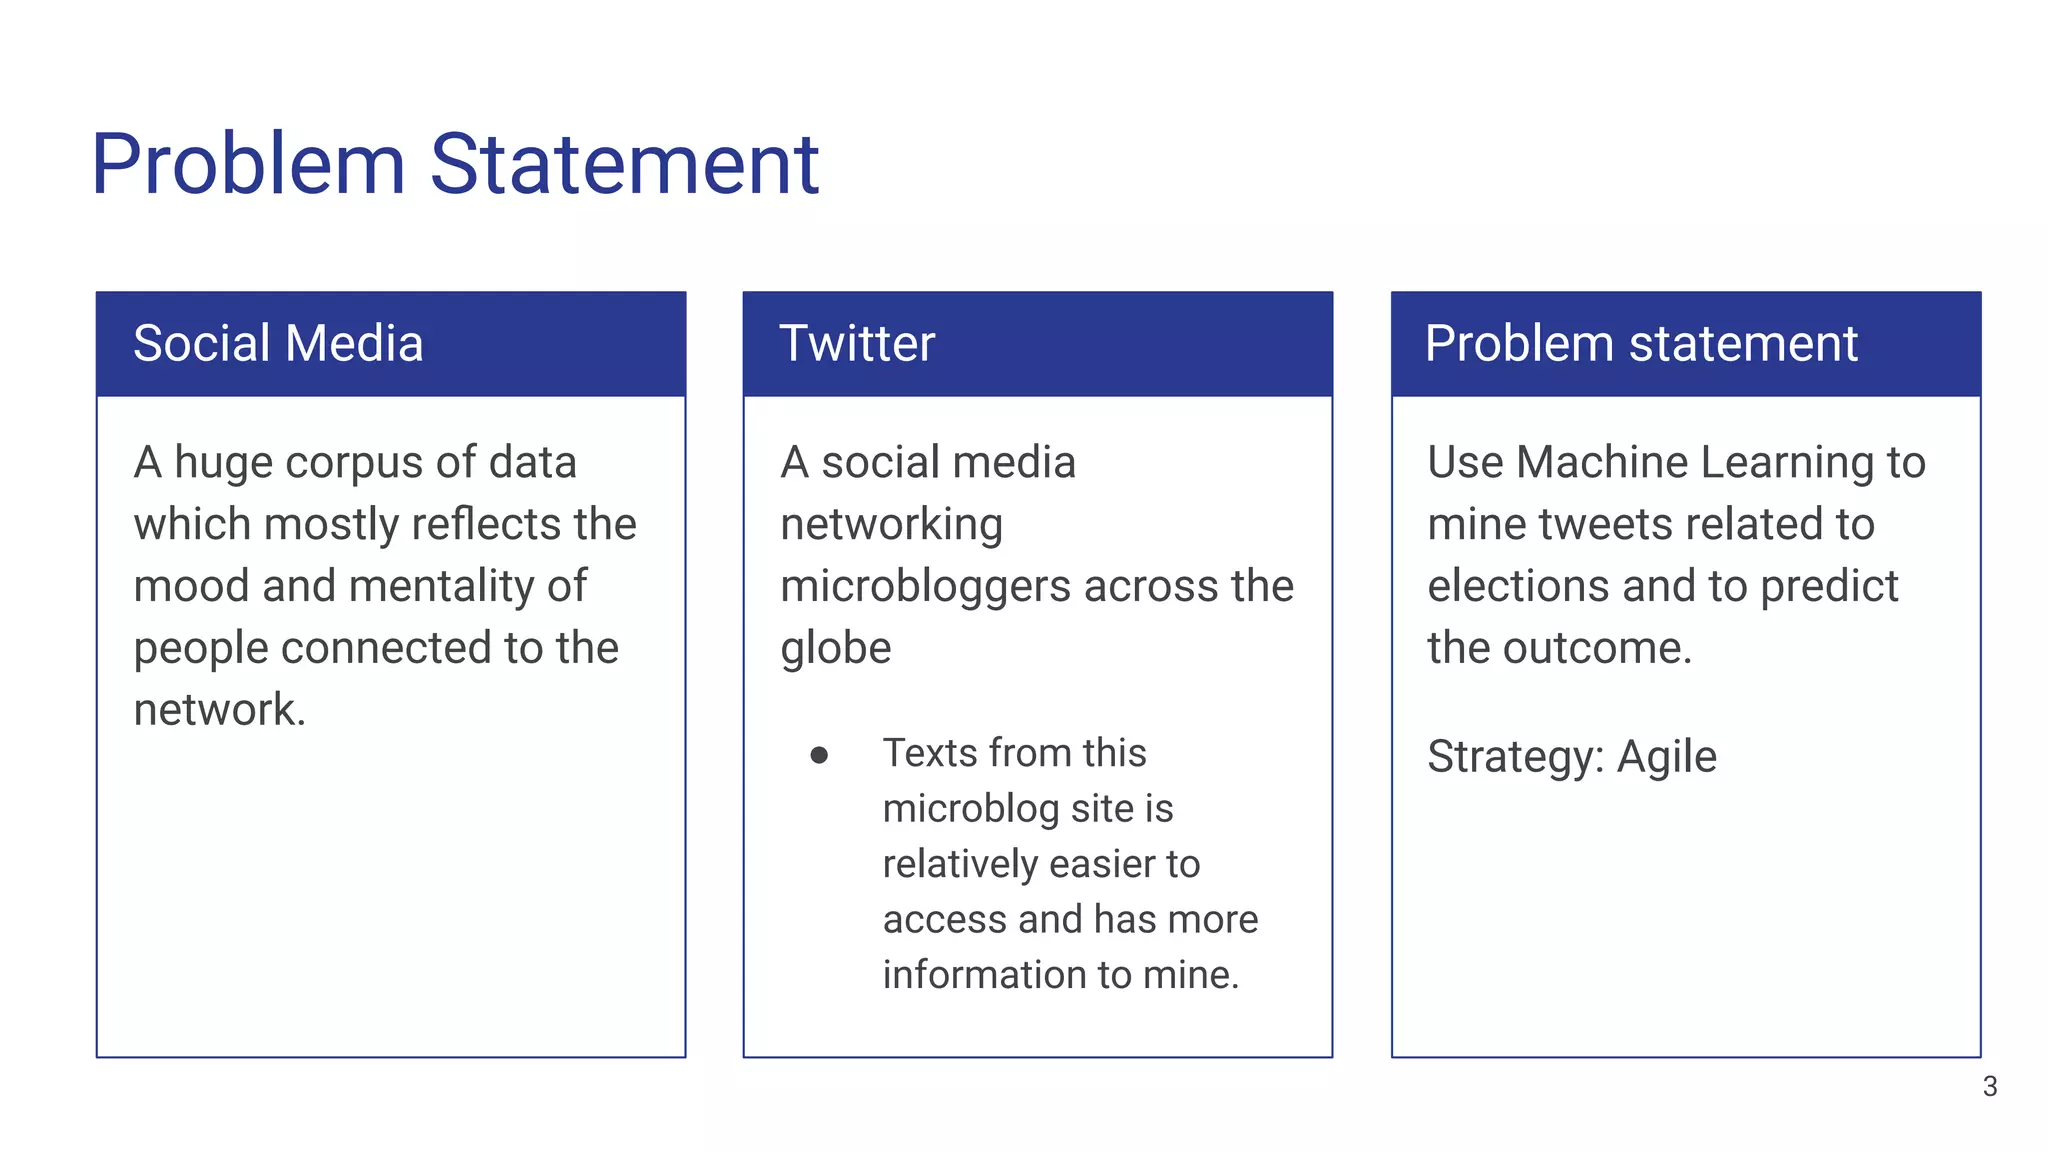
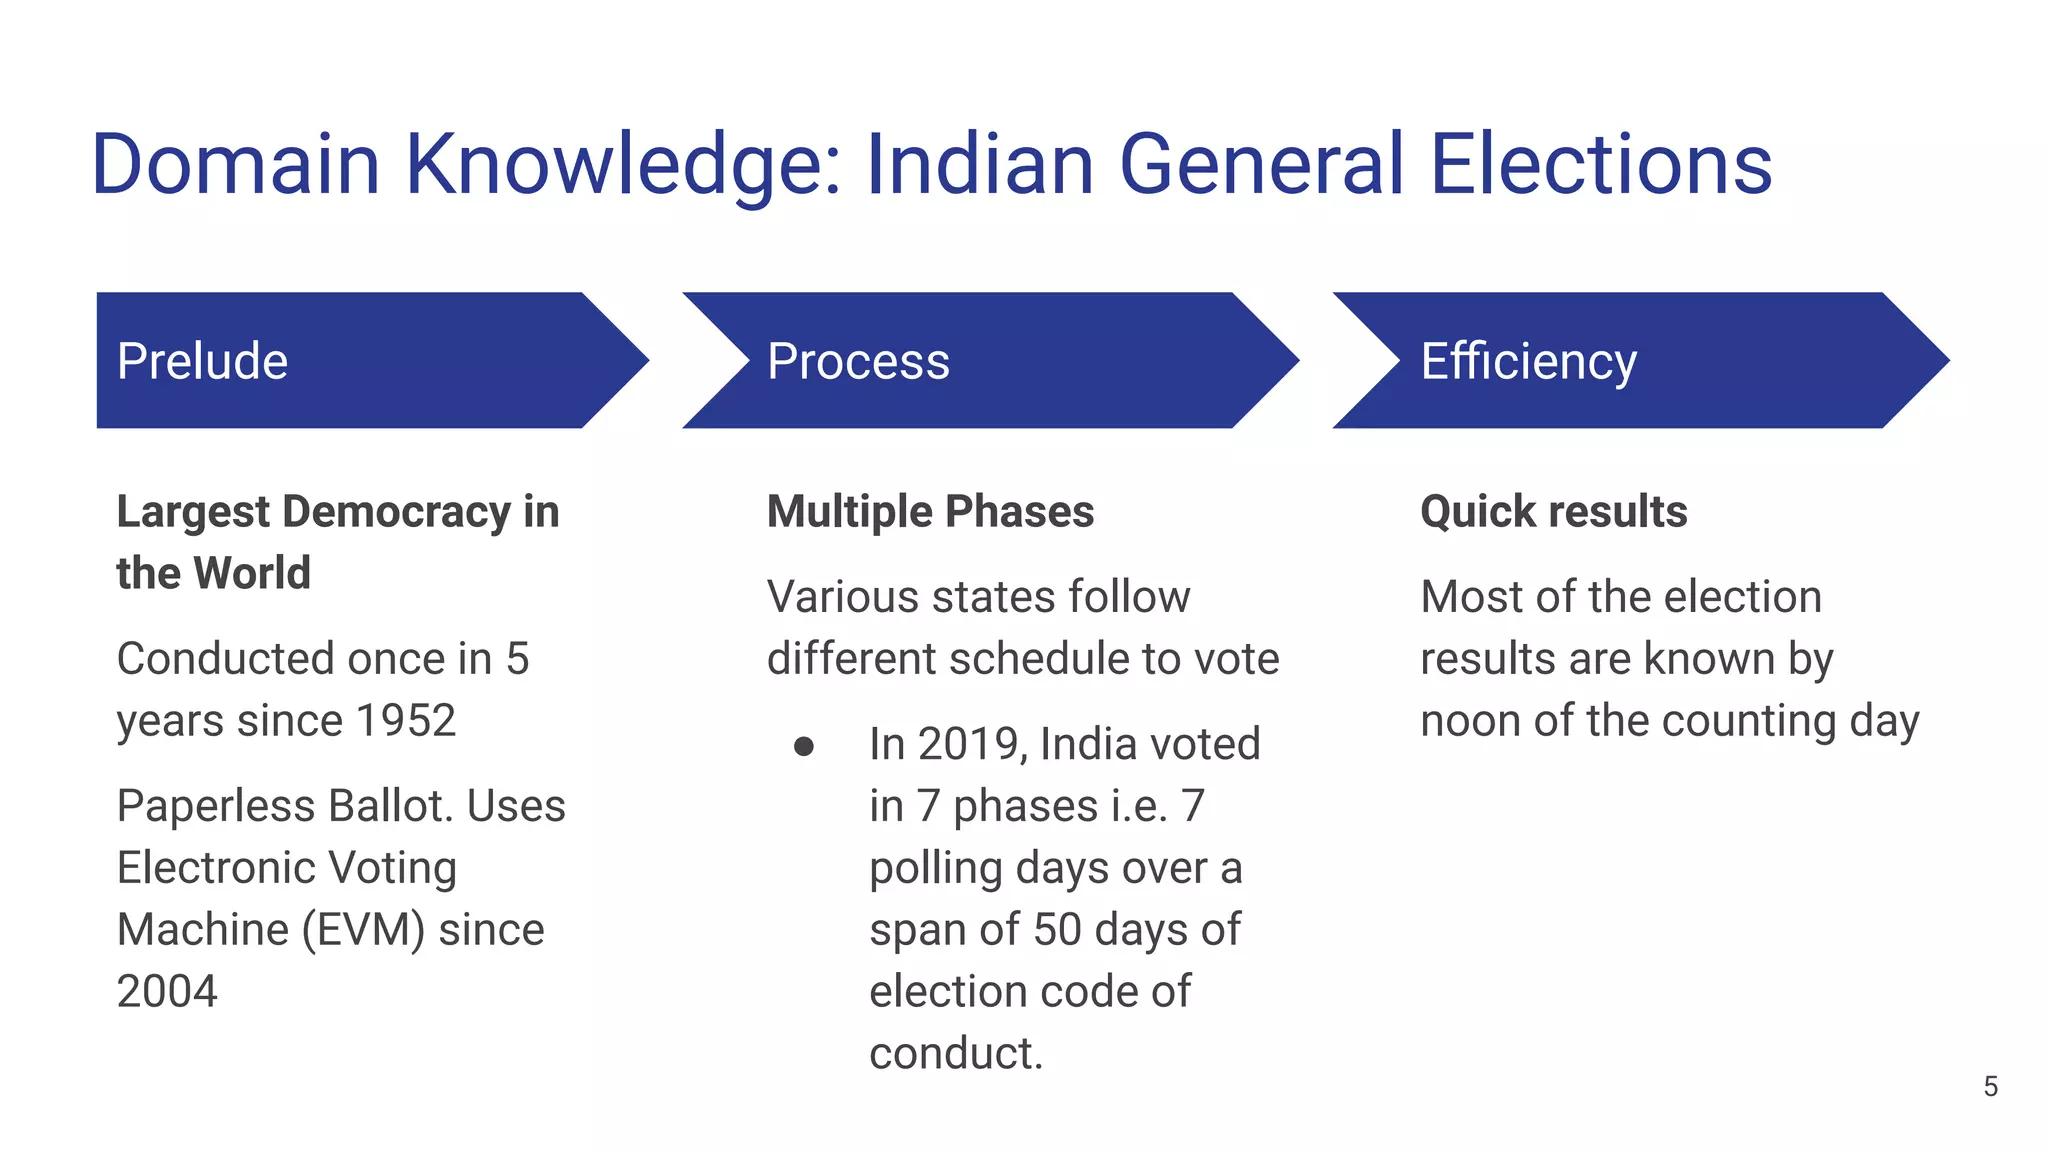
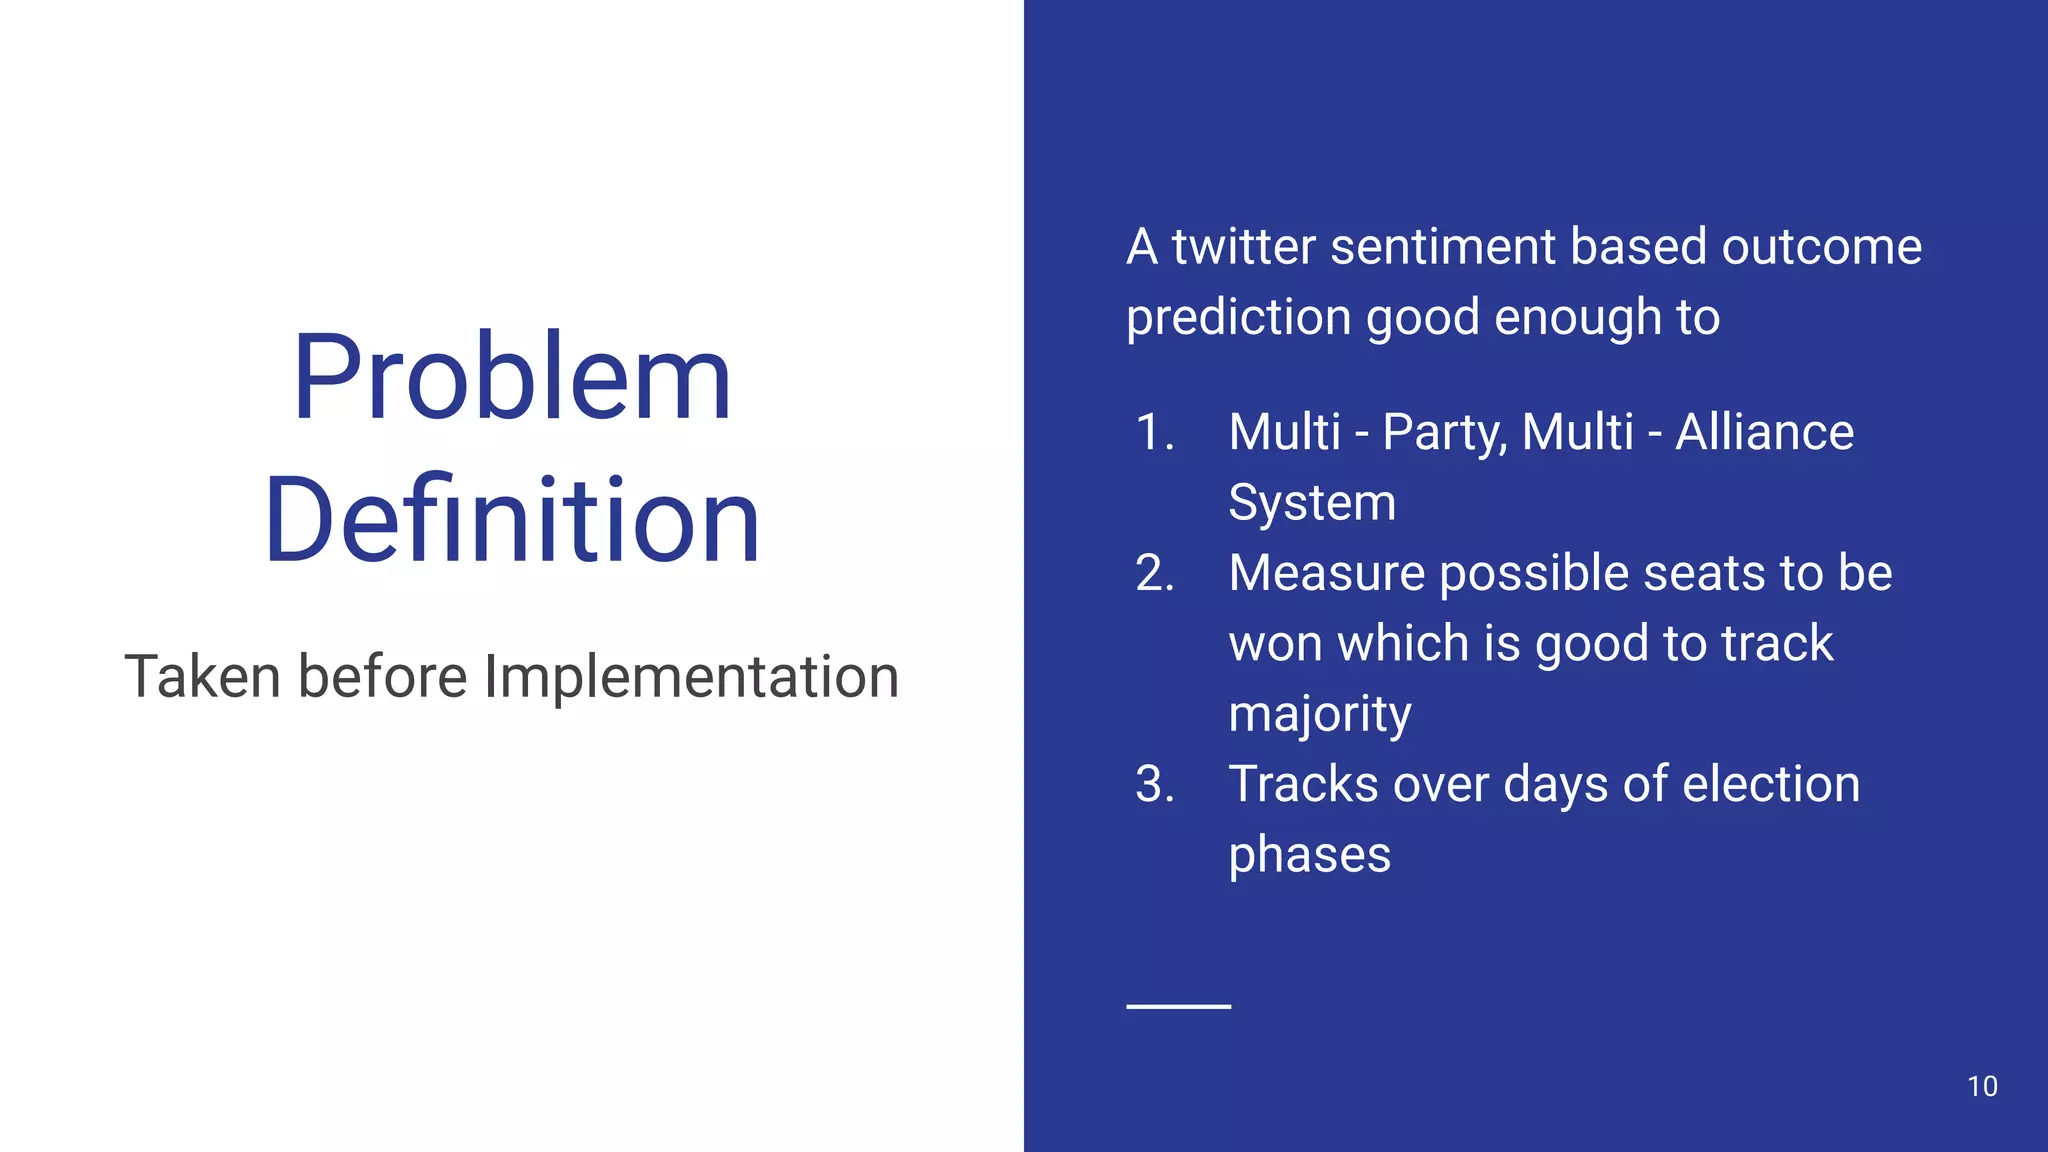
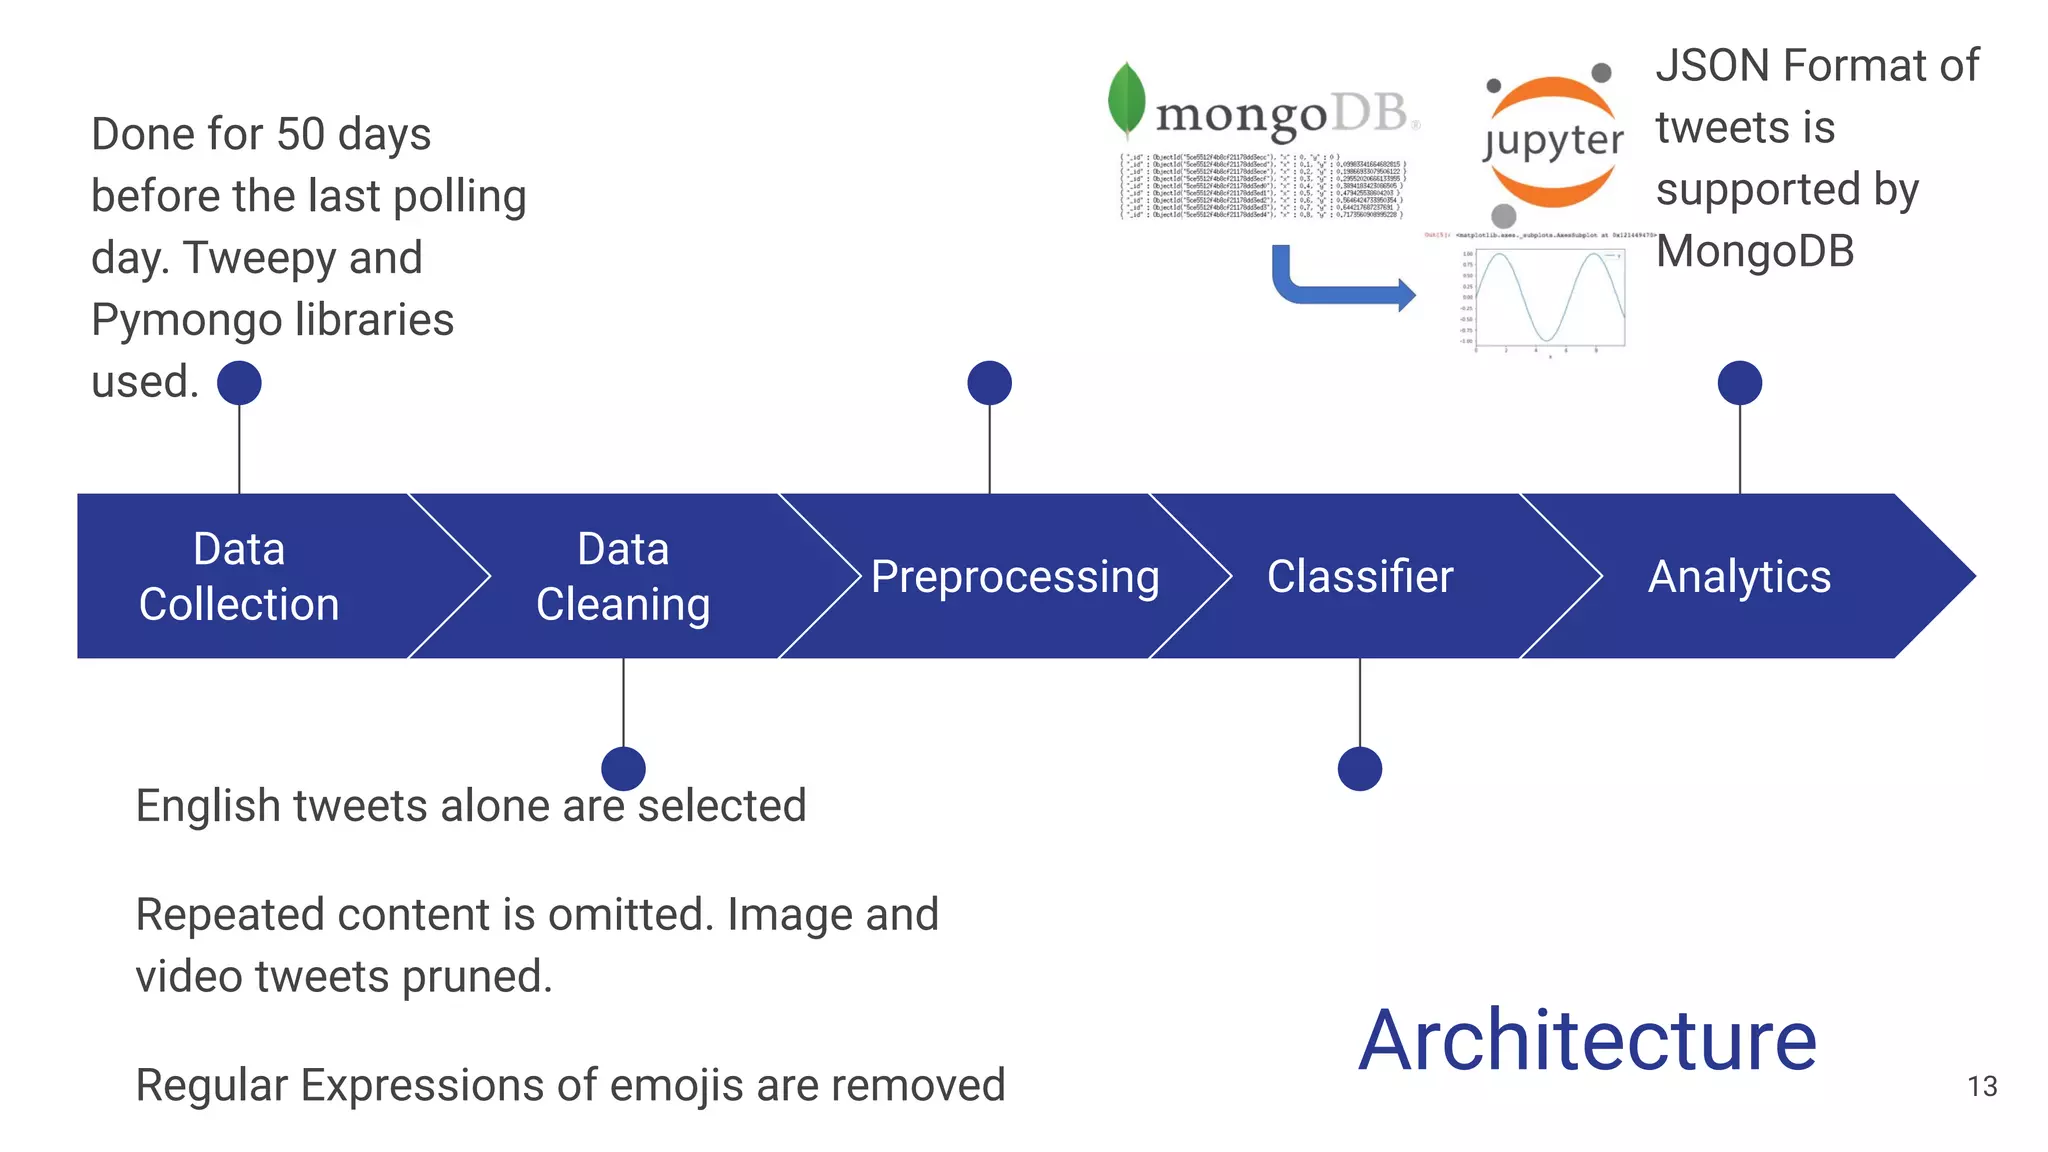
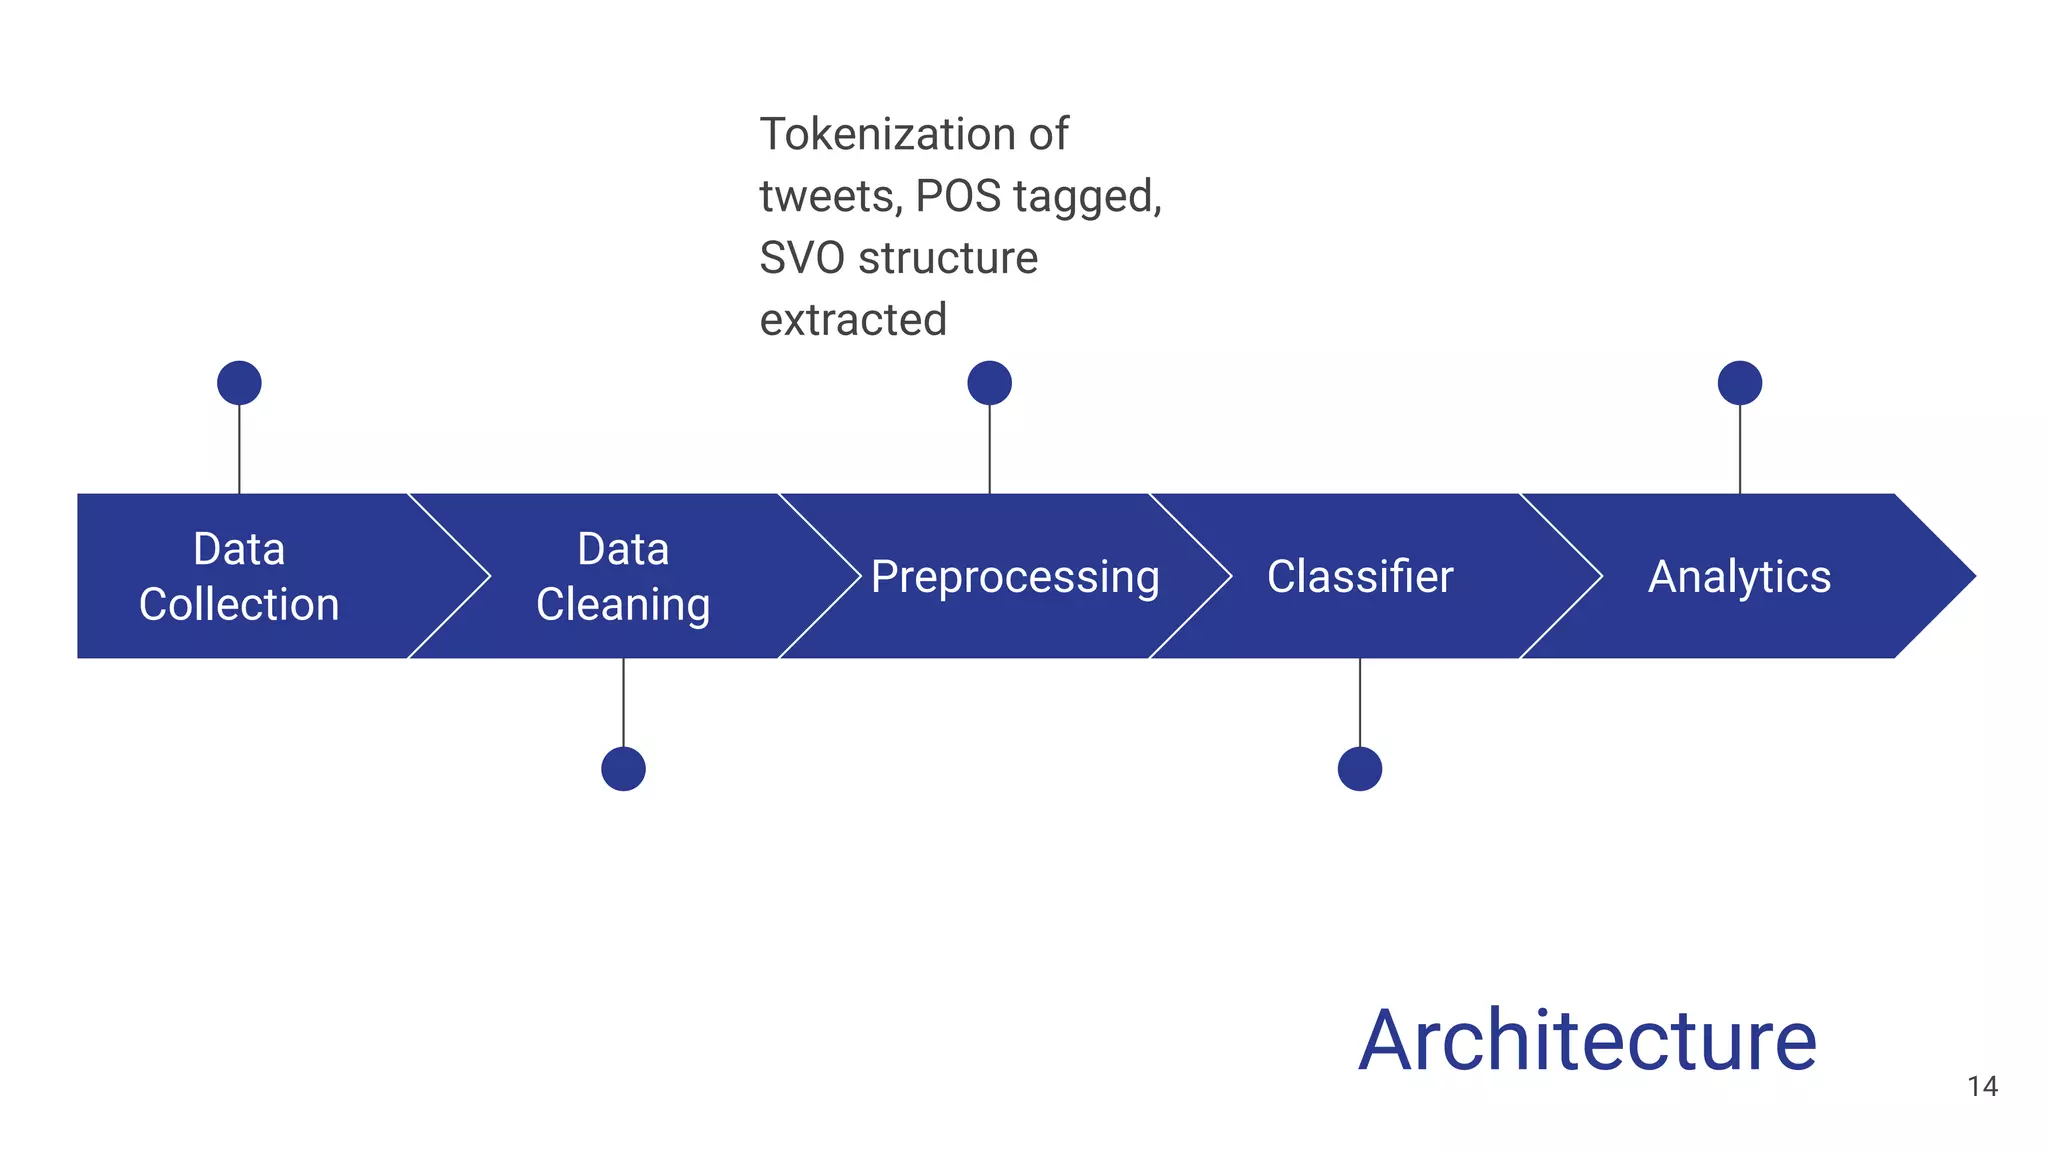
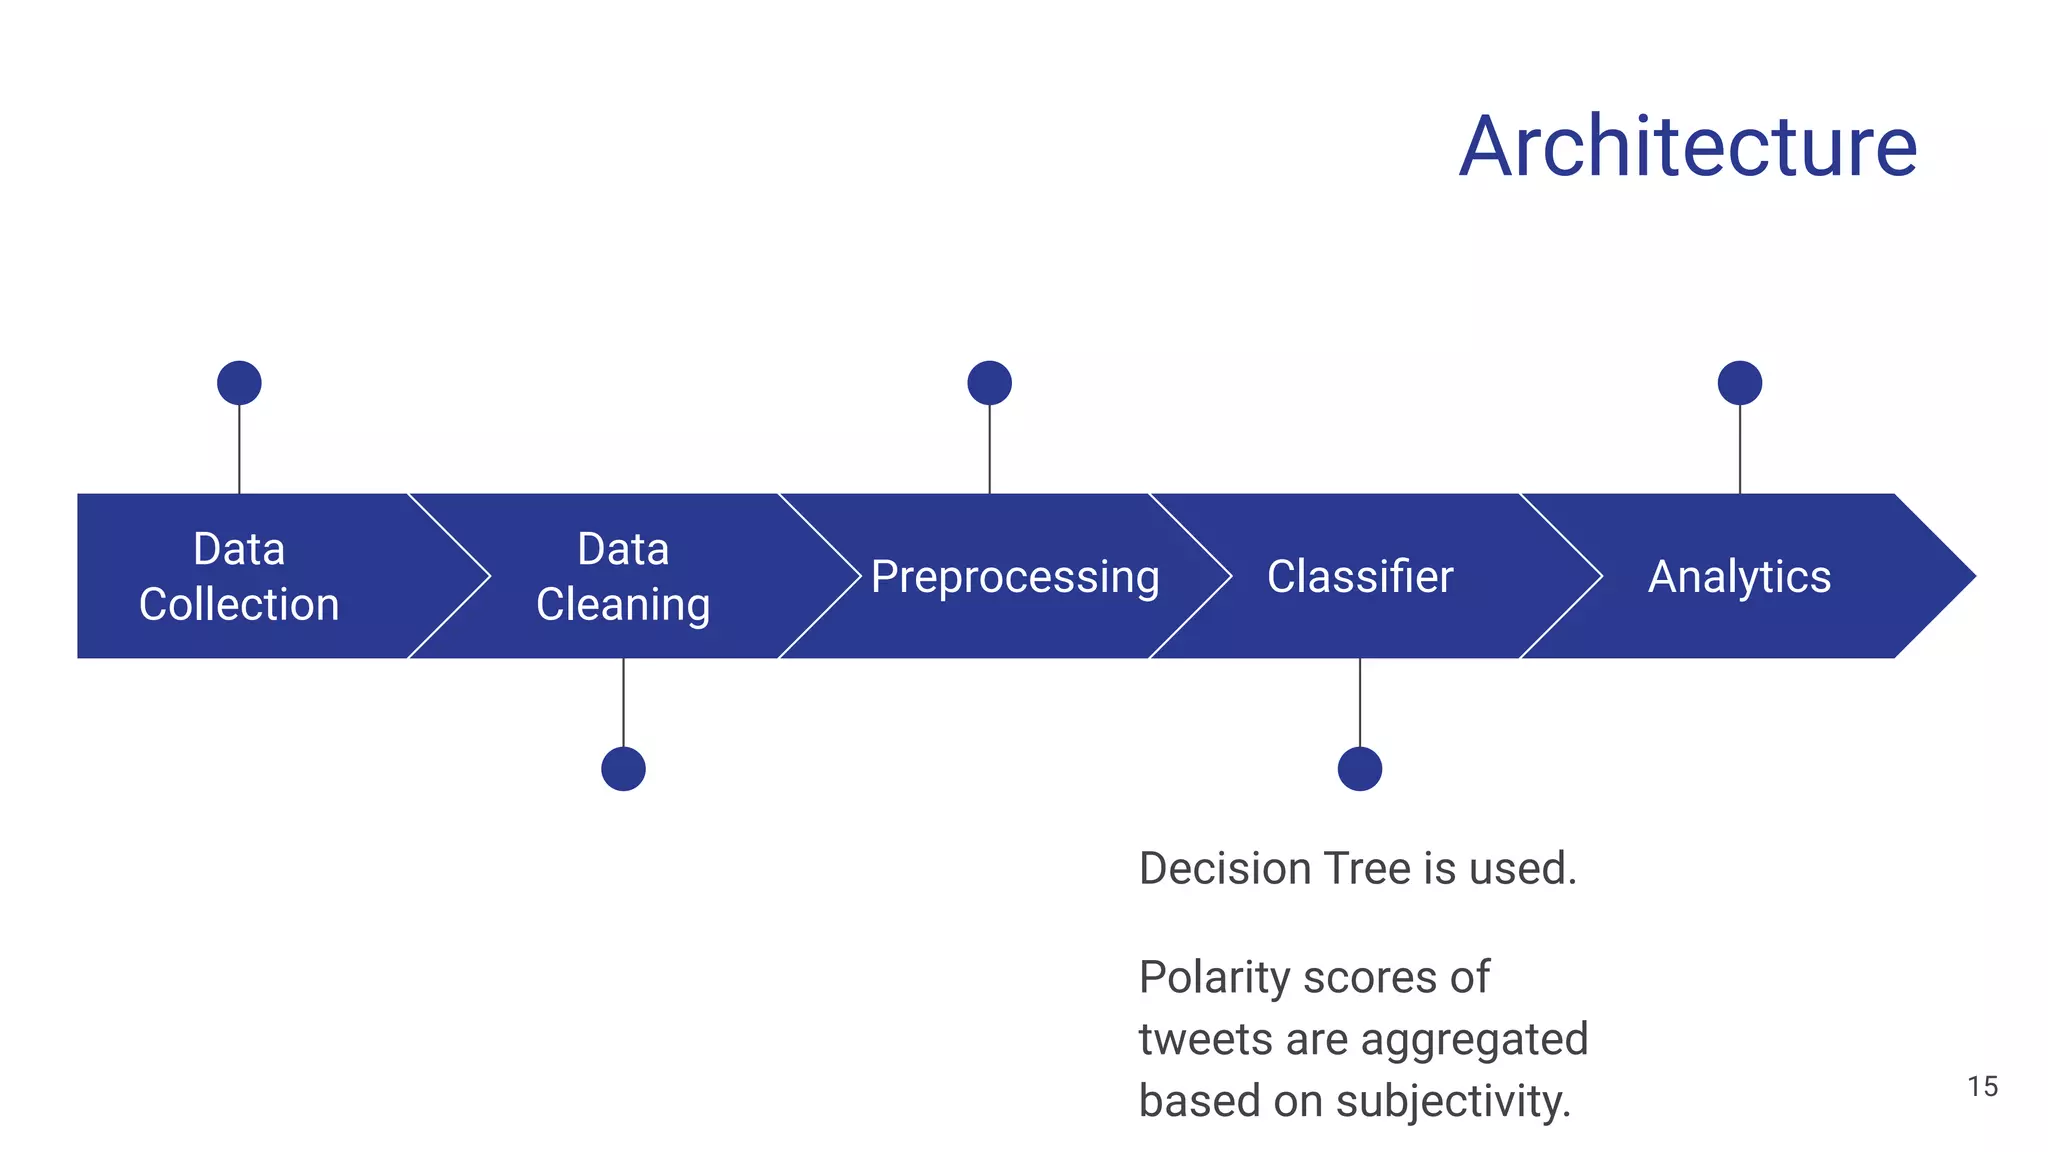
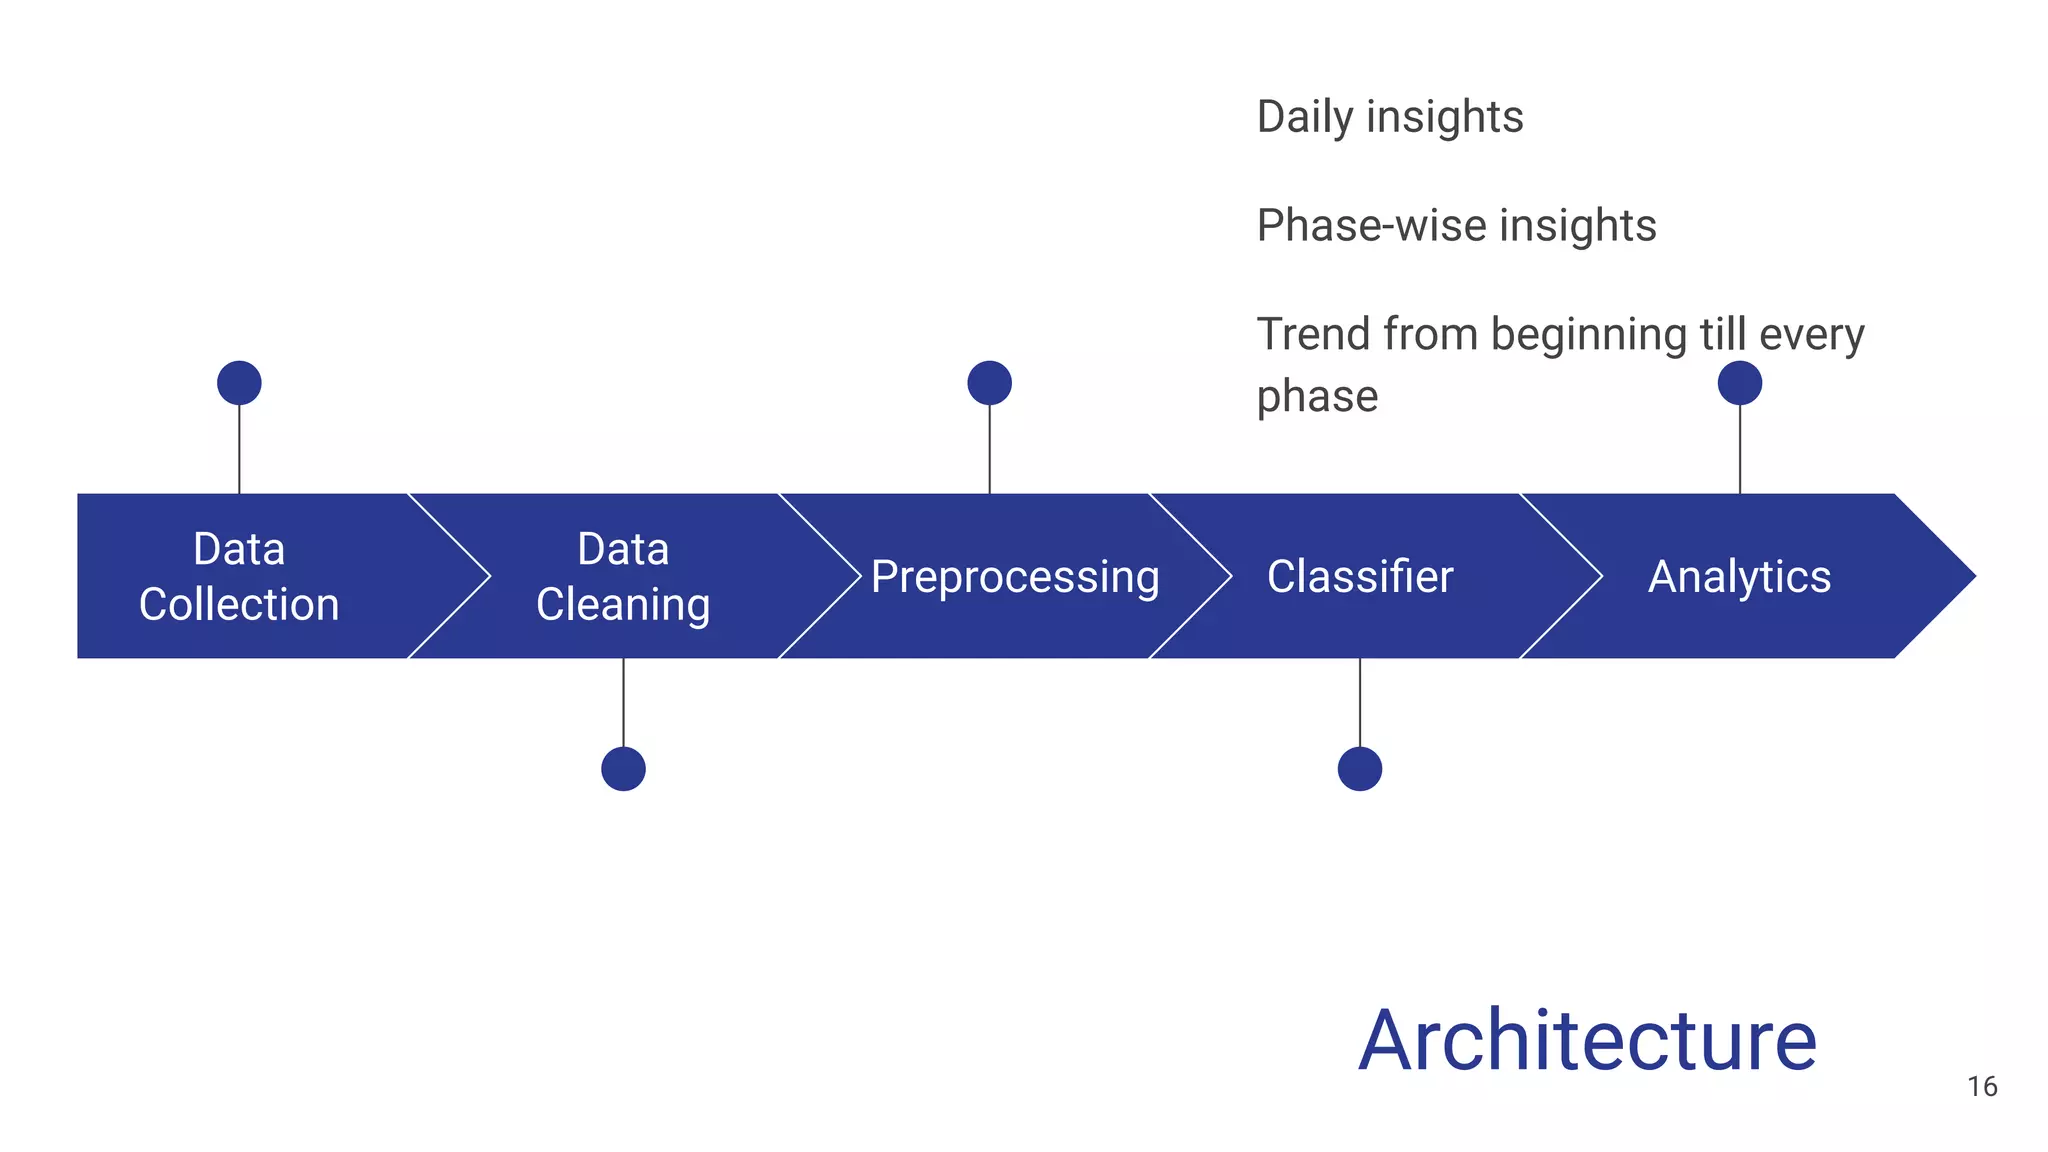
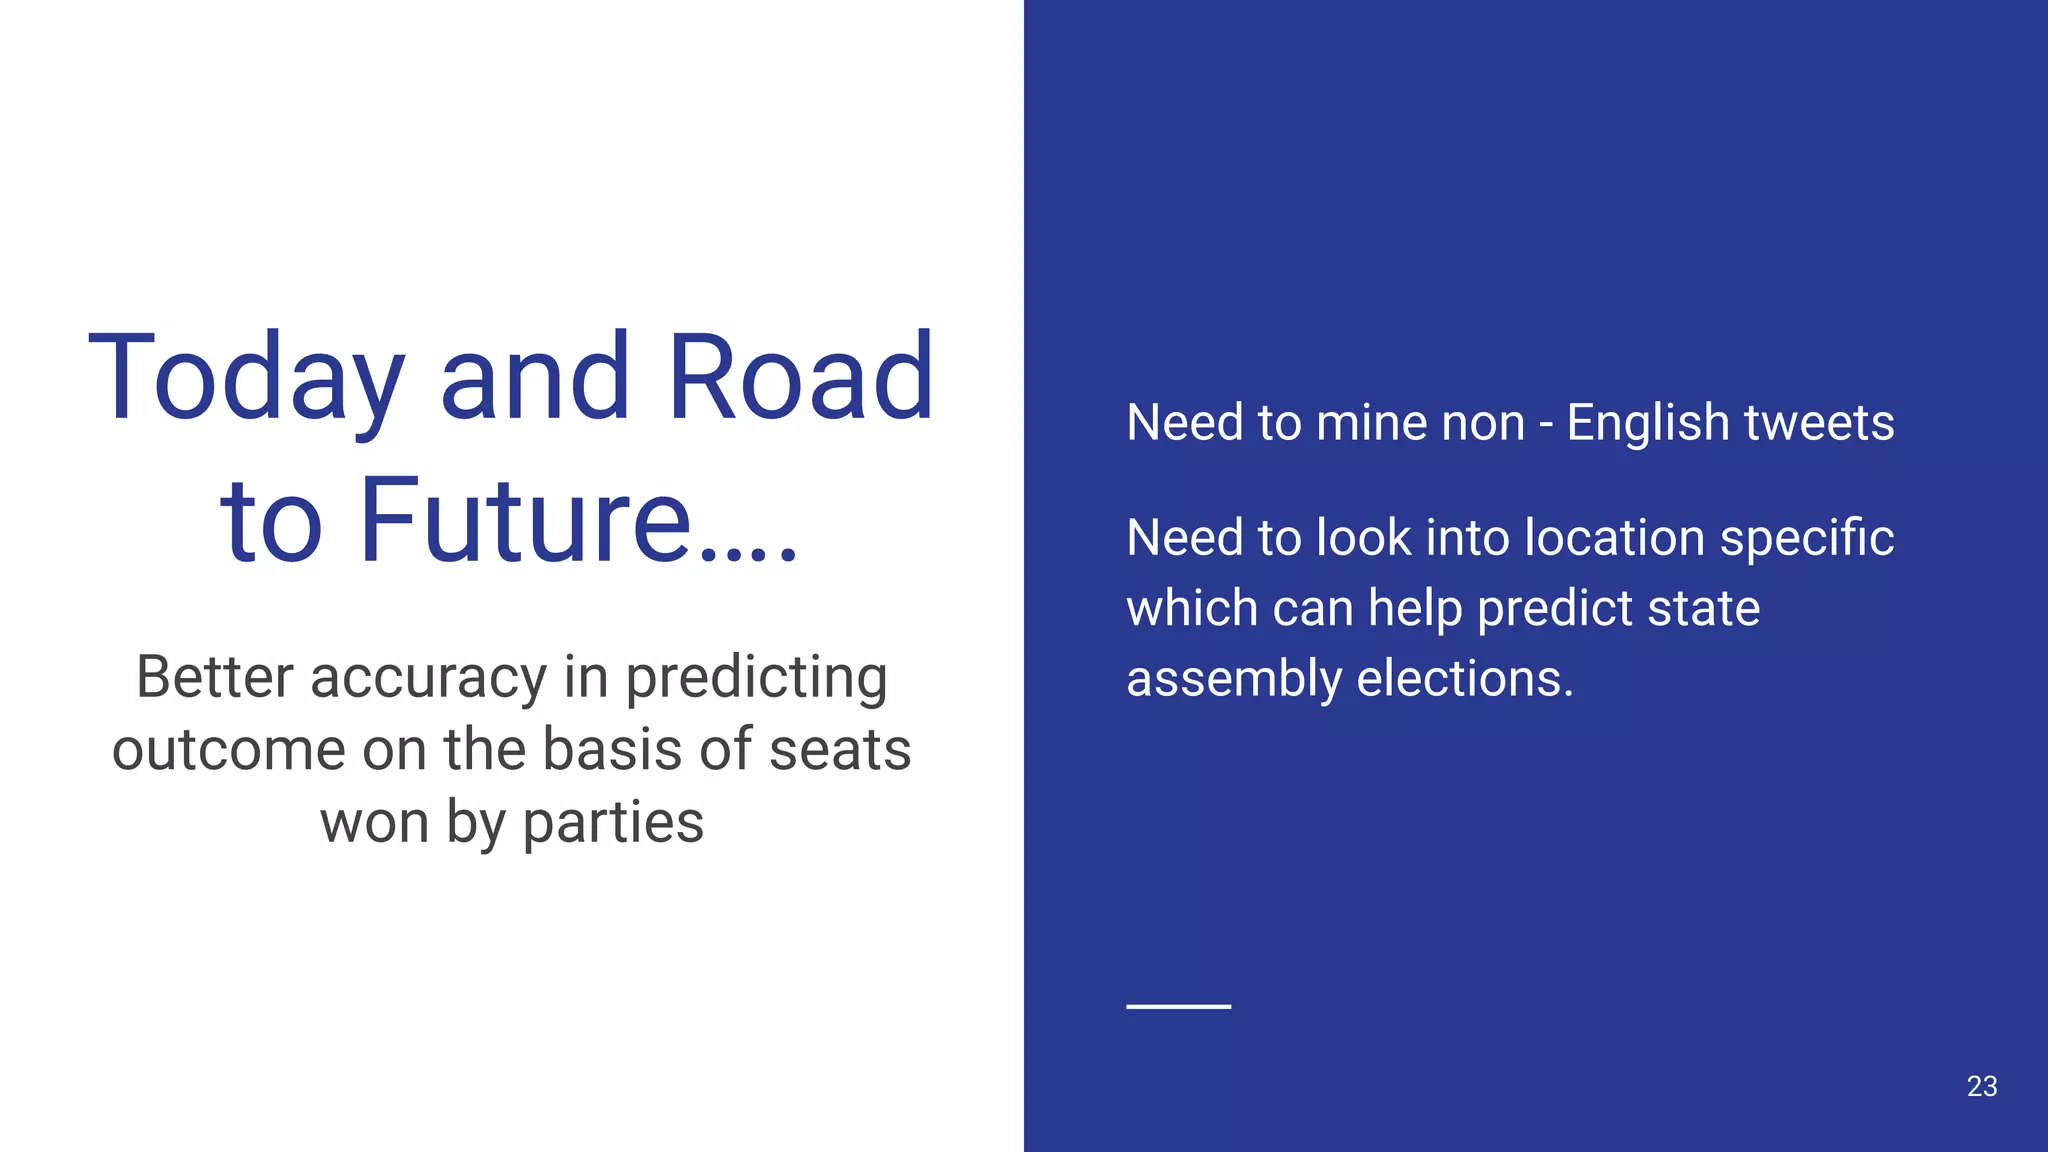
The document discusses a methodology for predicting the outcomes of the 2019 Indian general elections using Twitter sentiment analysis and decision trees. It highlights existing election prediction techniques and the significance of social media data in understanding public sentiment. The study aims to improve accuracy in forecasting election results by analyzing tweets over the election phases.


![[DSC Europe 25] Milan Sekuloski - Data, Defence, and Development: Cybersecuri...](https://cdn.slidesharecdn.com/ss_thumbnails/dfrkwwx4qly6atqpbl4z-4-251209104645-c3d4b0ca-thumbnail.jpg?width=640&height=640&fit=bounds)

![[DSC Europe 25] Nikolay Burlutskiy - Best Practices for Building Enterprise M...](https://cdn.slidesharecdn.com/ss_thumbnails/uirvaiuvq8y1w8hzd9tx-7-251212103249-2619edb4-thumbnail.jpg?width=640&height=640&fit=bounds)
![[DSC Europe 25] Branko Urosevic -Rethinking Financial Talent: Integrating Cod...](https://cdn.slidesharecdn.com/ss_thumbnails/8jjrus8ttko6qj64f58f-3-251212103250-642c6374-thumbnail.jpg?width=640&height=640&fit=bounds)
![[DSC Europe 25] Ivan Peric - Intelligence Swarm Logic and Techno-Functional M...](https://cdn.slidesharecdn.com/ss_thumbnails/7my7c97fsduiccadgavw-2-251212103249-5a03f7c6-thumbnail.jpg?width=640&height=640&fit=bounds)

![[DSC Europe 25] Jovan Bogicevic - Legacy to AI-Driven Defense: Transforming D...](https://cdn.slidesharecdn.com/ss_thumbnails/rsarluadt563hntyfc8q-3-251211083849-3e7bc4c0-thumbnail.jpg?width=640&height=640&fit=bounds)

![[DSC Europe 25] Dusan Nesic - Securing Tomorrow’s Infrastructure: Why Cyber-P...](https://cdn.slidesharecdn.com/ss_thumbnails/qikbszfftyowjm2q6duw-1-251211083848-8f2ead6b-thumbnail.jpg?width=640&height=640&fit=bounds)
![[DSC Europe 25] Jon Dajci - Bridging TradFi and DeFi: Building the Future of ...](https://cdn.slidesharecdn.com/ss_thumbnails/fqmhfvlbqhkihjvqvhmu-7-251211083849-6af7e325-thumbnail.jpg?width=640&height=640&fit=bounds)

