Downloaded 106 times

![READING
THE RIOTS
ON TWITTER
Rob Procter (University of Manchester)
Farida Vis (University of Leicester)
Alexander Voss (University of St Andrews)
[Funded by JISC]
#readingtheriots](https://image.slidesharecdn.com/srakeynotejune2013farida-130627044122-phpapp02/85/Twitter-analytics-some-thoughts-on-sampling-tools-data-ethics-and-user-requirements-2-320.jpg)
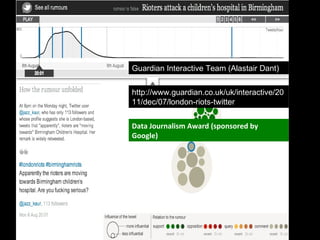
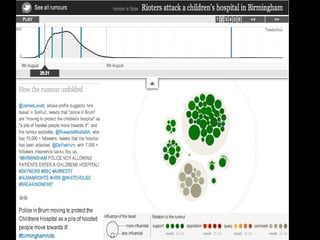
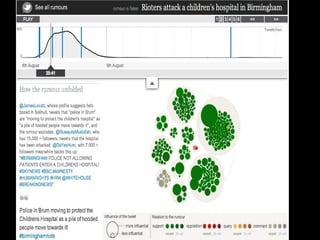
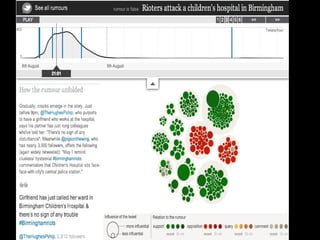
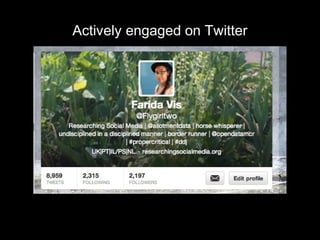
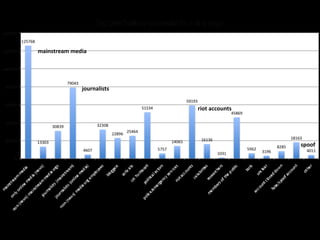
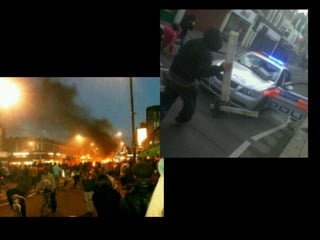
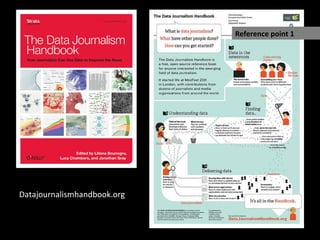
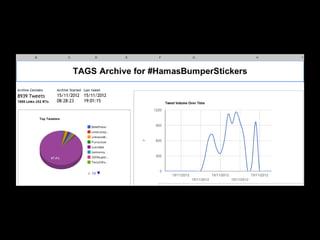
![What role did social media play?
2.6 million riot tweets (donated by Twitter)
–
700,000 individual accounts
Initially:
o Role of Rumours
o Did incitement take place? [no - #riotcleanup]
o What is the role of different actors on Twitter?](https://image.slidesharecdn.com/srakeynotejune2013farida-130627044122-phpapp02/85/Twitter-analytics-some-thoughts-on-sampling-tools-data-ethics-and-user-requirements-3-320.jpg)
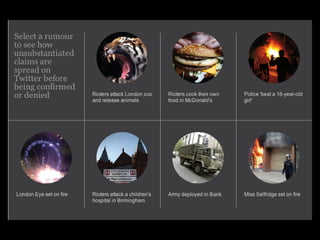

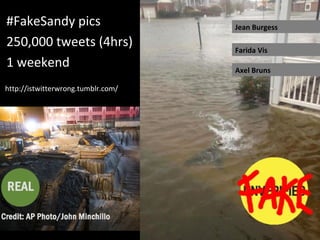
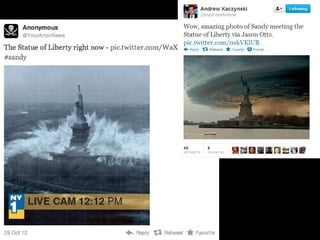
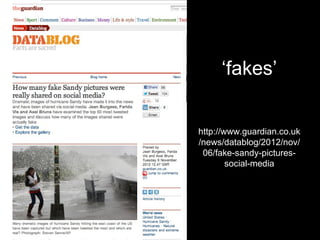
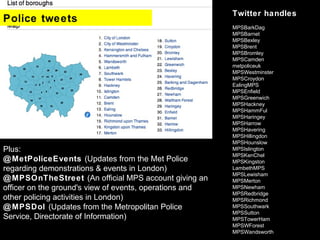
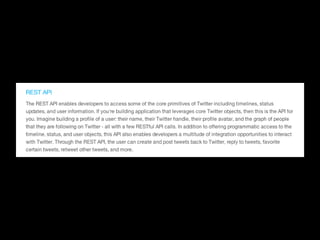


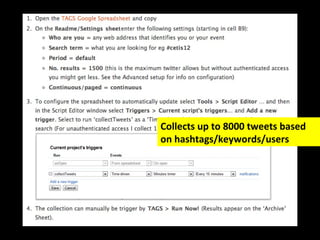
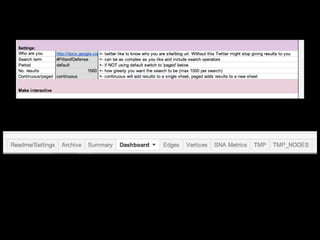


The document discusses the role of Twitter in analyzing social phenomena, citing the case study of the 2011 UK riots where 2.6 million tweets were examined. It highlights challenges in data collection and methodology, including biases in APIs and the need for rigorous sampling procedures. Ethical considerations and user requirements for effective research tools are also addressed throughout the presentation.